

The figures for new Department of Building project filings in New York City for the second and third quarter of 2021 are in, and the results are positively impressive. During the half-year period spanning April through September, builders have filed new permits for a total of 1,023 buildings, which range from skyline-altering skyscrapers to humble single-car garages. The total volume of these proposals adds up to 21,111,222 square feet, much of which will be residential space. Upon completion, the buildings will add a combined 19,052 residences, an impressive number even if it still falls short of the city’s dire need for new housing. The full Excel spreadsheet of all Q2 and Q3 2021 applications is available with purchase of the Building Wire subscription.
Number of filings per month
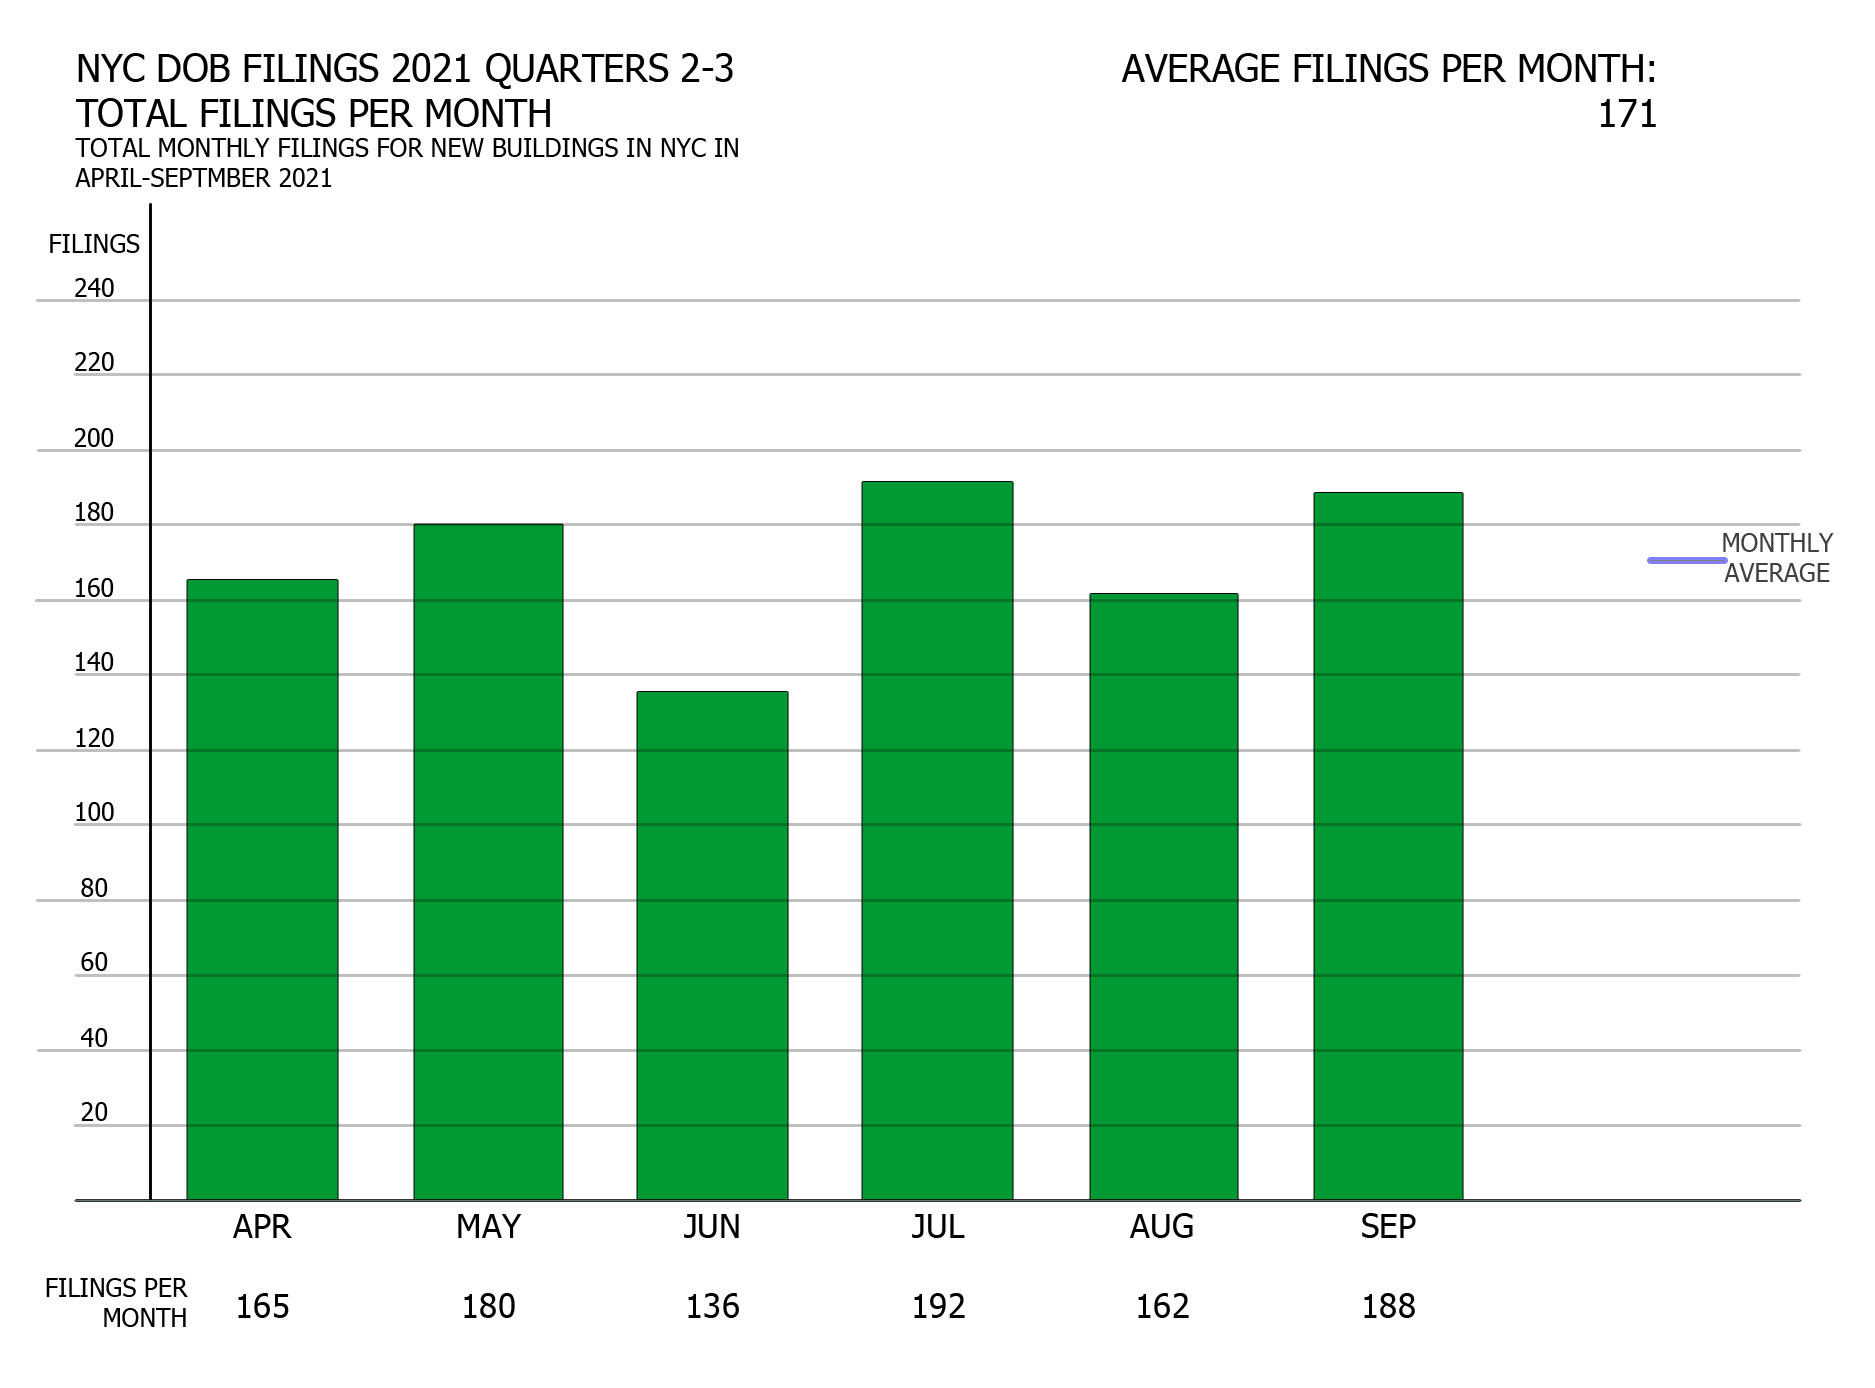
Number of filings per month in New York City 2021 Q2-Q3. Credit: Vitali Ogorodnikov
The past half year saw consistent permit filing stats for every month, in a testament to the industry’s enduring enthusiasm about the city’s real estate market. Aside from a (still respectable) June low of 136 filings, the highest and lowest monthly filing counts saw a difference of only 30, between July (192) and August (162).
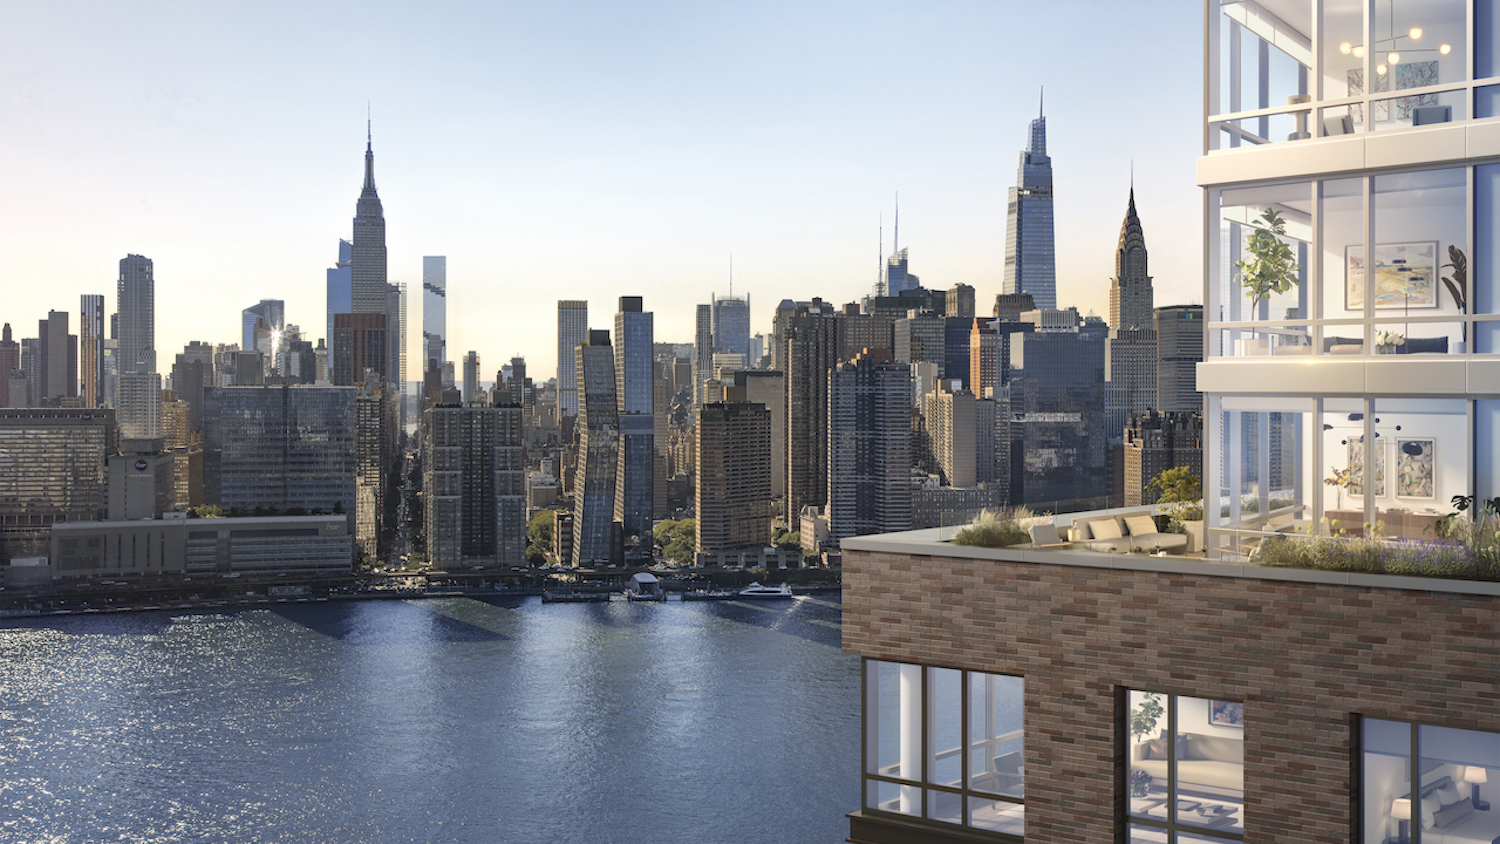
Gotham Point South Tower in Long Island City, Queens via NYC Housing Connect
Filings grouped by floor count
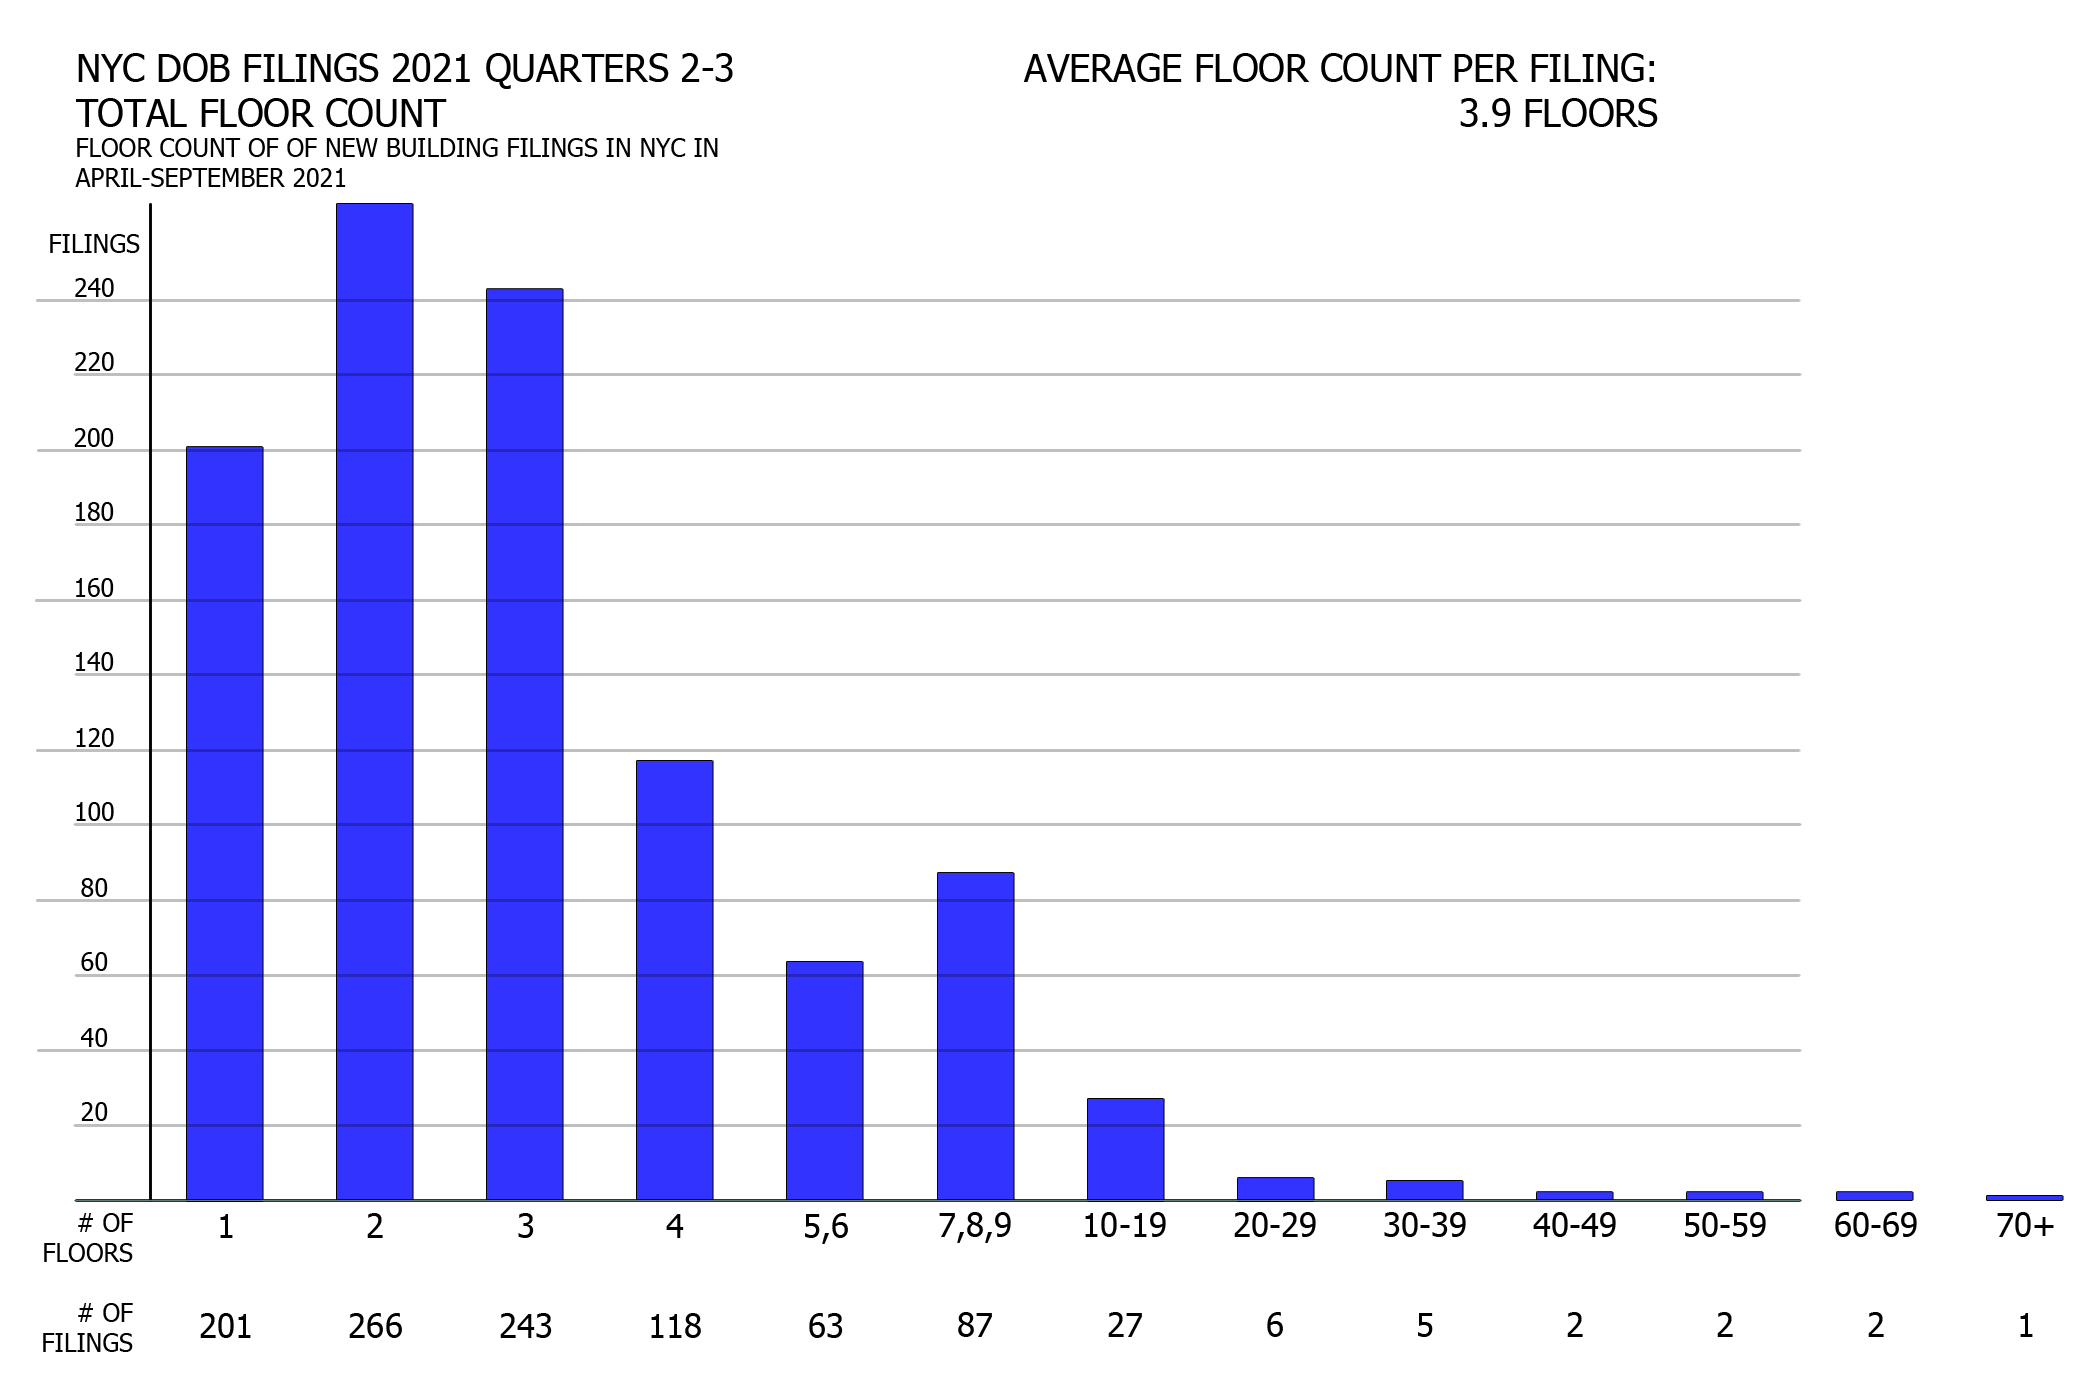
Filings grouped by floor count in New York City 2021 Q2-Q3. Credit: Vitali Ogorodnikov
If all the buildings that were filed in Q2 and Q3 were built together as a single cluster, they would comprise something of a small city by themselves, complete with a dozen or more blocks of low-rise houses and a sizable urban core with over 200 mid-rise buildings. Its rather impressive skyline would be comparable to most mid-size cities in the United States, and would be crowned by a cluster of several towers each rising over 60 stories.
In other words, the city has performed phenomenally in every category. The latest filing tally counts 45 high-rise buildings (ten stories and higher), 268 mid-rise buildings (four to nine stories), and 720 low-rise buildings (one to three stories).
The highest floor count of the group belongs to 265 South Street, a two-towered project proposed in Two Bridges on the Lower East Side on the East River waterfront. Previously known as 260 South Street, the development will replace a desolate parking lot, part of a mid-century apartment complex, with a traditional streetwall, renovated common space for the complex, and 1,313 residential units, which will go a long way to boosting pedestrian presence in a part of the city devastated by misguided towers-in-a-park-style development in the postwar period.
Although the development effectively consists of two high-rises, it only counts as one in our tally as it falls under a single permit filing. The proposal recently won a litigation battle against NIMBY interests, which sought to block its construction even though it was planned in accordance with long-established city regulations.
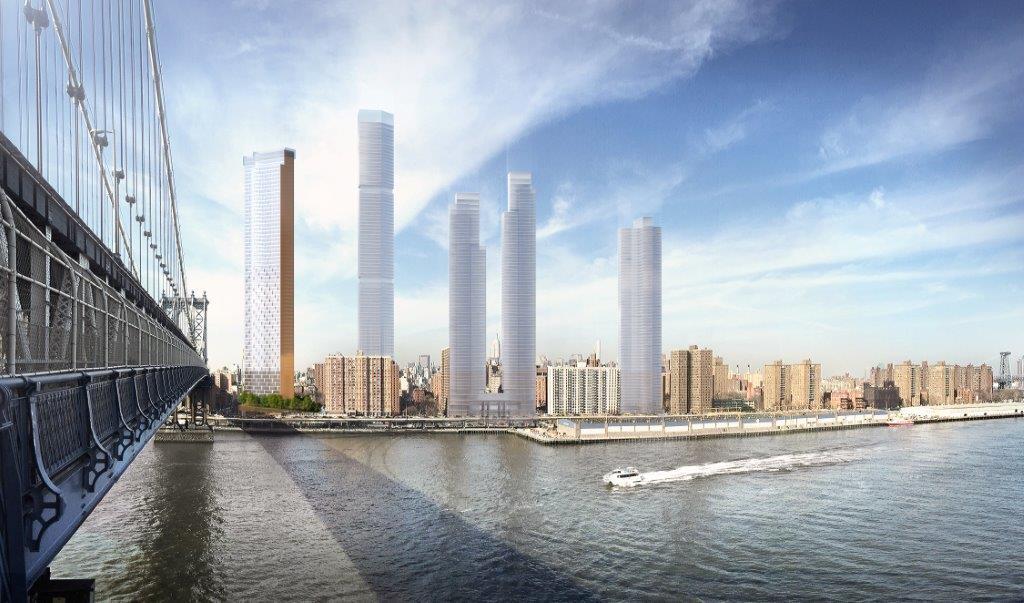
Rendering shows Two Bridges waterfront with several proposed large-scale buildings. Credit: SHoP Architects.
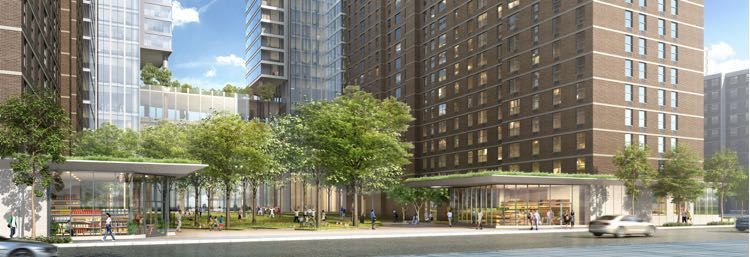
260 South Street. Rendering by Handel Architects.
The project with the second-highest floor count is slated to rise at 42-02 Orchard Street in Long Island City, Queens. While the 69-story development is listed at two floors lower than the Two Bridges proposal, it boasts a taller listed height of 794 feet, as opposed to the former’s 761 feet. Since permit-listed height is unreliable as an exact indicator of total building height, as it generally excludes decorative crowns and mechanical equipment, YIMBY tallies the floor count rather than listed height in its quarterly overviews.
In either case, the proposal at 42-02 Orchard Street, located in the center of the blossoming Court Square neighborhood, will become the tallest building in Queens, beating the nearly fully-completed Skyline Tower for the title, and the city’s tallest building outside of Manhattan and Brooklyn. Notably, the latter recently celebrated the topping out of Brooklyn Tower at 9 DeKalb Avenue, the borough’s new tallest skyscraper and first supertall.
The runners-up in the Top Ten are the 62-story 259 Clinton Street, slated to rise just to the east of 265 South Street; a 54-story apartment tower planned at 1710 Broadway in the Theater District; a 45- and 52-story skyscraper pair at 570 and 589 Fulton Street, respectively, in Downtown Brooklyn; a 40-story high-rise proposed at 201 West 54th Street in Midtown; a 38-story project at 230 Classon Avenue in Brooklyn; and a 53-story tower planned at 23-02 42nd Road in Court Square in Queens. Rounding off the list is the 34-story high-rise planned at 15 Hanover Place in Downtown Brooklyn.
9 DeKalb Avenue. Photo by Michael Young
Filings grouped by floor area

Filings grouped by floor area in New York City 2021 Q2-Q3. Credit: Vitali Ogorodnikov
As expected, there is a certain overlap between the tallest (by floor count) and largest (by floor area) permit filing lists. At 1,274,280 square feet, the two-towered 265 South Street holds the first place in both, followed nearby (both physically, standing a block away, and figuratively, landing at the #3 spot) by the 655,873-square-foot proposal at 259 Clinton Street. Jumping from #9 on the floor count list to #2 on the floor area tally is Queens’ 42-02 Orchard Street, weighing in at 797,083 square feet. The Brooklyn proposal at 589 Fulton Street takes the fourth place with 597,824 square feet.
The rest of the Top Ten buildings by square area list goes as follows: #5 – 2-33 50th Avenue in Queens (562,607 square feet, 12 floors); #6 – 1 Java Street in Brooklyn (482,669 square feet, 14 floors); #7 – 71 Prince Street in Brooklyn (436,610 square feet, 33 floors); #8 – 11 Ocean Parkway in Brooklyn (395,762 square feet, 13 floors); #9 – 40 Bruckner Boulevard in the Bronx (353,845 square feet, 12 floors), and #10 – 133-25 37th Avenue in Flushing, Queens (306,987 square feet, 16 floors).
However, large buildings make up only a fraction of the total filings for Q2 and Q3. Around 92 percent of total filings span under 50,000 square feet, roughly equivalent to a 50- to 75-unit apartment building. Of these, around one-third span between 3,000 and 5,000 square feet, which corresponds with structures ranging from large suburban-style homes to small apartment buildings with a handful of units.
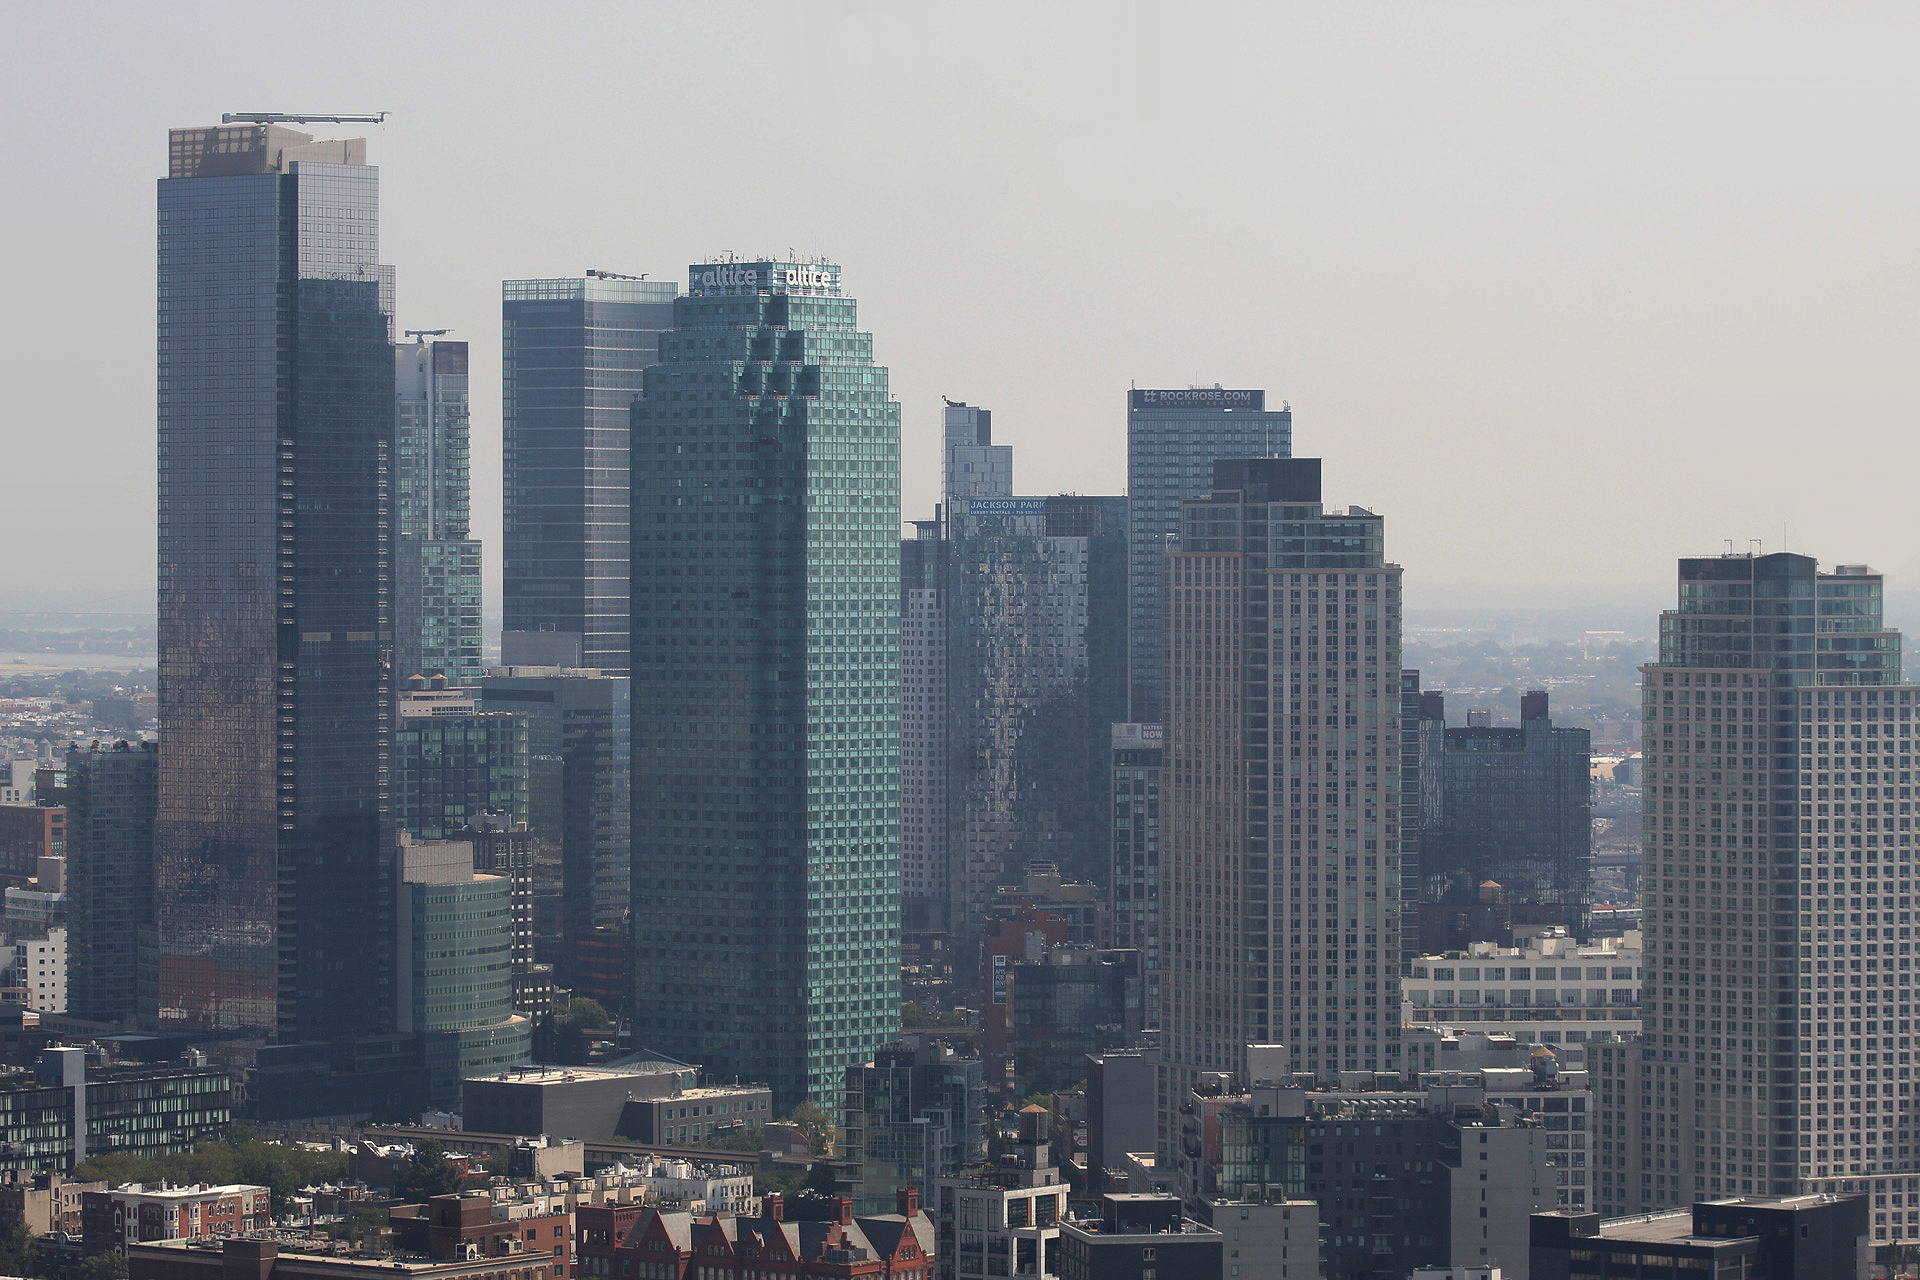
Long Island City. Photo by Michael Young
Number of filings by borough
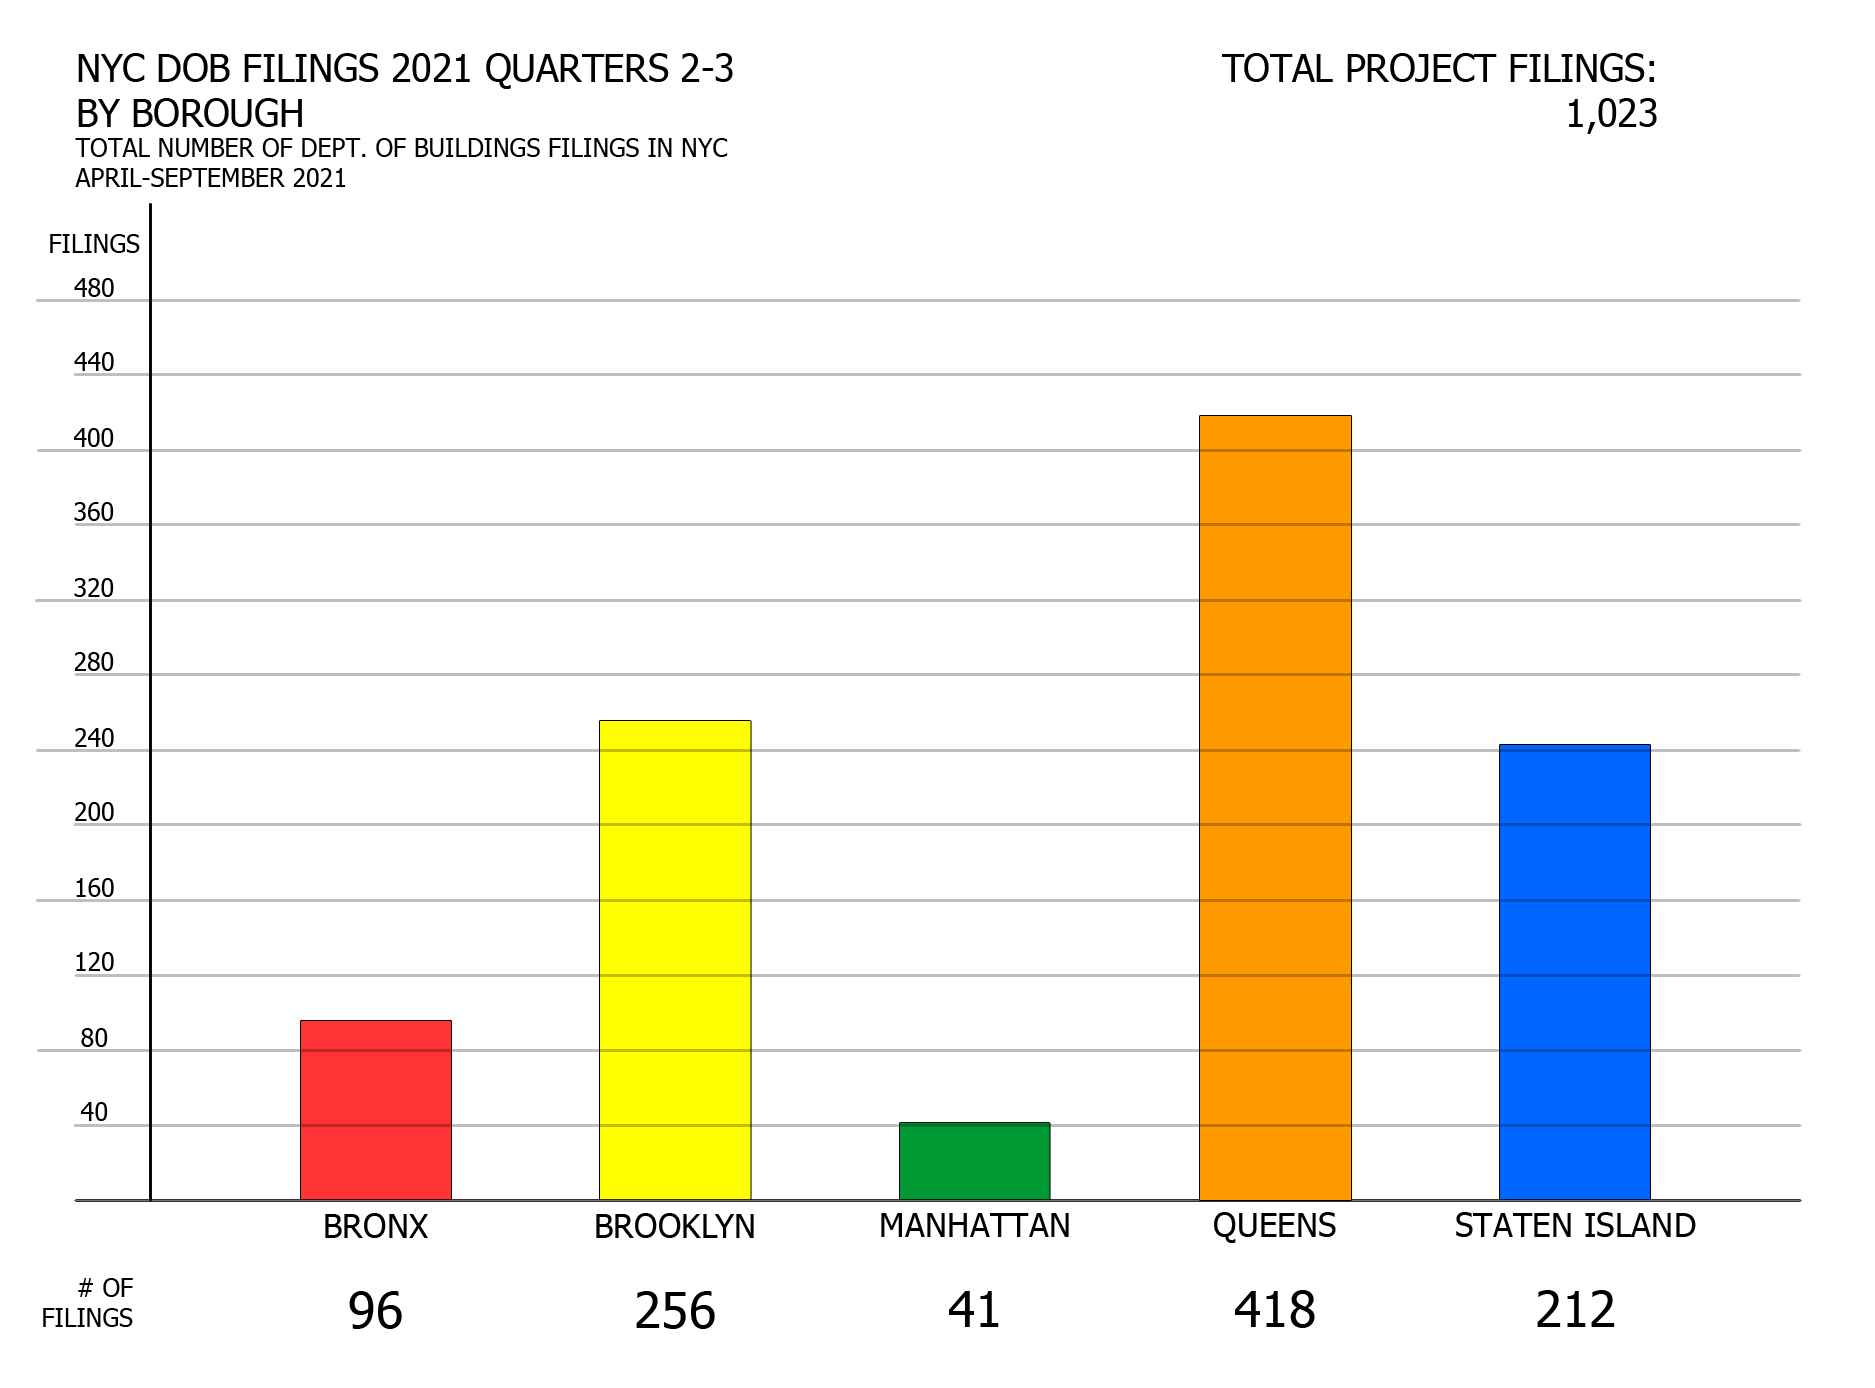
Number of filings by borough in New York City 2021 Q2-Q3. Credit: Vitali Ogorodnikov
As in many of YIMBY’s previous quarterly reports, Queens takes first place when it comes to the number of new building filings, owing its 418-filing count to its sheer size (Queens is the city’s largest borough), population (it’s the second most populous borough), available development-ready properties, and a variety of in-demand neighborhoods that range from skyscraper-embracing Long Island City to almost suburban-style enclaves on its eastern fringes. Altogether, Queens accounts for 41 percent of total filings in New York City in the second and third quarters.
Brooklyn and Staten Island jockey closely for the second and third place, with 256 and 212 filings, respectively, slightly edging out Queens’ total when combined. As is the trend for our quarterly reports, Staten Island’s formidable-looking count is inflated with a large number of single-family homes and garages.
On the flip side, the Bronx and Manhattan round off the list with 96 and 41 filings, respectively, although these are boroughs where sheer building size, rather than total count, is the primary indicator of development patterns.
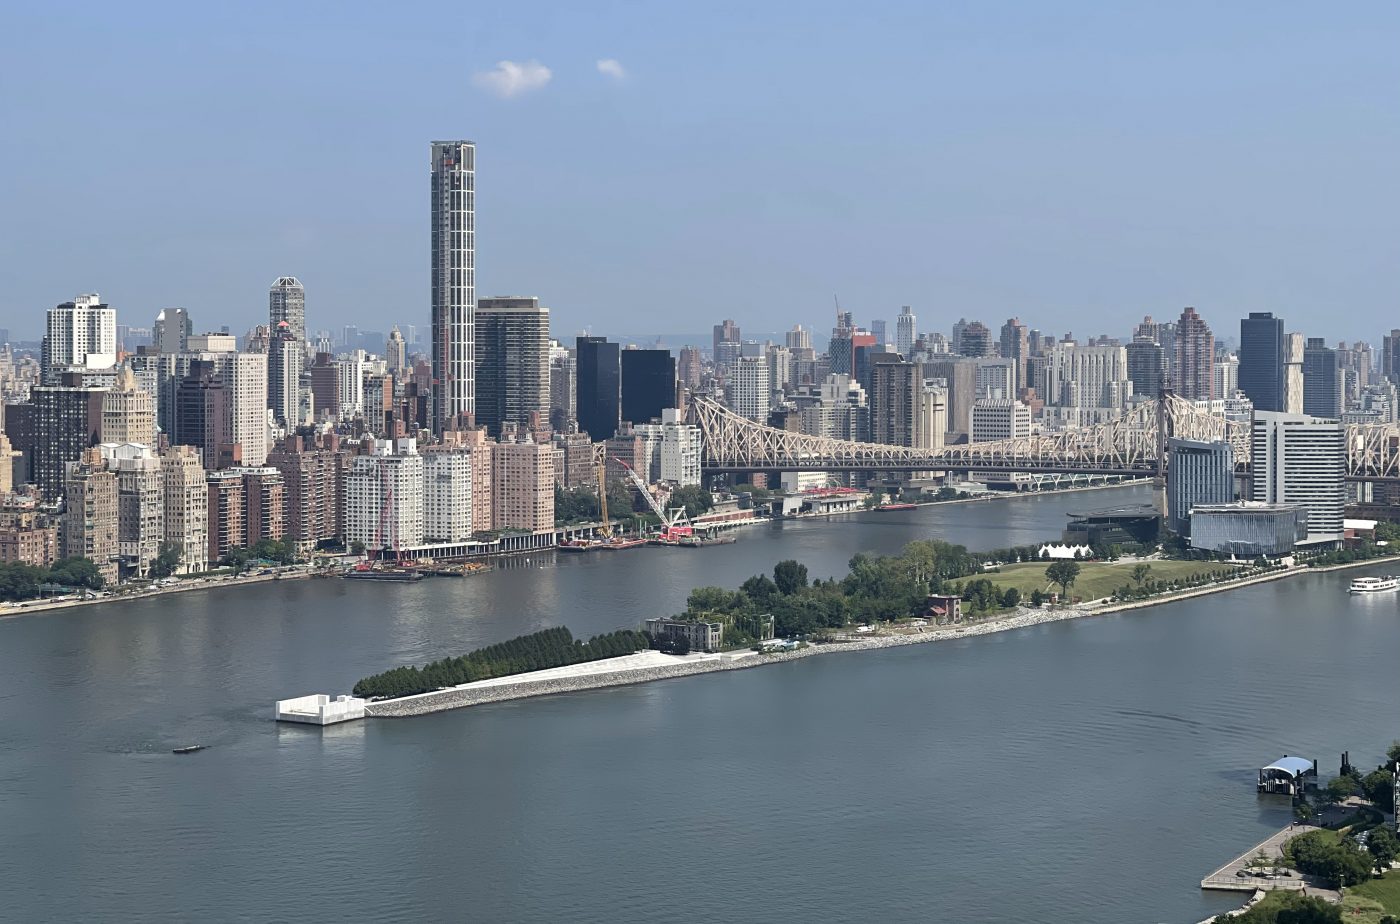
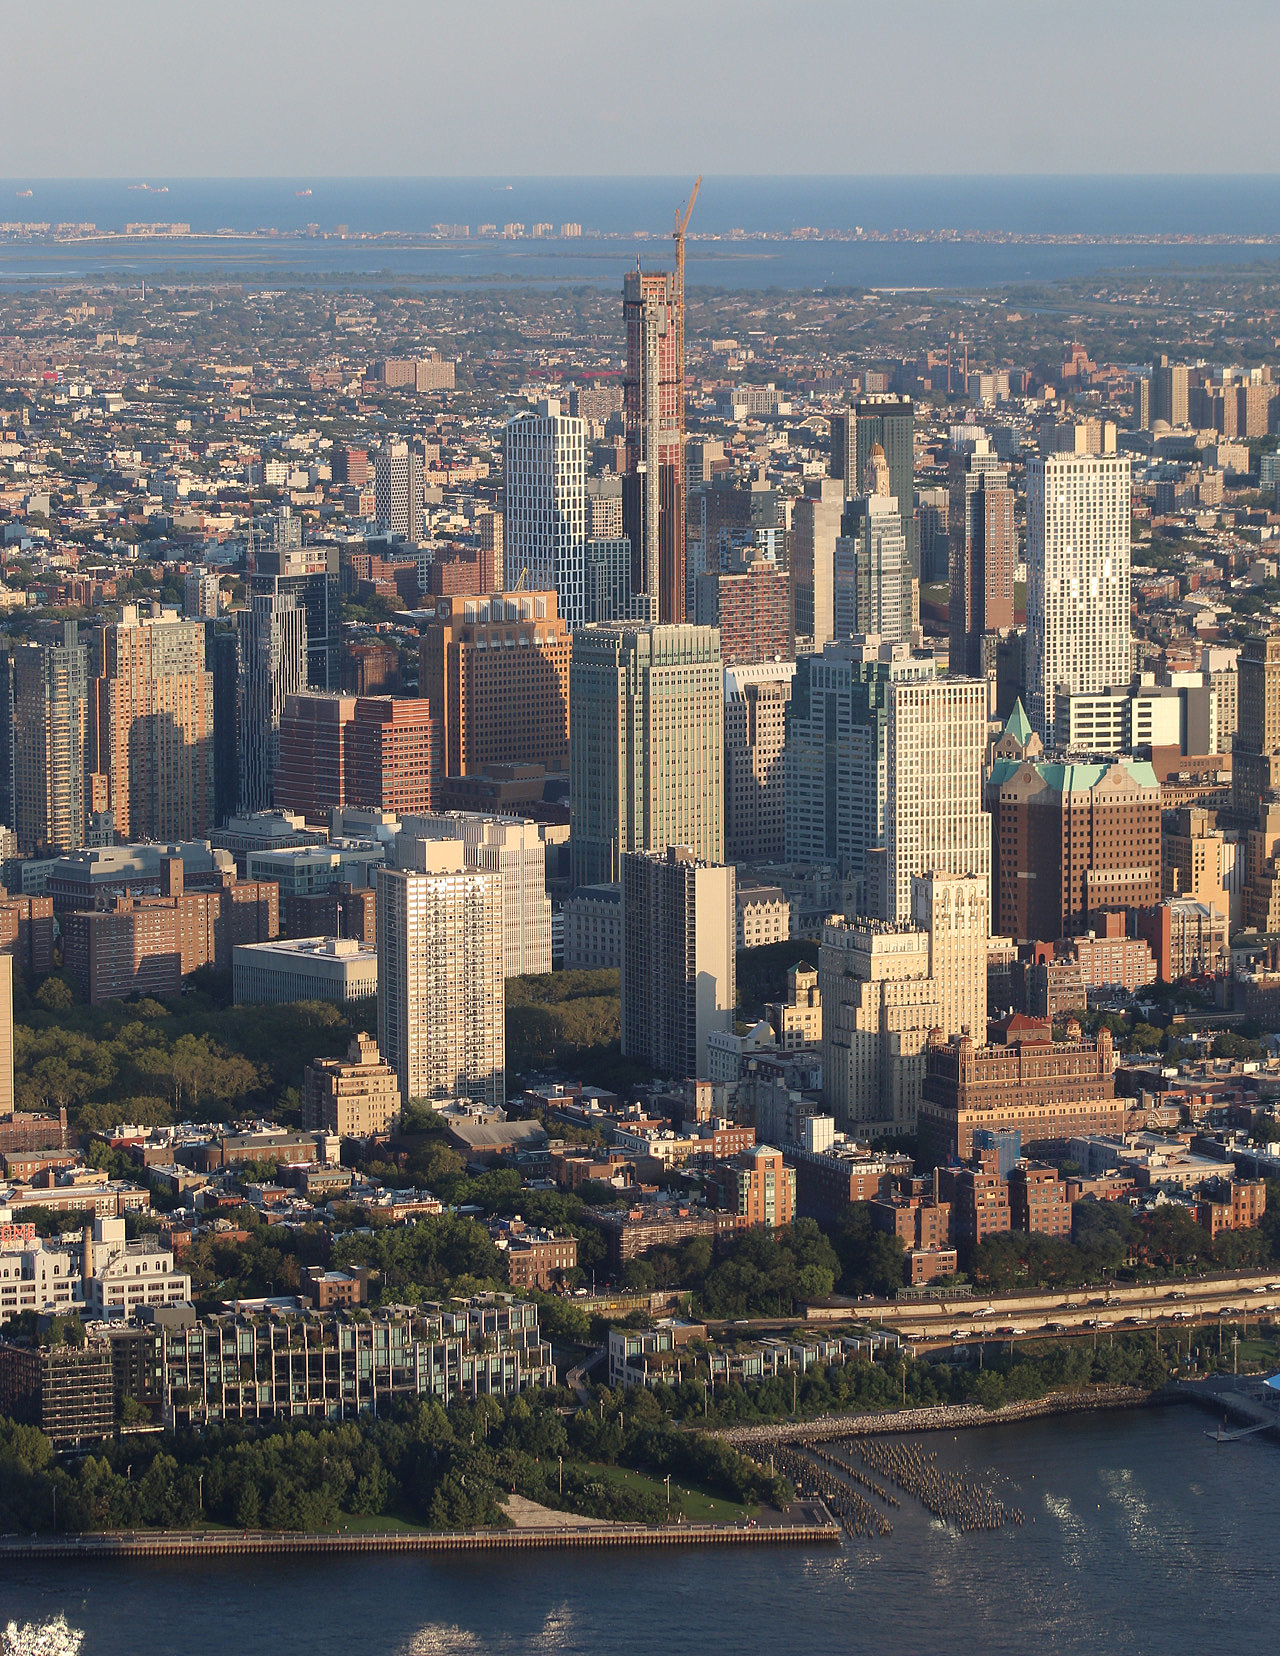
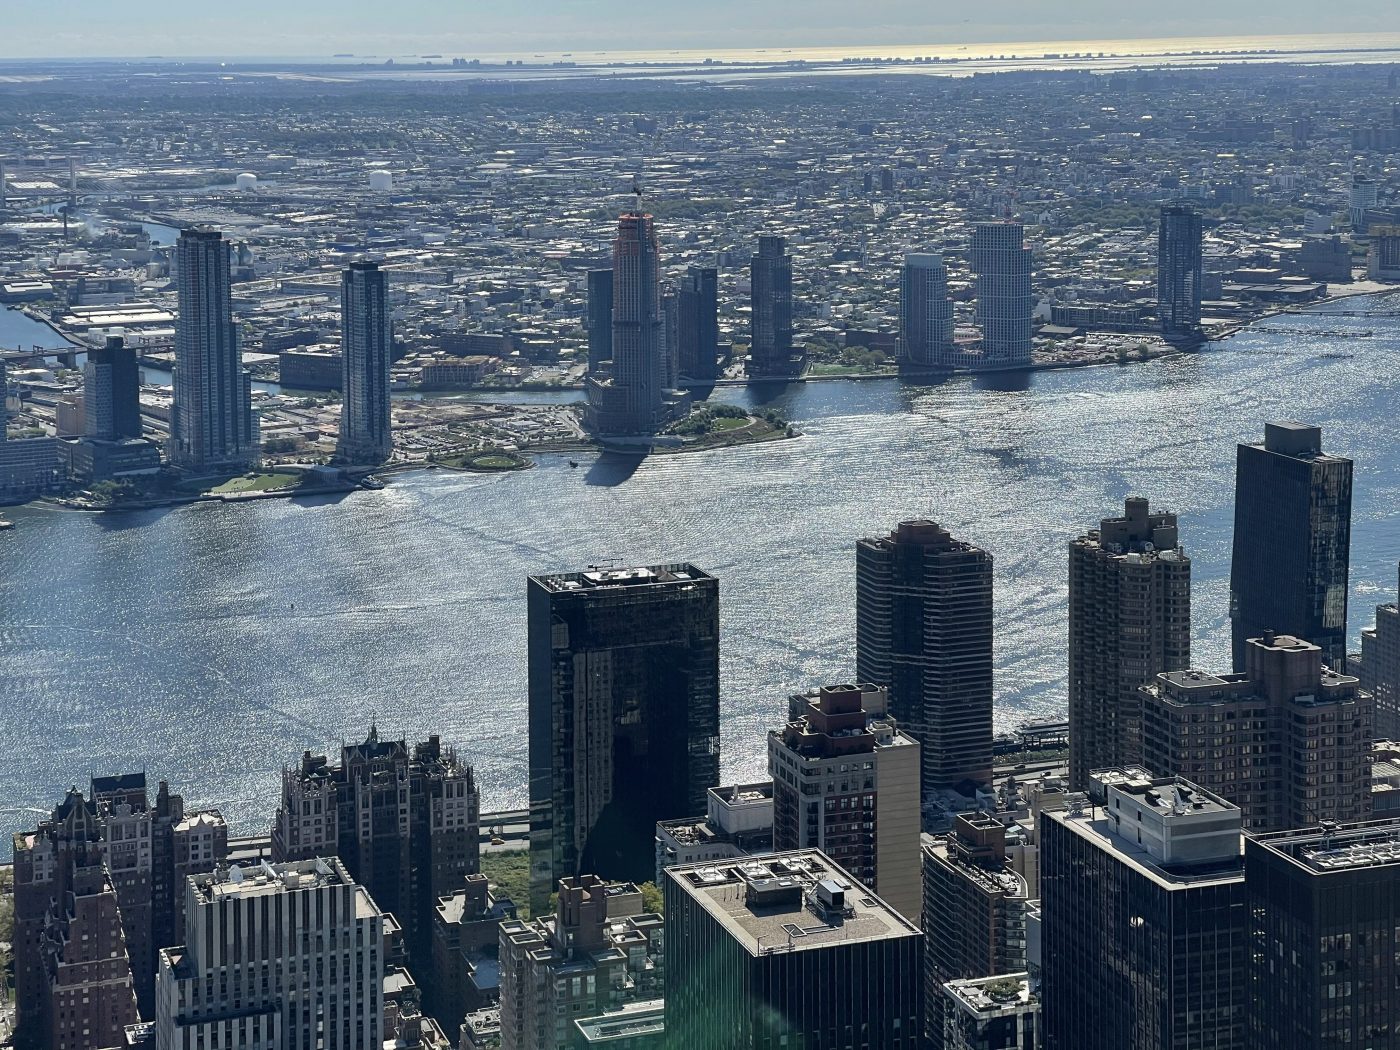
Looking north towards Roosevelt Island and the Upper East Side. Photo by Michael Young
Average floor count per borough
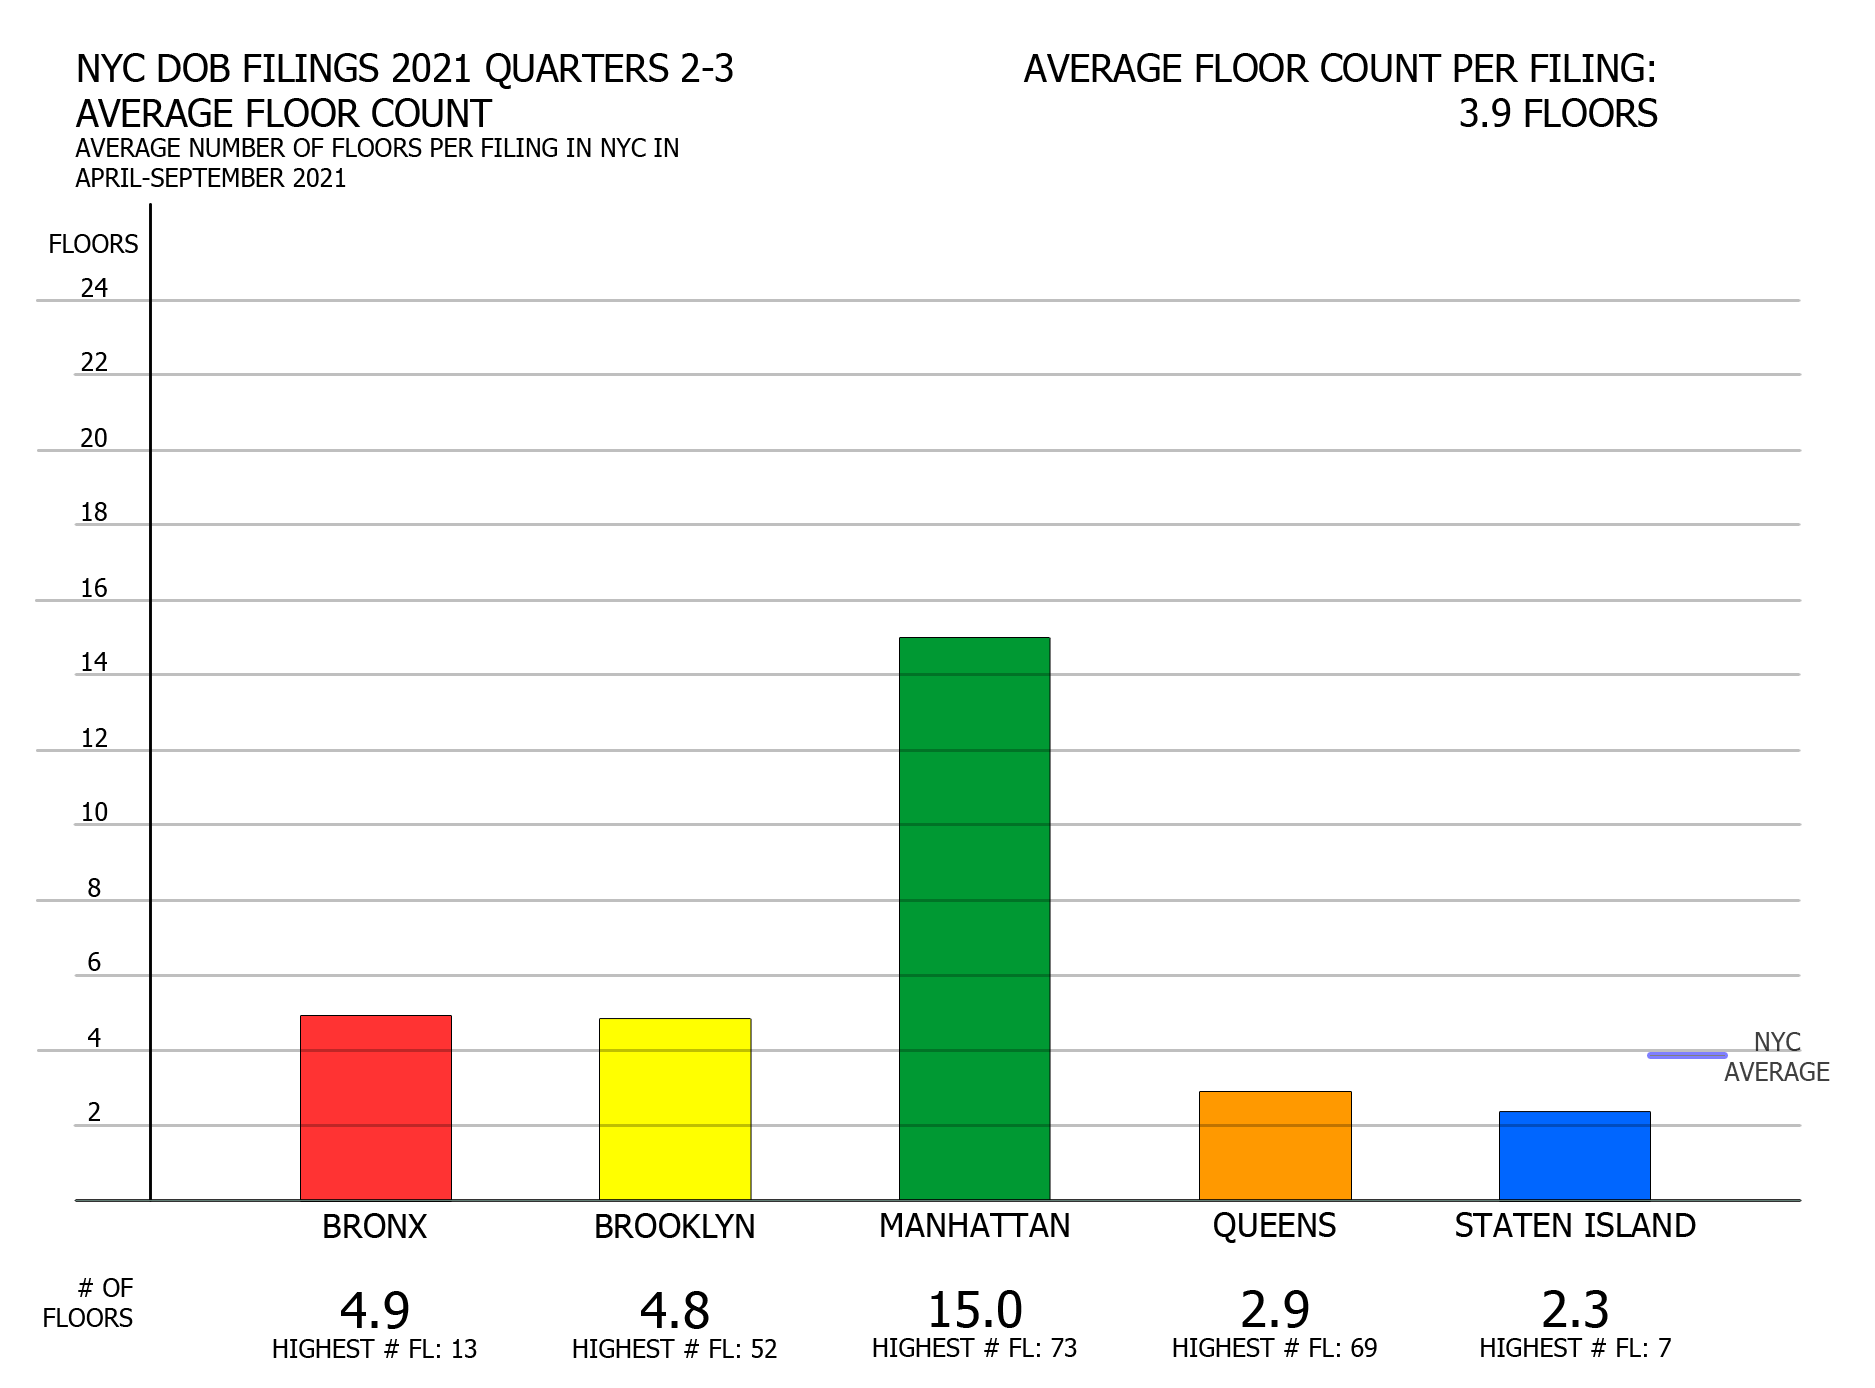
Average floor count per borough in New York City 2021 Q2-Q3. Credit: Vitali Ogorodnikov
During the second and third quarters of 2021, New York City has essentially maintained its long-running floor count average per filing, dropping just one decimal point below the last report’s figure down to 3.9 floors per permit. Similarly predictable is the ranking among the five boroughs, at least to anyone with even glancing familiarity with the city.
As expected, Manhattan, known around the globe for its iconic skyline, is well ahead of the pack with 15 average floors per filing, more than triple the figure for runners-up Bronx and Brooklyn. The latter two come in at 4.9 and 4.8 floors per average filing, respectively, in a testament to their persistent density and culture of apartment dwelling. For reference, both figures measure slightly above the total city average for the two quarters.
By contrast, sprawling Queens and Staten Island trail the count with respective averages of 2.9 and 2.3 floors per filing. In a way, Queens’ decidedly low-rise average may be surprisingly low given its ever-more-prominent skyline. In turn, Staten Island’s average, if anything, is surprisingly high for a borough with a predominance of filings in the single-family and garage categories.
The picture is somewhat different for floor count record-holders in each borough. The highest floor-count filing is found at 265 South Street in Manhattan, which is hardly surprising, although its Lower East Side location well outside of the Downtown and Midtown skyscraper cores may come off as unexpected to the casual observer.
Just as surprising may be the fact that the roughly equally tall 69-story tower planned at 42-02 Orchard Street in Queens is still not enough to significantly boost the borough’s second-lowest floor count average among its peers (without the tower, the average for Queens filings would drop by just 0.15 floors).
Although the Bronx and Brooklyn are virtually tied for second place in terms of average floor counts, the tallest Q2 and Q3 proposal in Brooklyn, the 52-story 589 Fulton Street, will rise four times as high as its record-holder counterpart in the Bronx, the 13-story tower planned at 1751 Monroe Avenue. This discrepancy indicates a rather consistent trend of mid-rise filings in the Bronx, which contrasts with the greater spread of skyscrapers-to-garages that may be found on the drawing boards in Brooklyn.
The tallest permit filings in Staten Island count only seven stories each, a record shared by developments planned at 160 Richmond Terrace and 400 Lake Avenue. In SI, only four other proposals filed over the course of the past year are planned to rise higher than three stories.
The exterior facade of One Vanderbilt. Photo by Michael Young
Total proposed floor area per borough
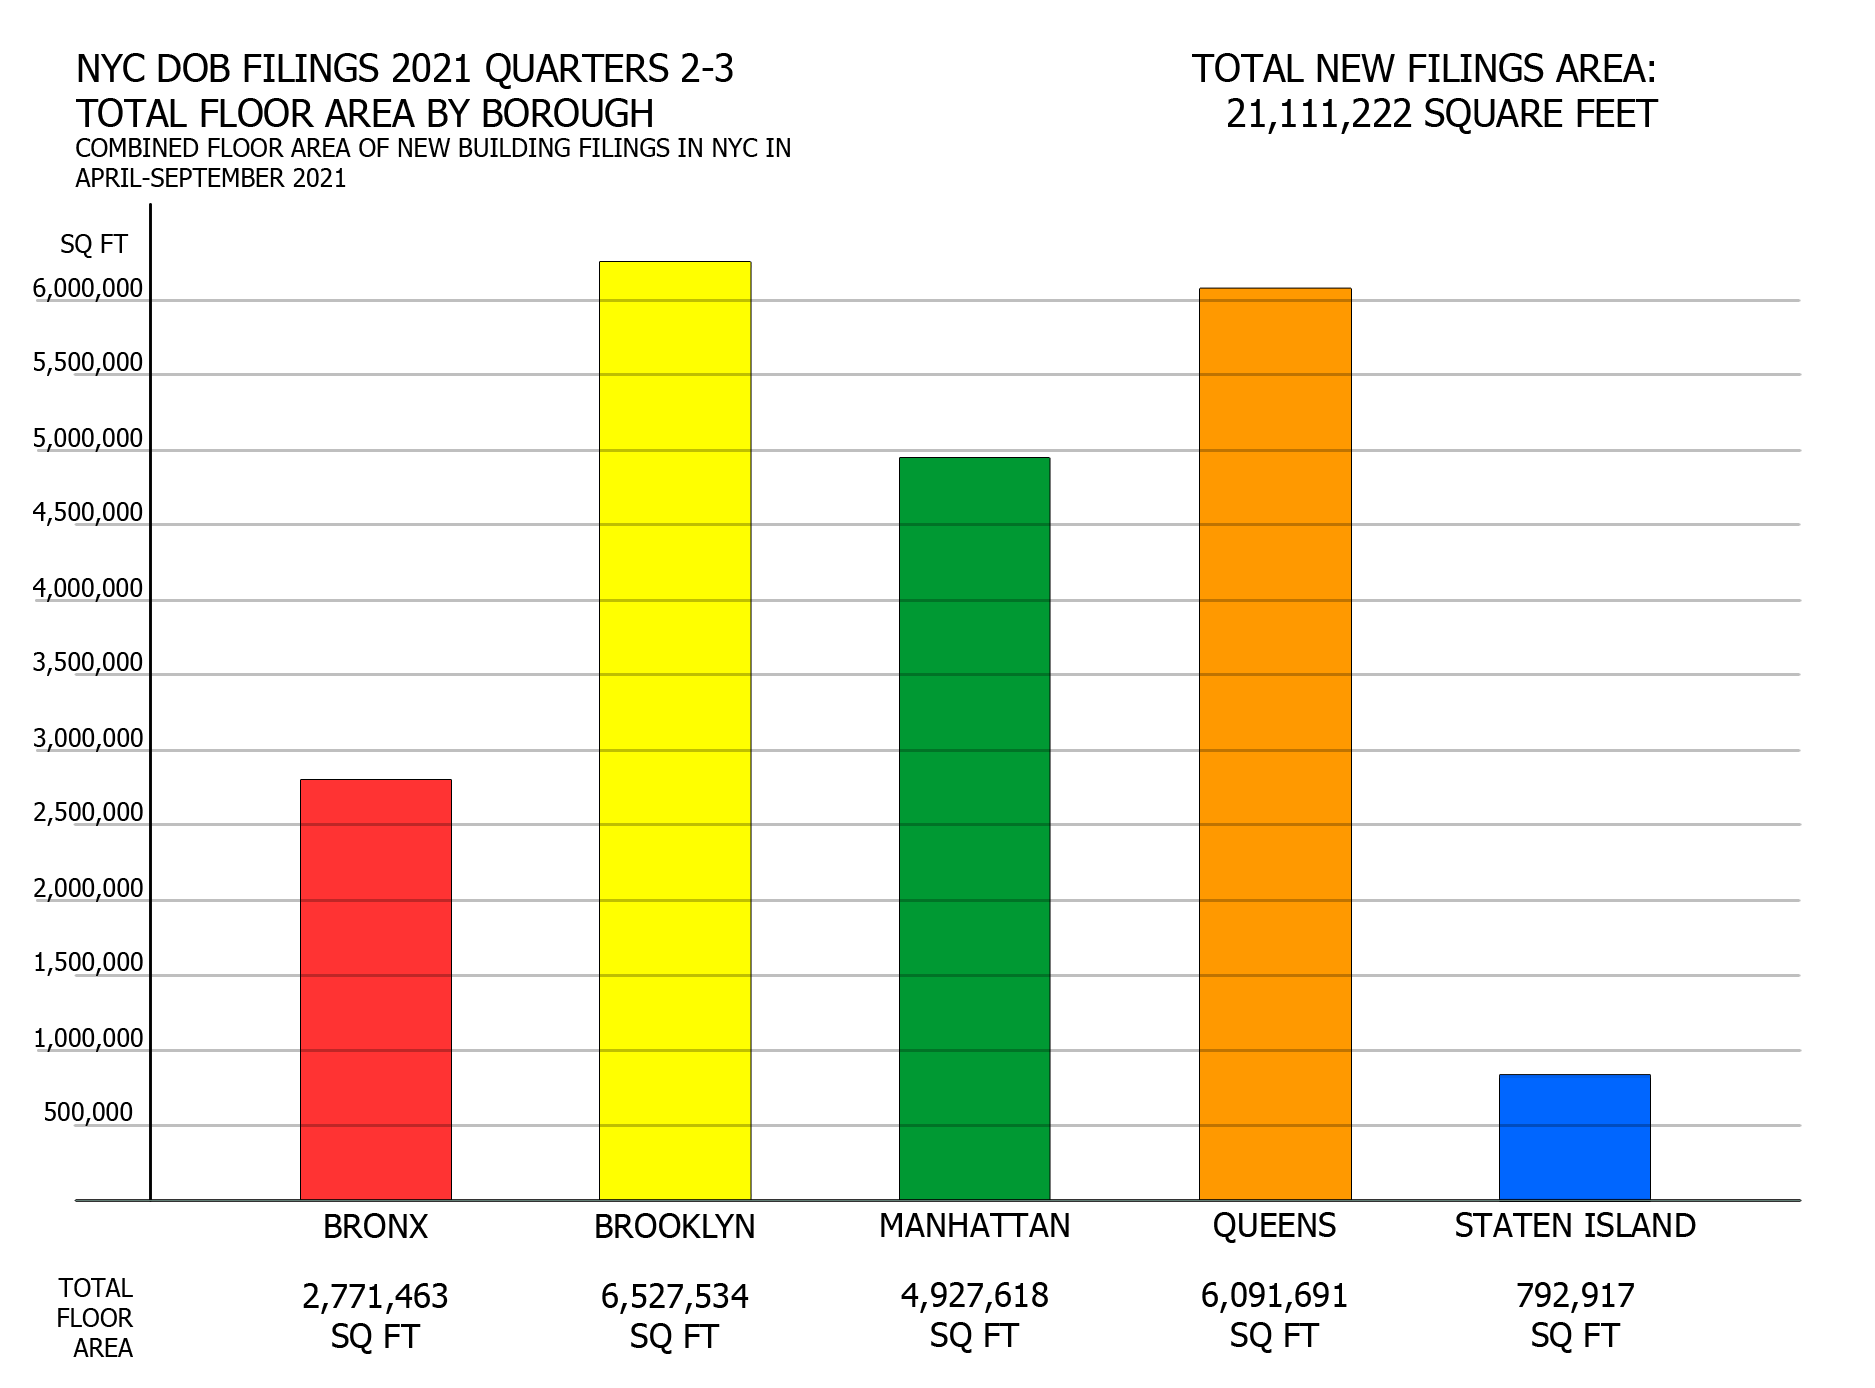
Total proposed floor area per borough in New York City 2021 Q2-Q3. Credit: Vitali Ogorodnikov
Rather than the total number of filings, the combined building square footage is arguably a more effective indicator of the sheer volume of planned construction. Although Queens has nearly double the filing count of Brooklyn, it slightly trails the latter in terms of the square footage filed for in the past half year, where Brooklyn’s 6,527,534-square-foot total sits comfortably ahead of Queens’ 6,091,691 combined square feet.
On the other hand, the largest permit filing in Queens (42-02 Orchard Street, 797,083 square feet) far outweighs Brooklyn’s greatest heavyweight for the period (589 Fulton Street, 597,824 square feet).
Despite its comparatively low tally in terms of the overall filing count, in terms of square footage, Manhattan takes the third place, with a total of 4,927,618 square feet filed for in Q2 and Q3, not very far behind the footage for Brooklyn and Queens. The tally’s largest development, the two-towered, 1,274,280-square-foot 265 South Street, accounts for slightly over a quarter of the borough’s total. Together, more than four-fifths (83 percent) of the space proposed in NYC during the period was sited in Brooklyn, Queens, and Manhattan.
Although the Bronx trails well behind, its total count of 2,771,463 square feet will still be a significant addition to the Big Apple’s northernmost borough. The largest building on its drawing boards (40 Bruckner Boulevard, 353,845 square feet) makes up more than one-tenth of this volume.
Coming in at last place is Staten Island. Its 792,917 planned square feet of new building space make up less than four percent of the city’s 21-million-square-foot-plus tally for Q2 and Q3. Its largest proposal for the period, the seven-story, 77-unit apartment building planned at 160 Richmond Terrace in St. George near the Ferry, will clock in at a relatively modest 67,892 square feet. Only six other developments planned in the borough breach the 10,000-square-foot threshold, which is roughly equivalent to a ten- to 15-unit apartment building.

The World Trade Center Photo by Michael Young
Average floor area per borough
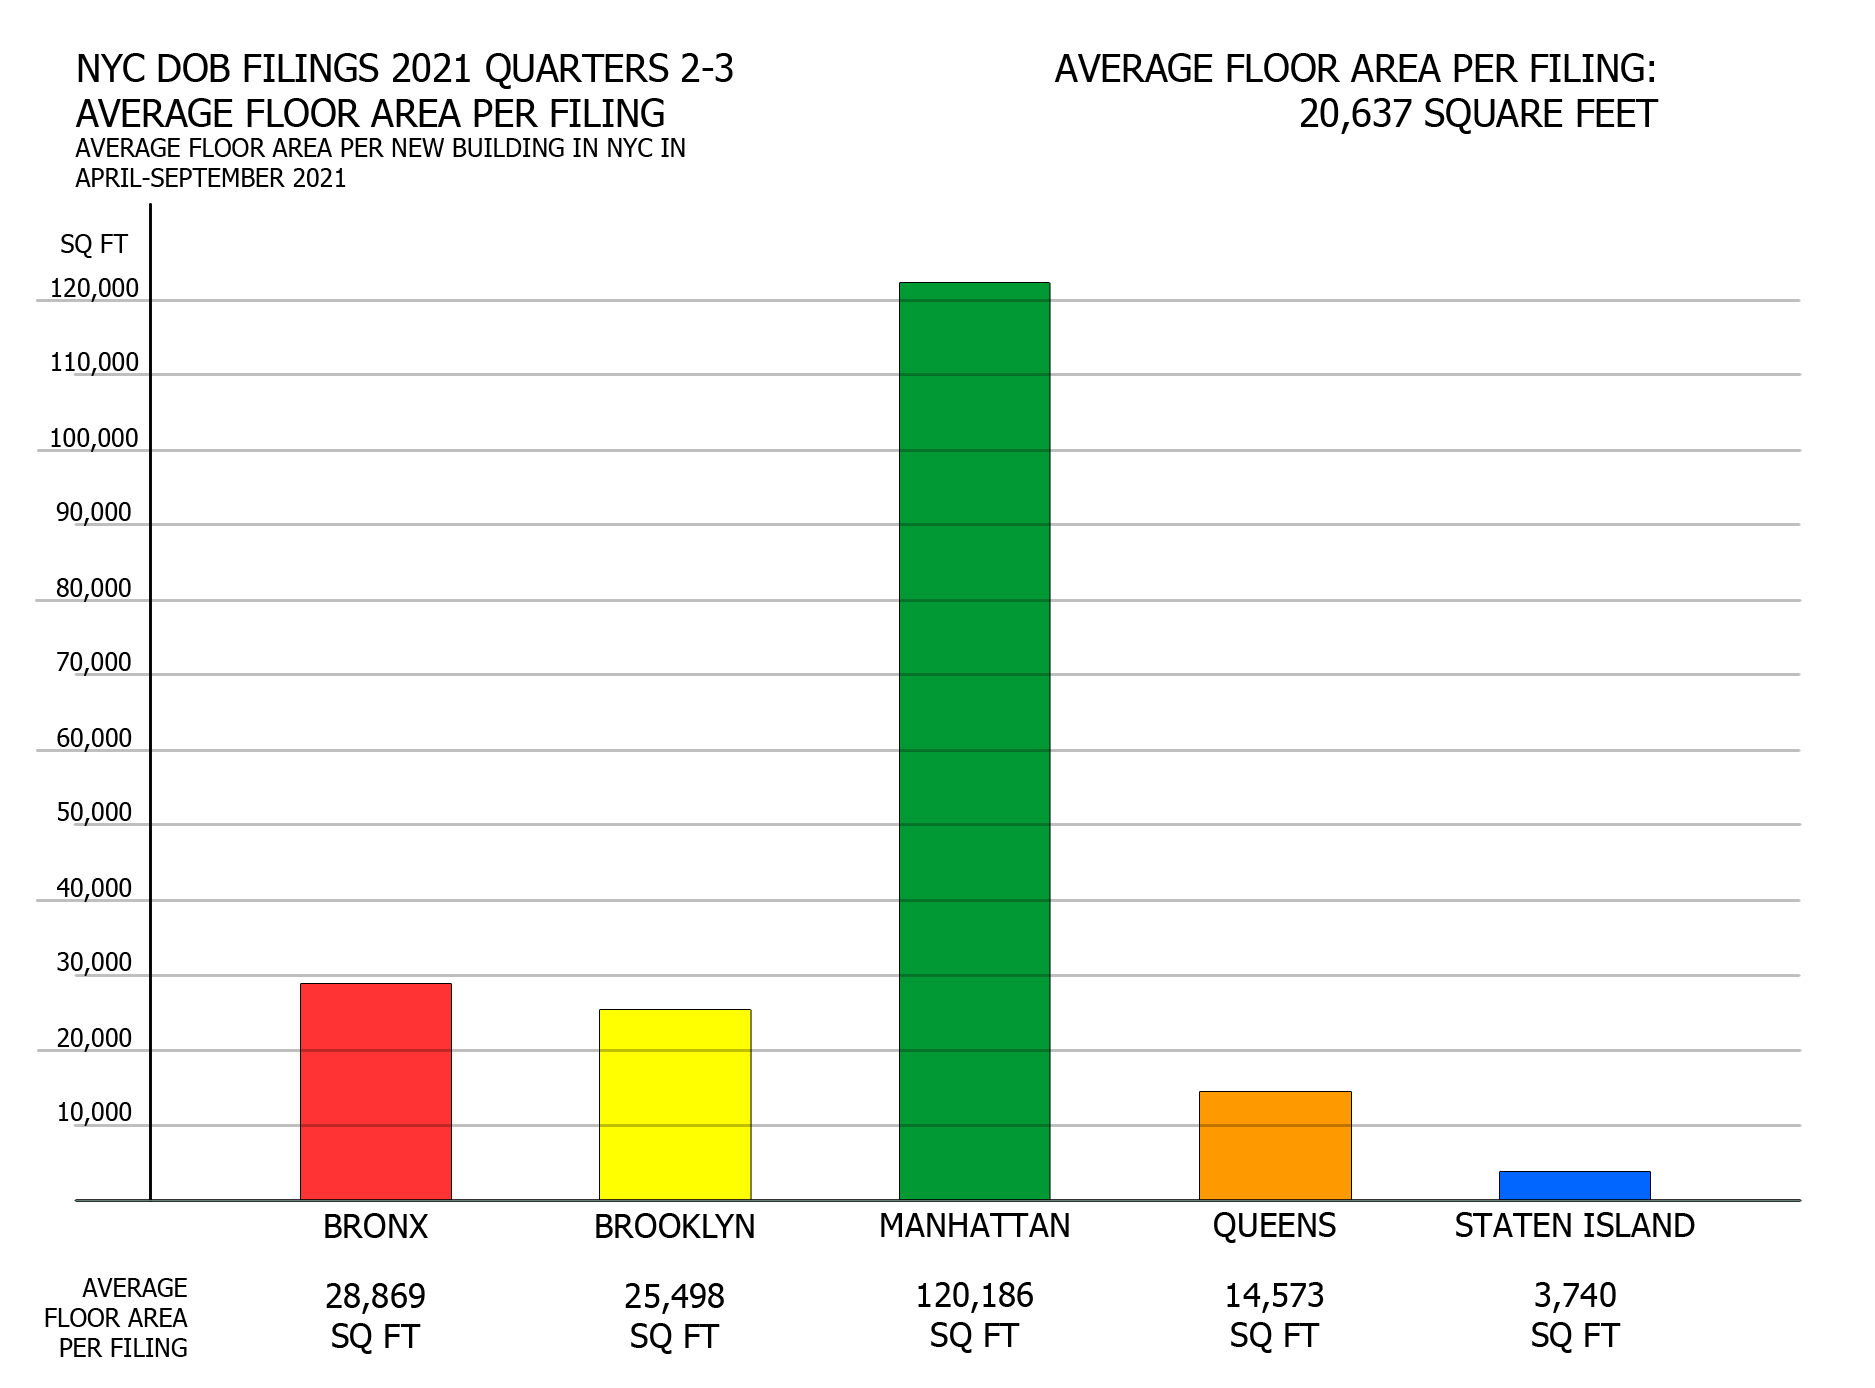
Average floor area per borough in New York City 2021 Q2-Q3. Credit: Vitali Ogorodnikov
The past six months have not been prolific for blockbusting, multi-million-square-foot projects for Manhattan (only one such building, 265 South Street, arrived on its drawing boards during the period). However, its builders continue to display a clear predilection for objectively large buildings, given the borough a leave-competitors-in-the-dust average of 120,186 square feet per filing. Among its 41 permits for the period, 30 come in at over 10,000 square feet, of which 16 will each offer total square footage of over 100,000.
Following a now-familiar trend in terms of proposal scale, the Bronx and Brooklyn are tied in a tight race with averages of 28,869 and 25,498 square feet per filing, respectively. Queens trails well behind with 14,573 per average filing. While Staten Island’s average of 3,740 square feet per filing is objectively paltry, it still reflects an intriguing trend of houses that are unusually large by New York City standards, frequently totaling several thousand square feet apiece.
To give a sense of scale to Manhattan’s lead over its counterparts, its average filing is more than four times the size of the average filing of either Brooklyn or the Bronx, more than eight times the size of the average filing in Queens, and more than 32 times the size of the average filing in Staten Island.
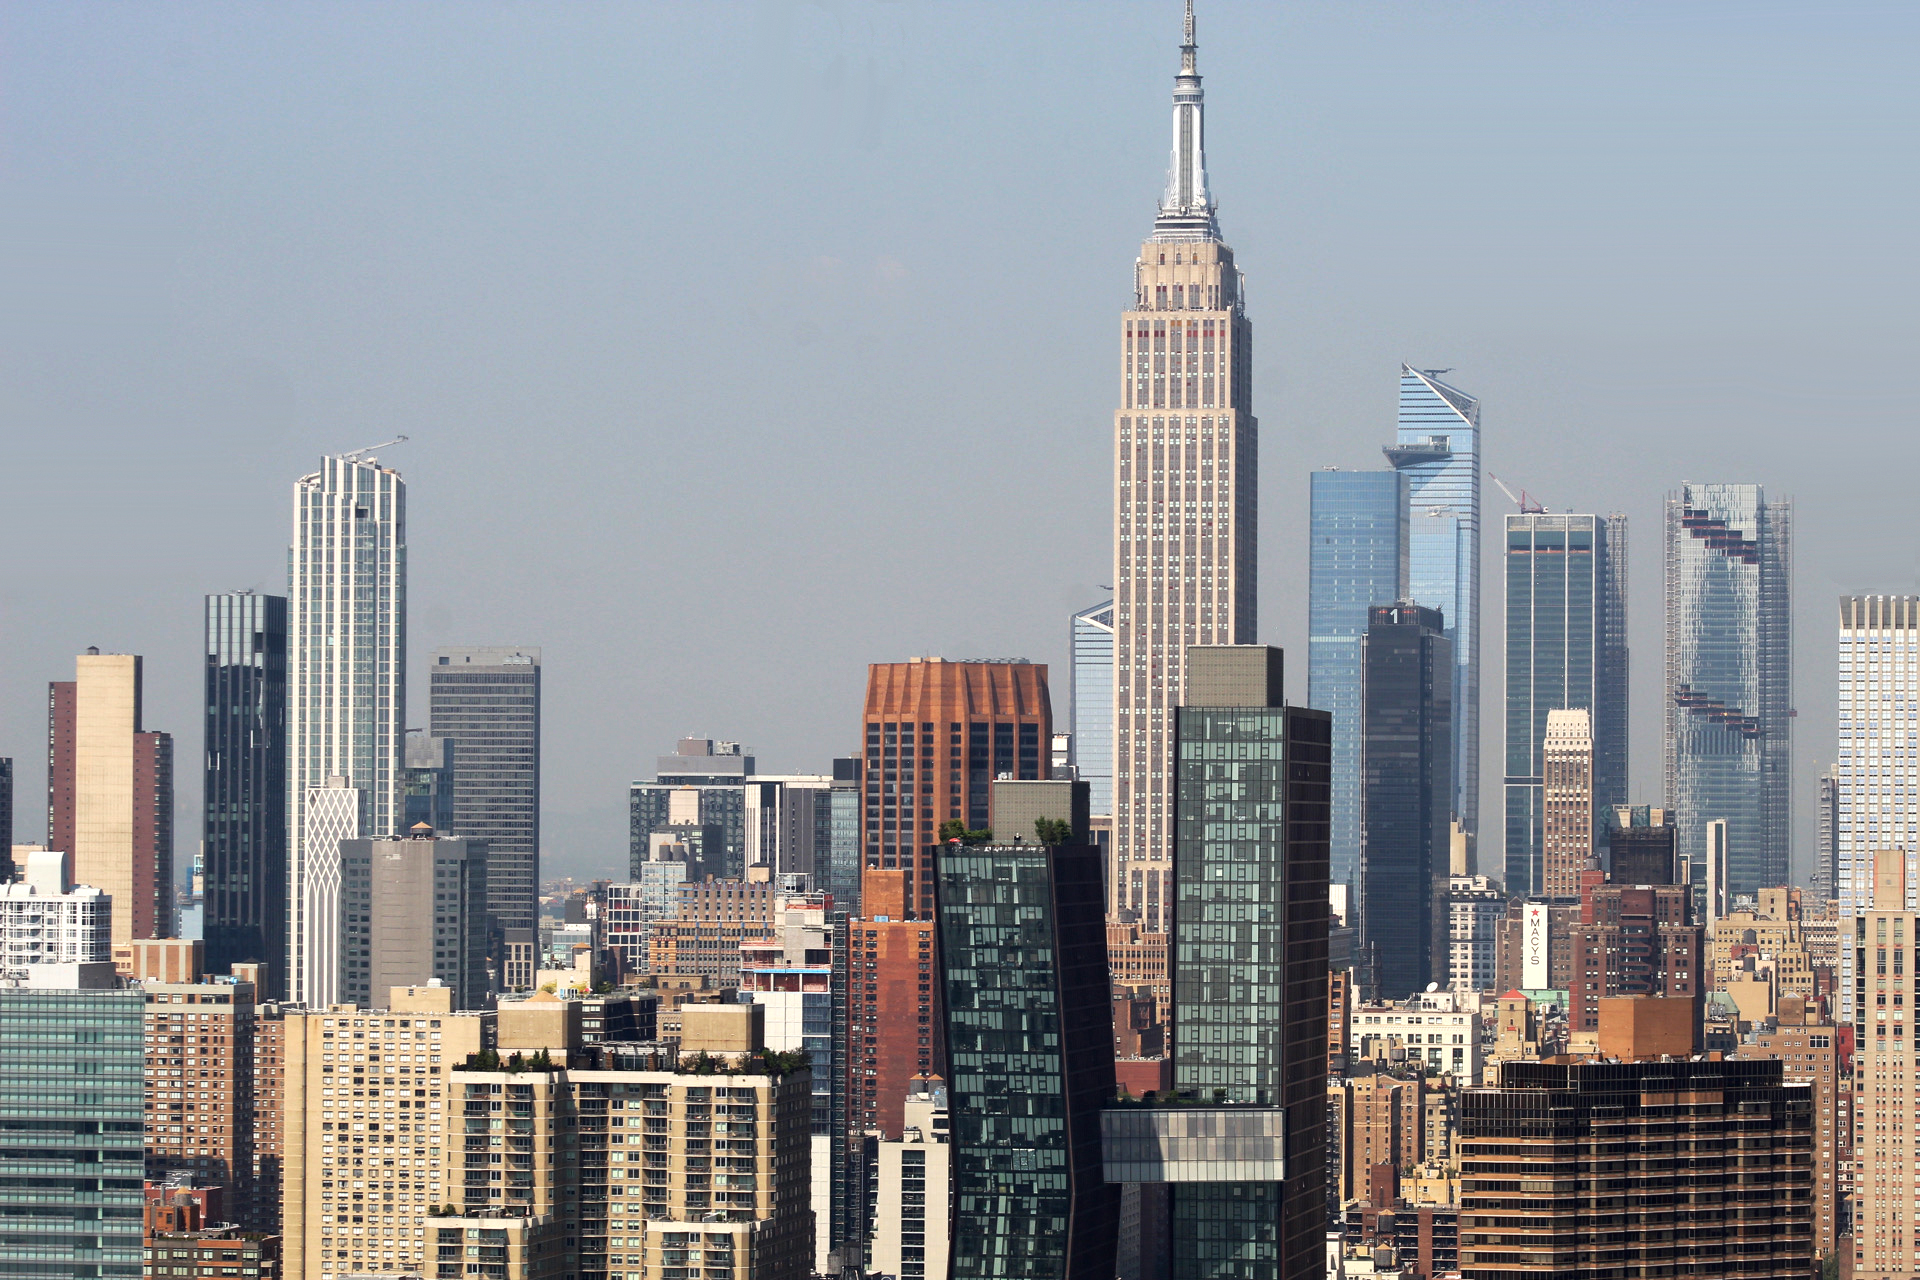
The Empire State Building and Midtown. Photo by Michael Young
Last year, doom-and-gloom pundits penned prophecies predicting the end of New York City as we know it. Instead, as YIMBY steadfastly predicted in prior quarterly and yearly reports, the Big Apple once again shrugged off the naysayers and, in the face of adversity, came back with numbers that show that our growth and faith in the future remains as strong as ever.
As significant as they are, permit filings paint only a part of the whole picture, as they ignore developments that are already underway, had their permits filed prior, or are still on the drawing boards and await their filings. A brief glance at the skyline affirms this notion.
Hudson Yards, a business district in itself large enough to rival entire cities, continues to add top-tier properties to its roster. Brooklyn has just celebrated the topping out of its new tallest tower, and a new tallest skyscraper is now on the drawing boards for Queens. Brand new skylines are rising on the shores of the Bronx, Brooklyn, and Queens, where a growing ferry system is reviving the glory days of the city’s water transit. And even miles away from its towering skyline, numerous neighborhoods continue to add hundreds of new buildings that, though humble in scale, are just as vital for the city’s future.
OMA with Beyer Blinder Belle-designed skyscrapers stands 40 stories high over the Greenpoint, Brooklyn waterfront. Brookfield Property Partners and Park Tower Group
Although the skyline is the physical embodiment of the city’s continued growth, it is also a metaphorical expression of its enduring vitality. The 2020 census showed the city’s population surging to 8.8 million, well above the 8.17 million registered ten years prior, with the metropolitan area’s cities and towns boasting similarly promising figures. Hundreds of miles of bicycle lanes have been added to city streets and wide-ranging programs for pedestrian-friendly initiatives are in the works. Even a simple stroll through one of the city’s numerous vibrant neighborhoods is testament enough to the city’s collective resolve and resiliency.
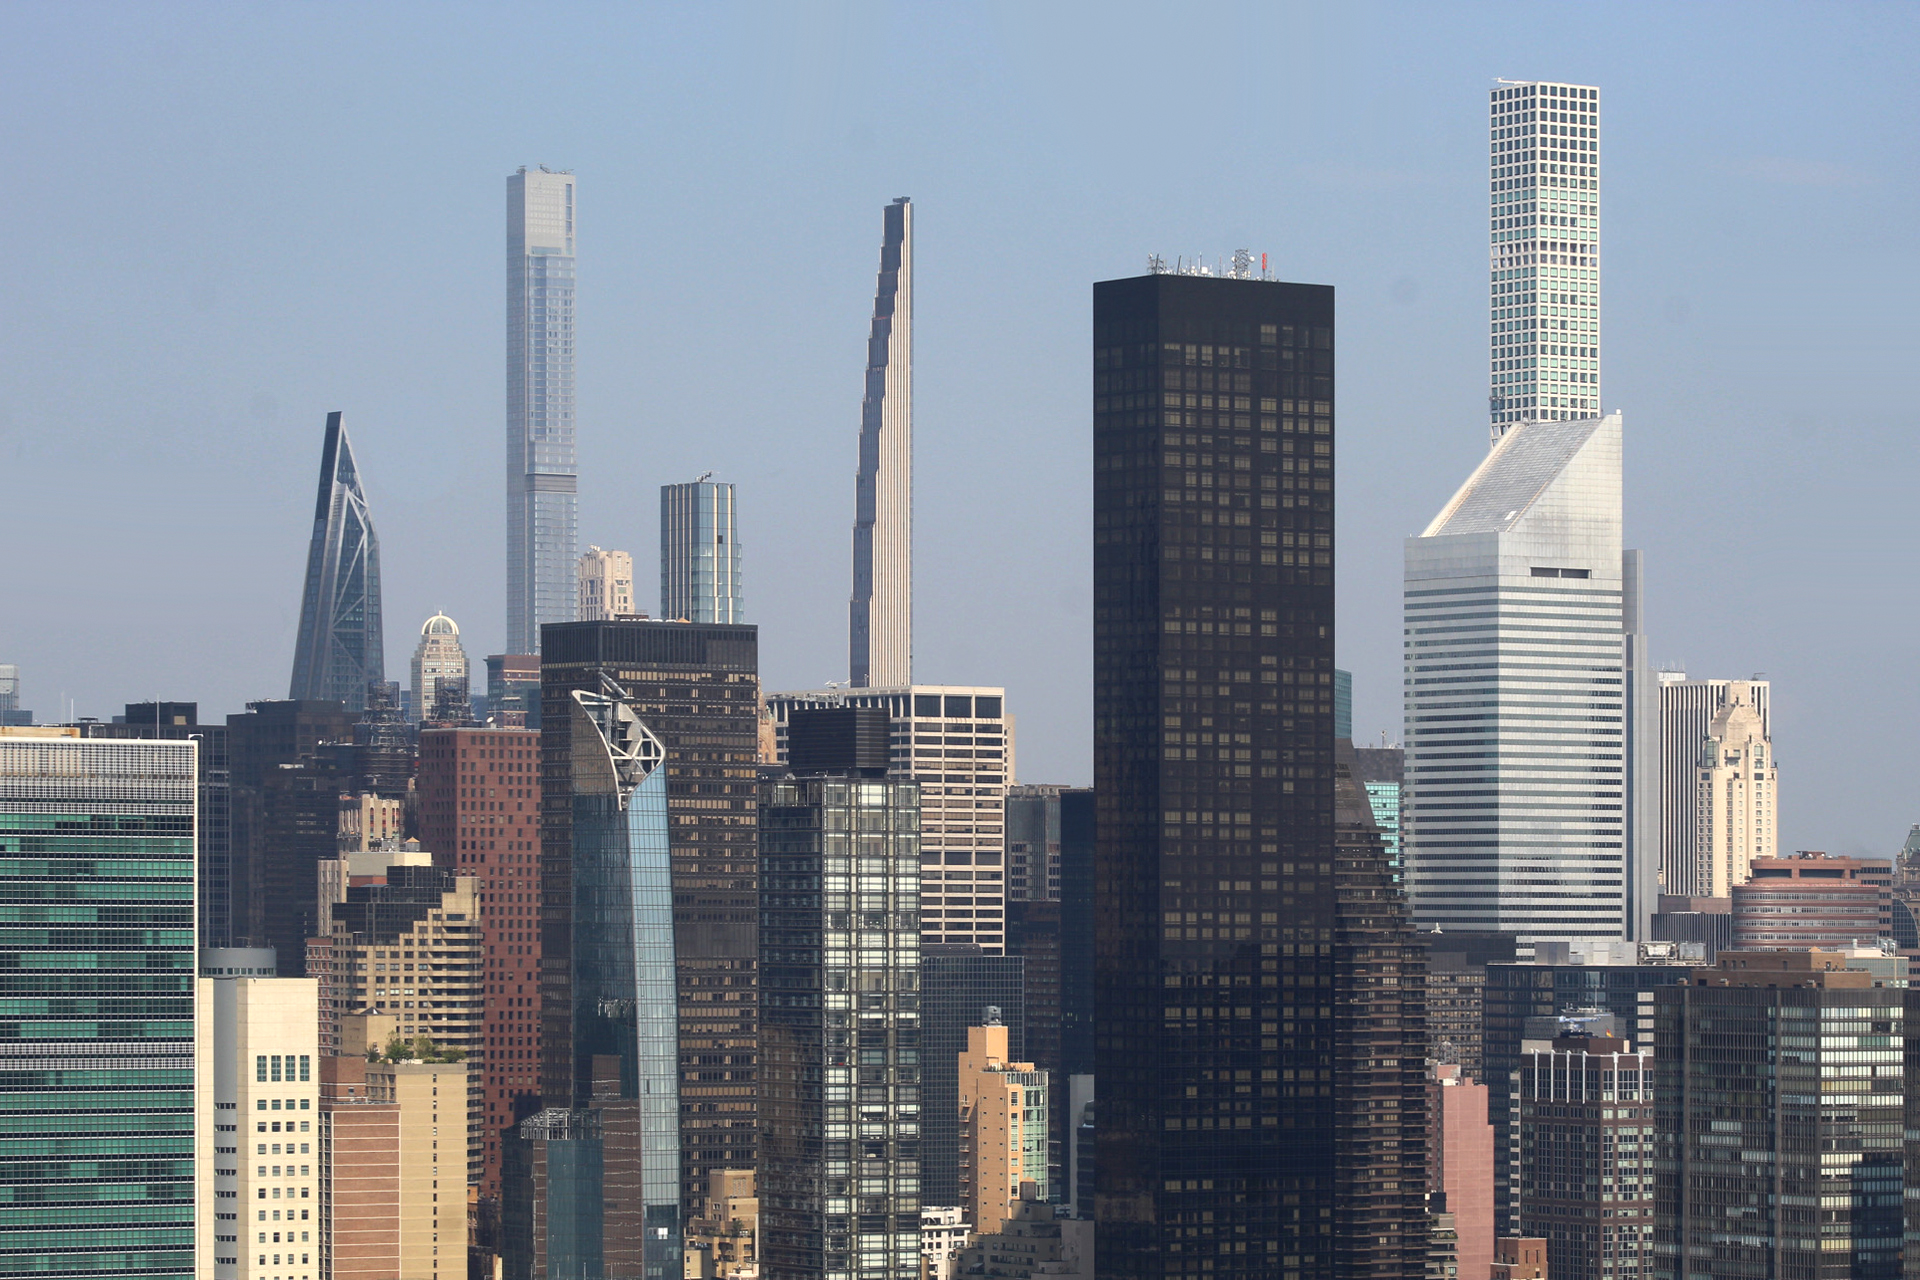
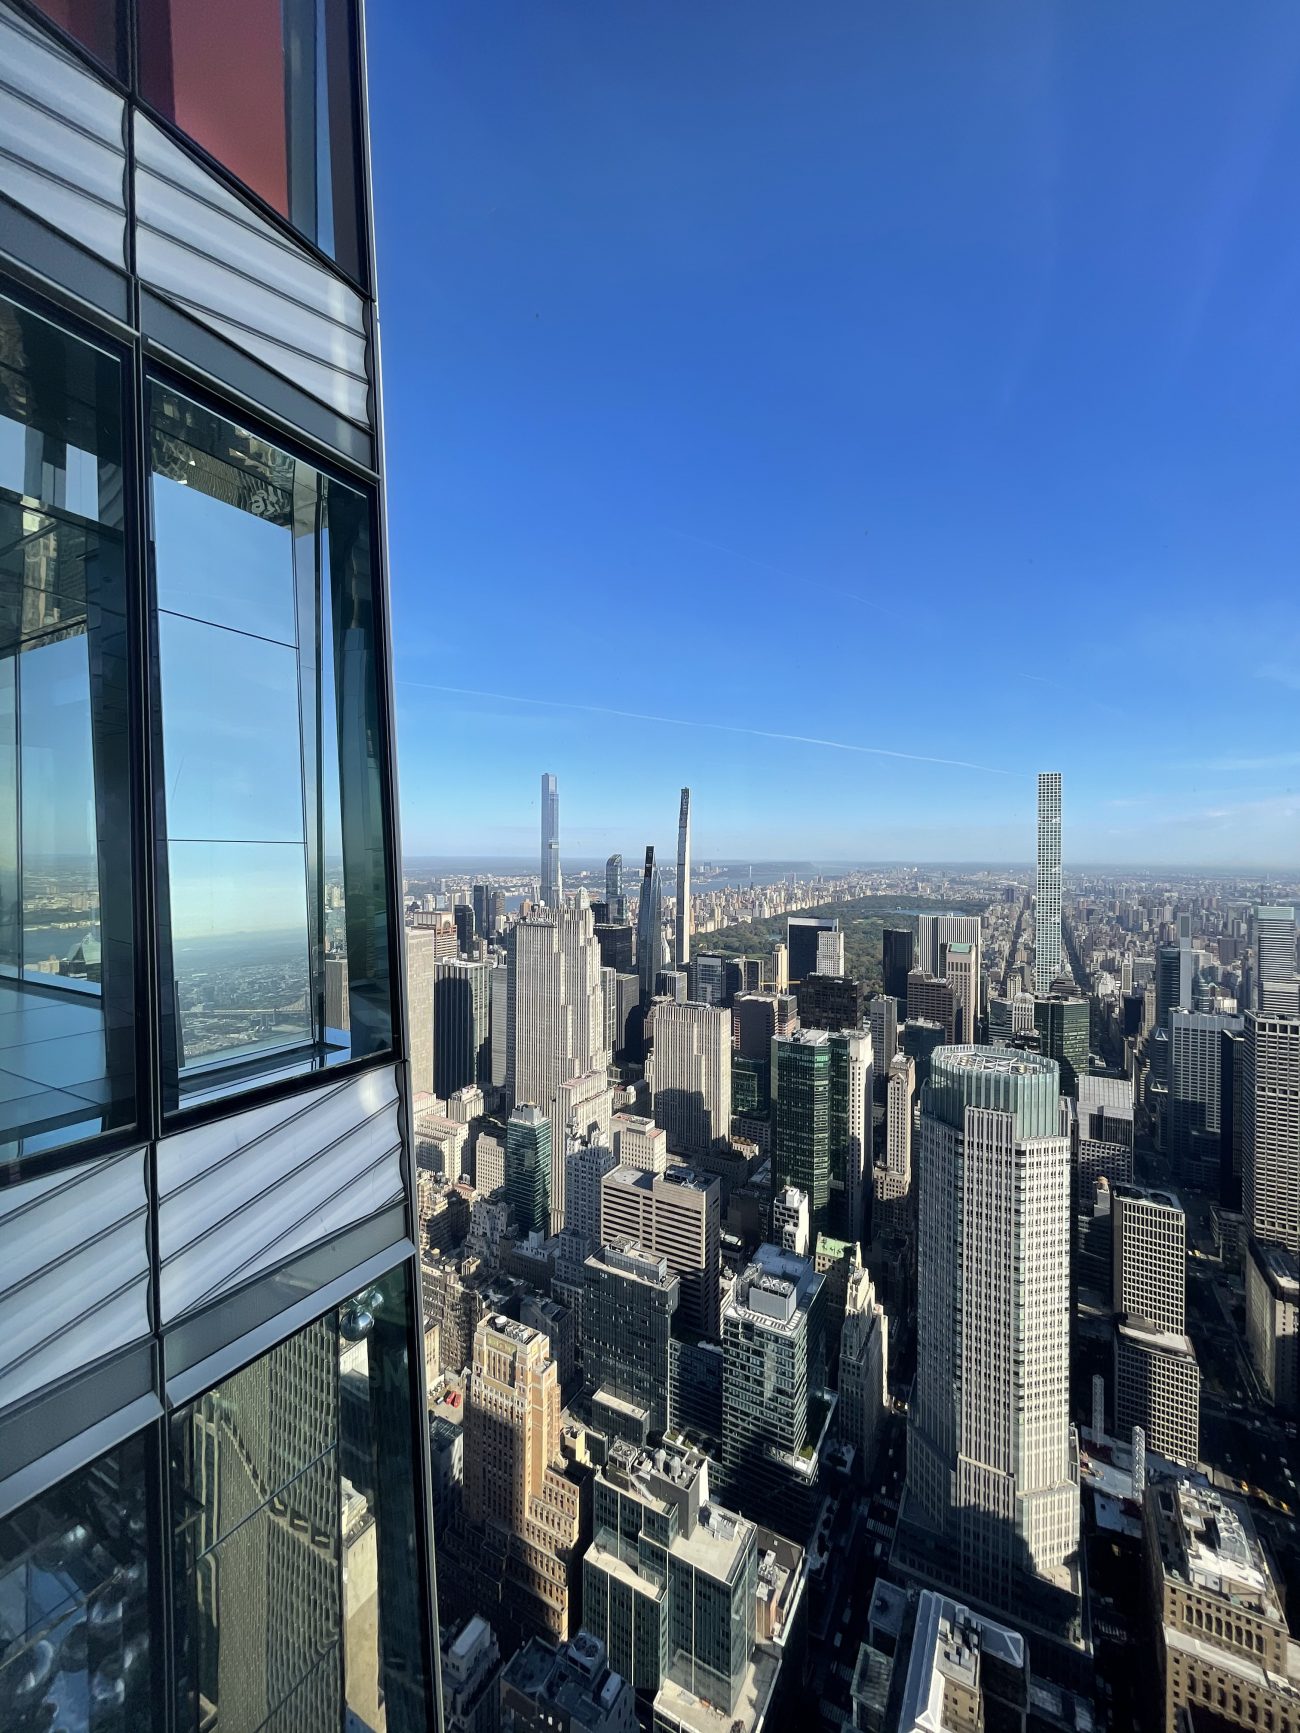
Billionaires’ Row. Photo by Michael Young
175 Park Avenue, aka Project Commodore. Rendering by Skidmore Owings & Merrill
Despite the progress, much work remains to be done to make our city a more convenient, affordable, and comfortable place to live. A major issue is a severe disbalance of supply and demand among the city’s housing stock, where draconian zoning limitations and height caps all across the city restrict builders from constructing the number of apartments needed. By easing these restrictions, the city would be able to absorb incoming residents without substantially increasing, or perhaps while even decreasing, the current cost of living, especially near infrastructure- and transit-rich areas that are easily capable of absorbing the added density.
YIMBY urges our Yes-In-My-Back-Yard-minded readers to contact local representatives to encourage upzoning of neighborhoods, removing restrictive height caps, and increasing developer incentives for contributing to vital infrastructure such as schools, hospitals, mass transit, parks, and more.
Subscribe to YIMBY’s daily e-mail
![]()
Follow YIMBYgram for real-time photo updates
Like YIMBY on Facebook
Follow YIMBY’s Twitter for the latest in YIMBYnews
Project Commodore, the most exciting new progress, thanks for details to cover your report: Thank you.
Excellent article.
It would be interesting to know how many housing units are “affordable.”
Also how many are unsold. There are numerous empty units across office and residential buildings especially in Manhattan and Queens. Brooklyn is performing well based on the data.
This is amazing news since it brings residential development back to pre-pandemic levels.
*Sheds a single tear*
That’s my city!!
Seriously excellent news. Not even COVID can stop NYC.
Let’s hope Eric Adams ushers in another decade of growth!!!
Some people don’t think I’m homeless and have kids, that we are all disabled. I am and we are…
I need apartment for rent. Today its my real birthday.
It’s great to see that the City continues to thrive in development. Great article.
Well done, Vitali. It’s good to see someone who knows what he’s talking about writing these reports for once.