

The second quarter of the year has come to a close, and as New Yorkers enjoy some of the year’s warmest weather and longest days, YIMBY has compiled our latest comprehensive quarterly overview of new project filings with the Department of Buildings from April through June. Given the acute housing crisis that continues to grip the city, we are happy to report that the Q2 total of 16,202 residential and hotel unit filings represents a dramatic 77-percent surge over the previous quarter’s total of 9,138. Equally promising is the near-doubling of the total filed-for square footage, which rose from 13.4 million square feet in Q1 to 23.2 MSF in Q2. In all, developers submitted filings for 956 new buildings during the three-month period, a notable increase from the previous quarterly total of 840. Below we look at the findings via a series of charts and analyses. The full list of quarterly filings, with detailed information on every project, is available with a subscription to YIMBY’s Building Wire.
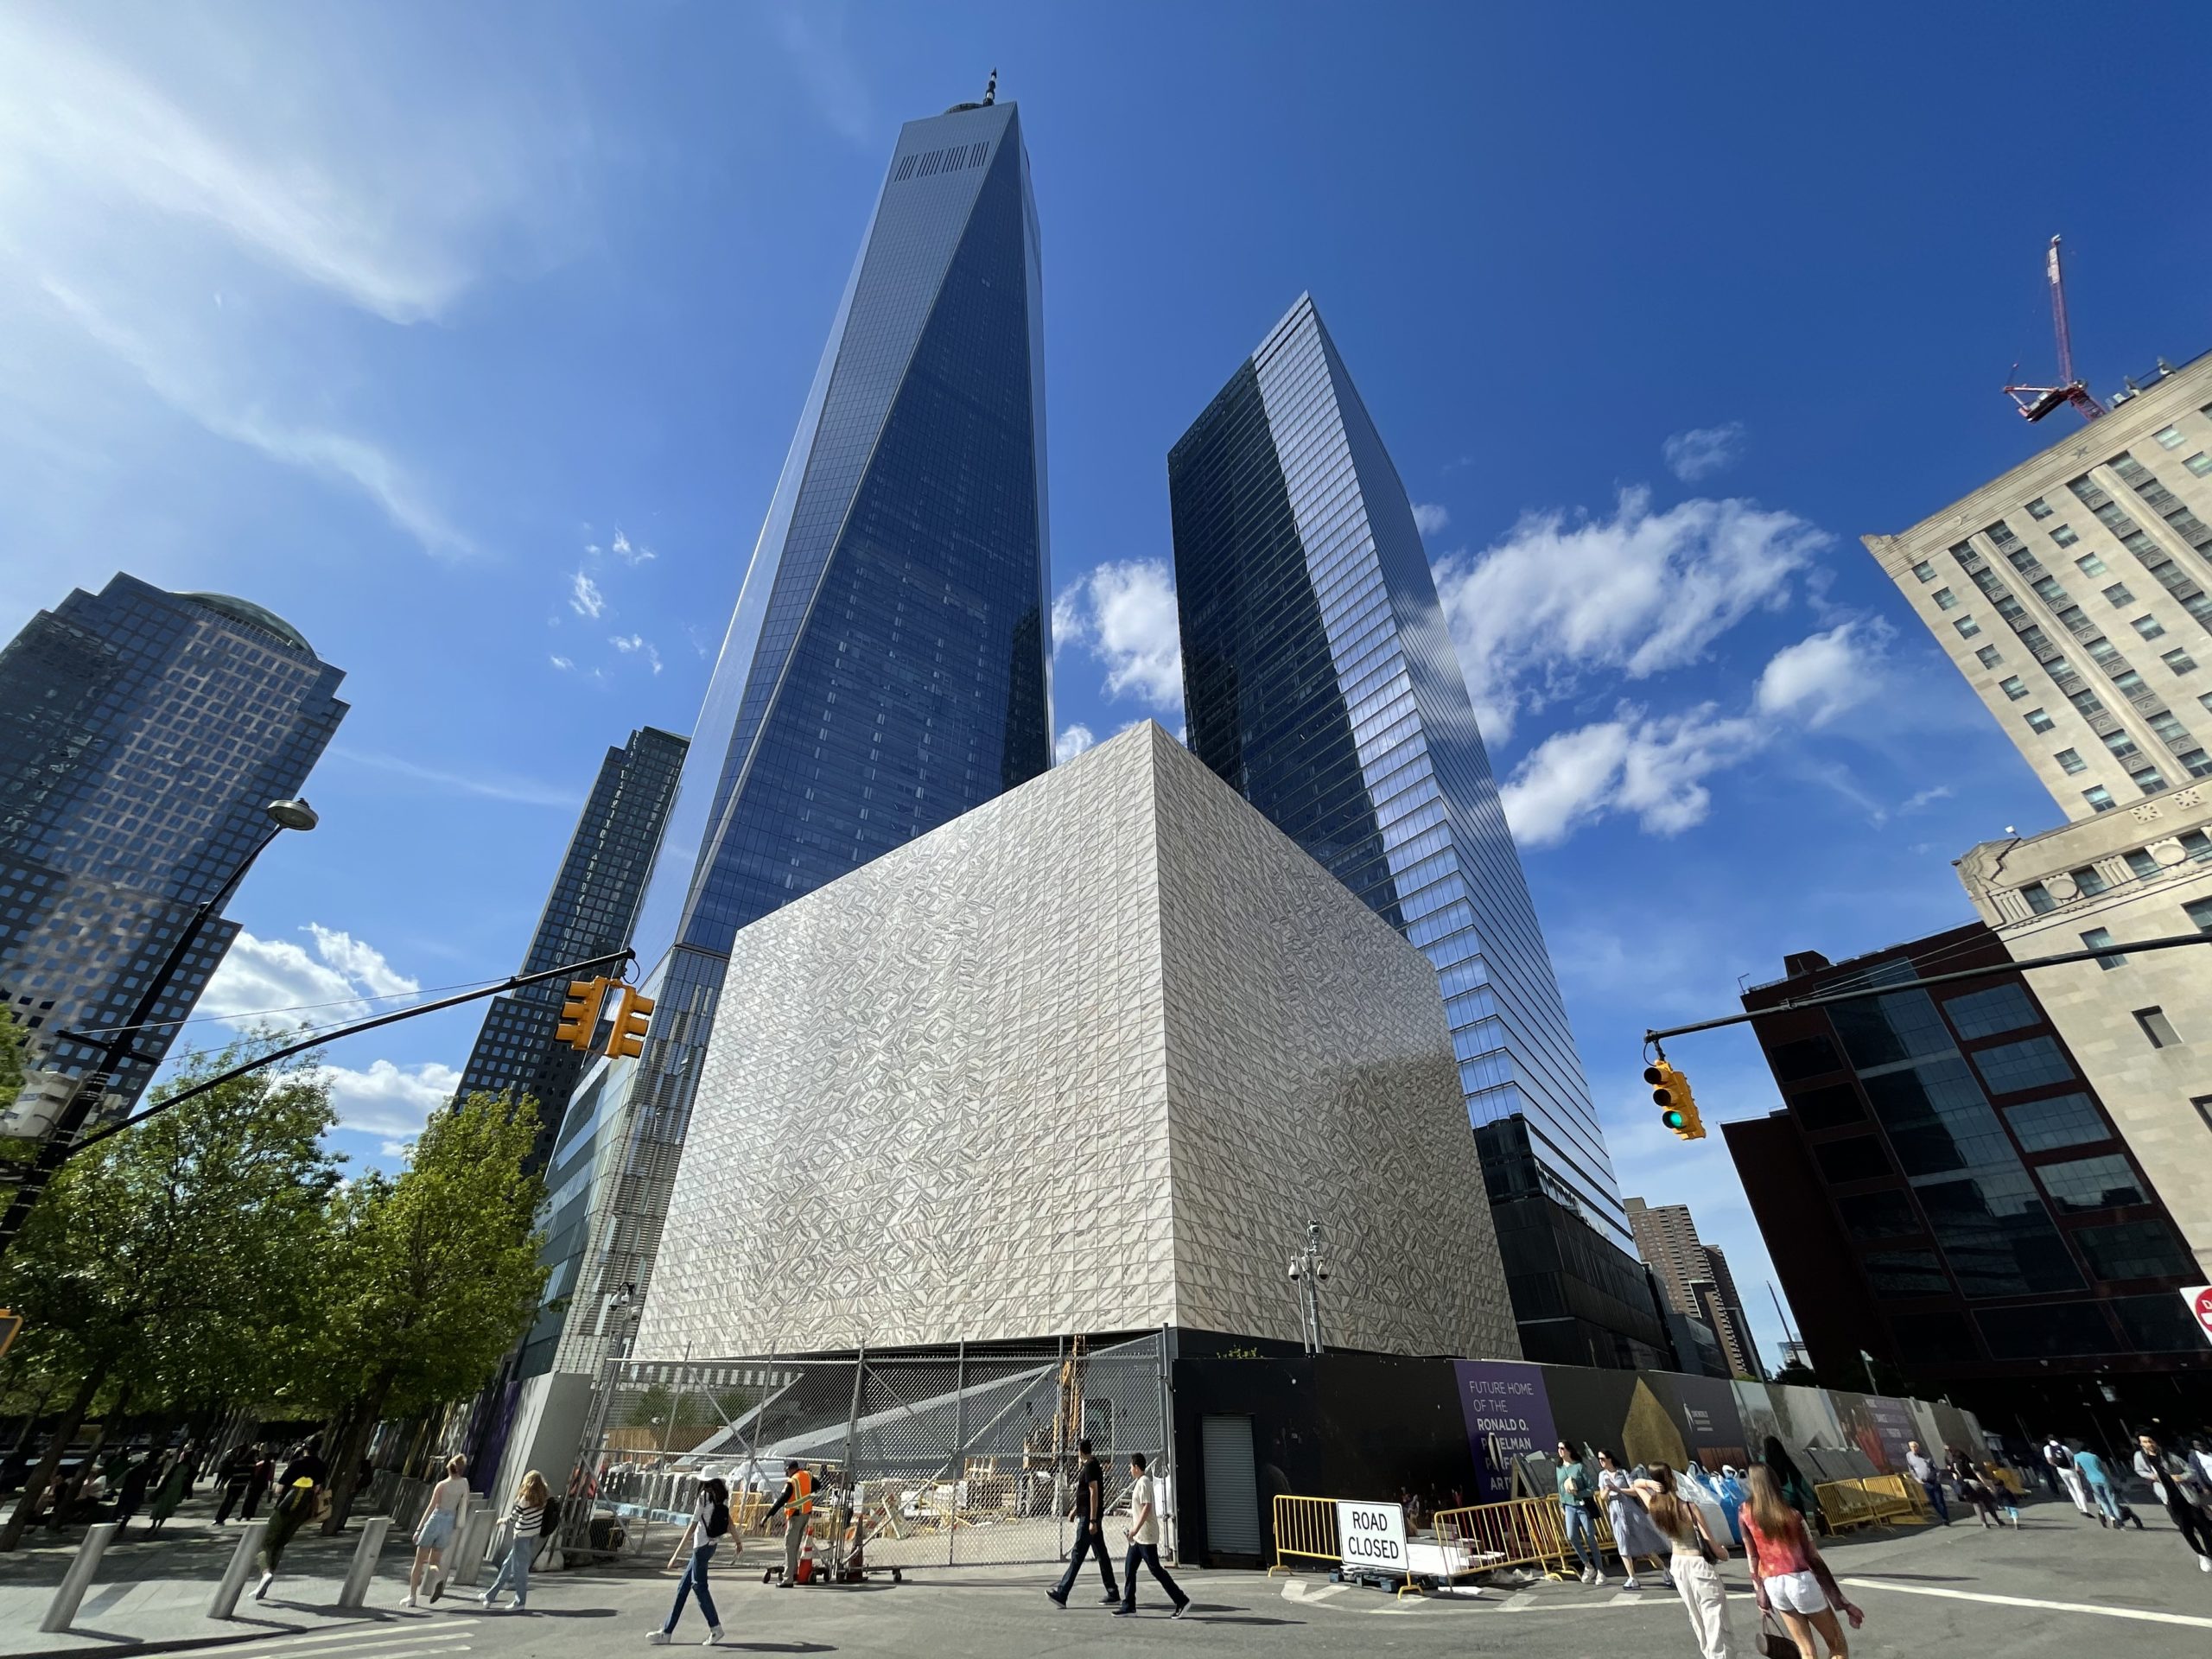
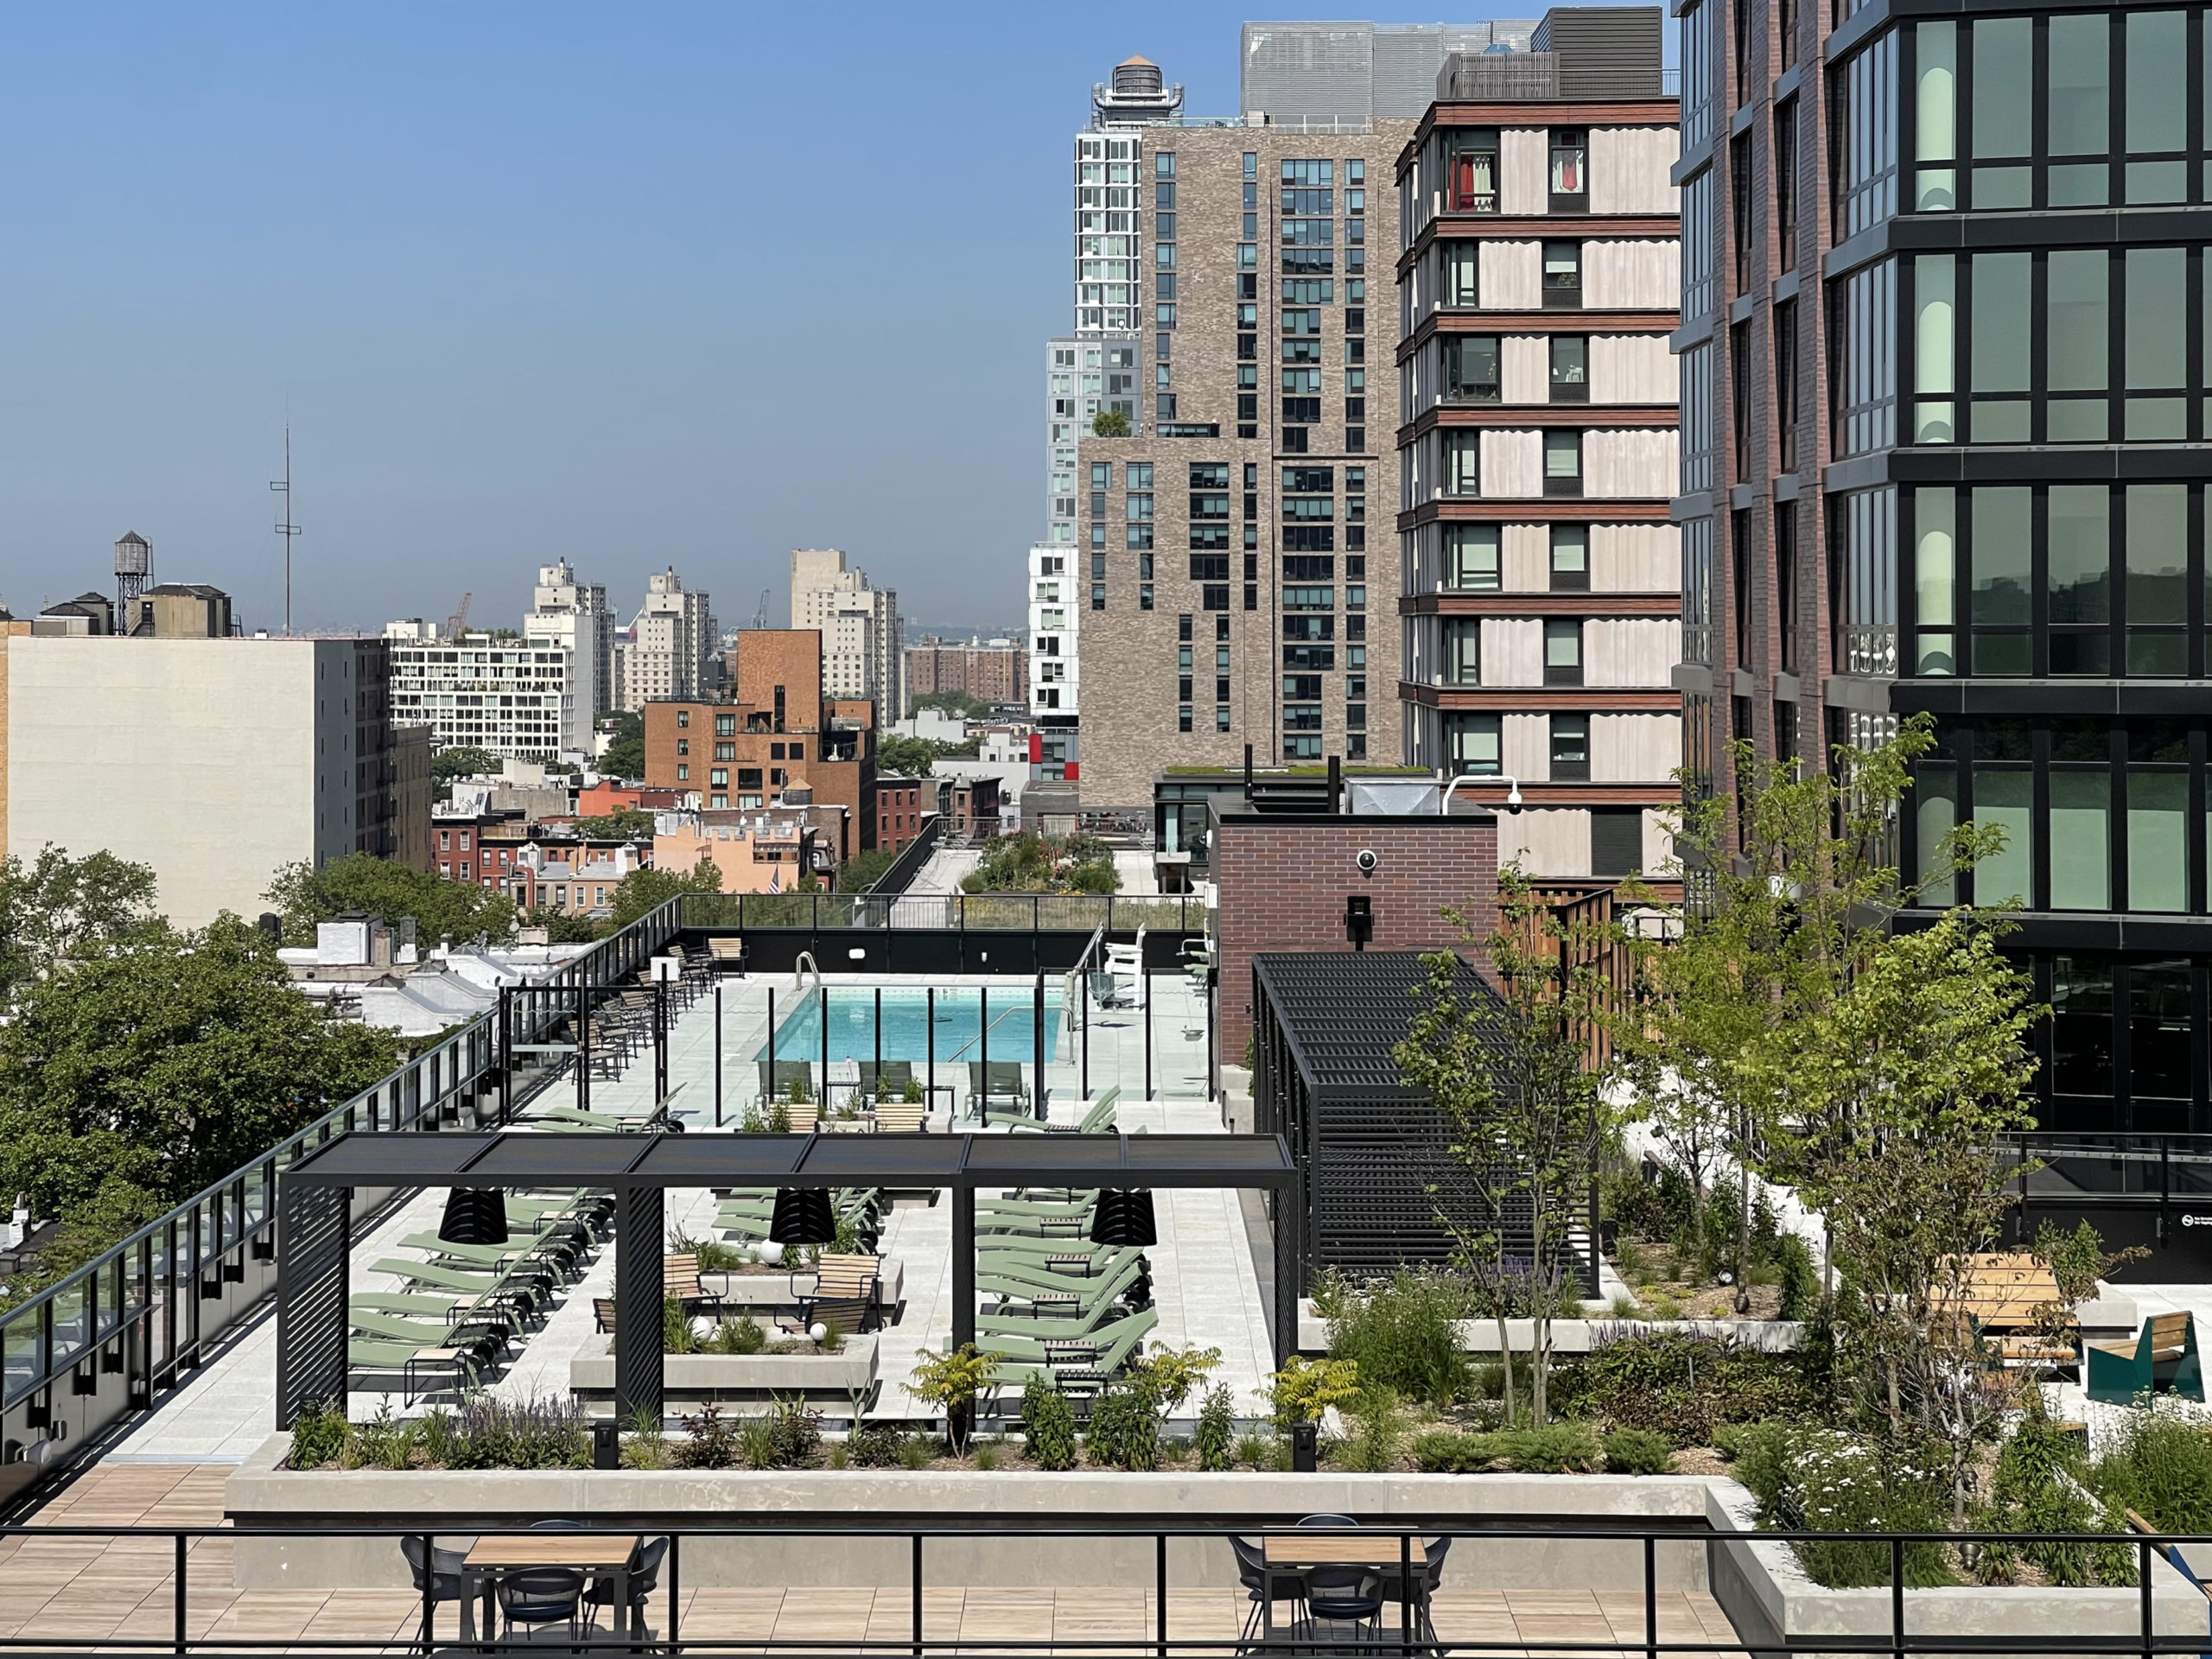
Photo by Michael Young
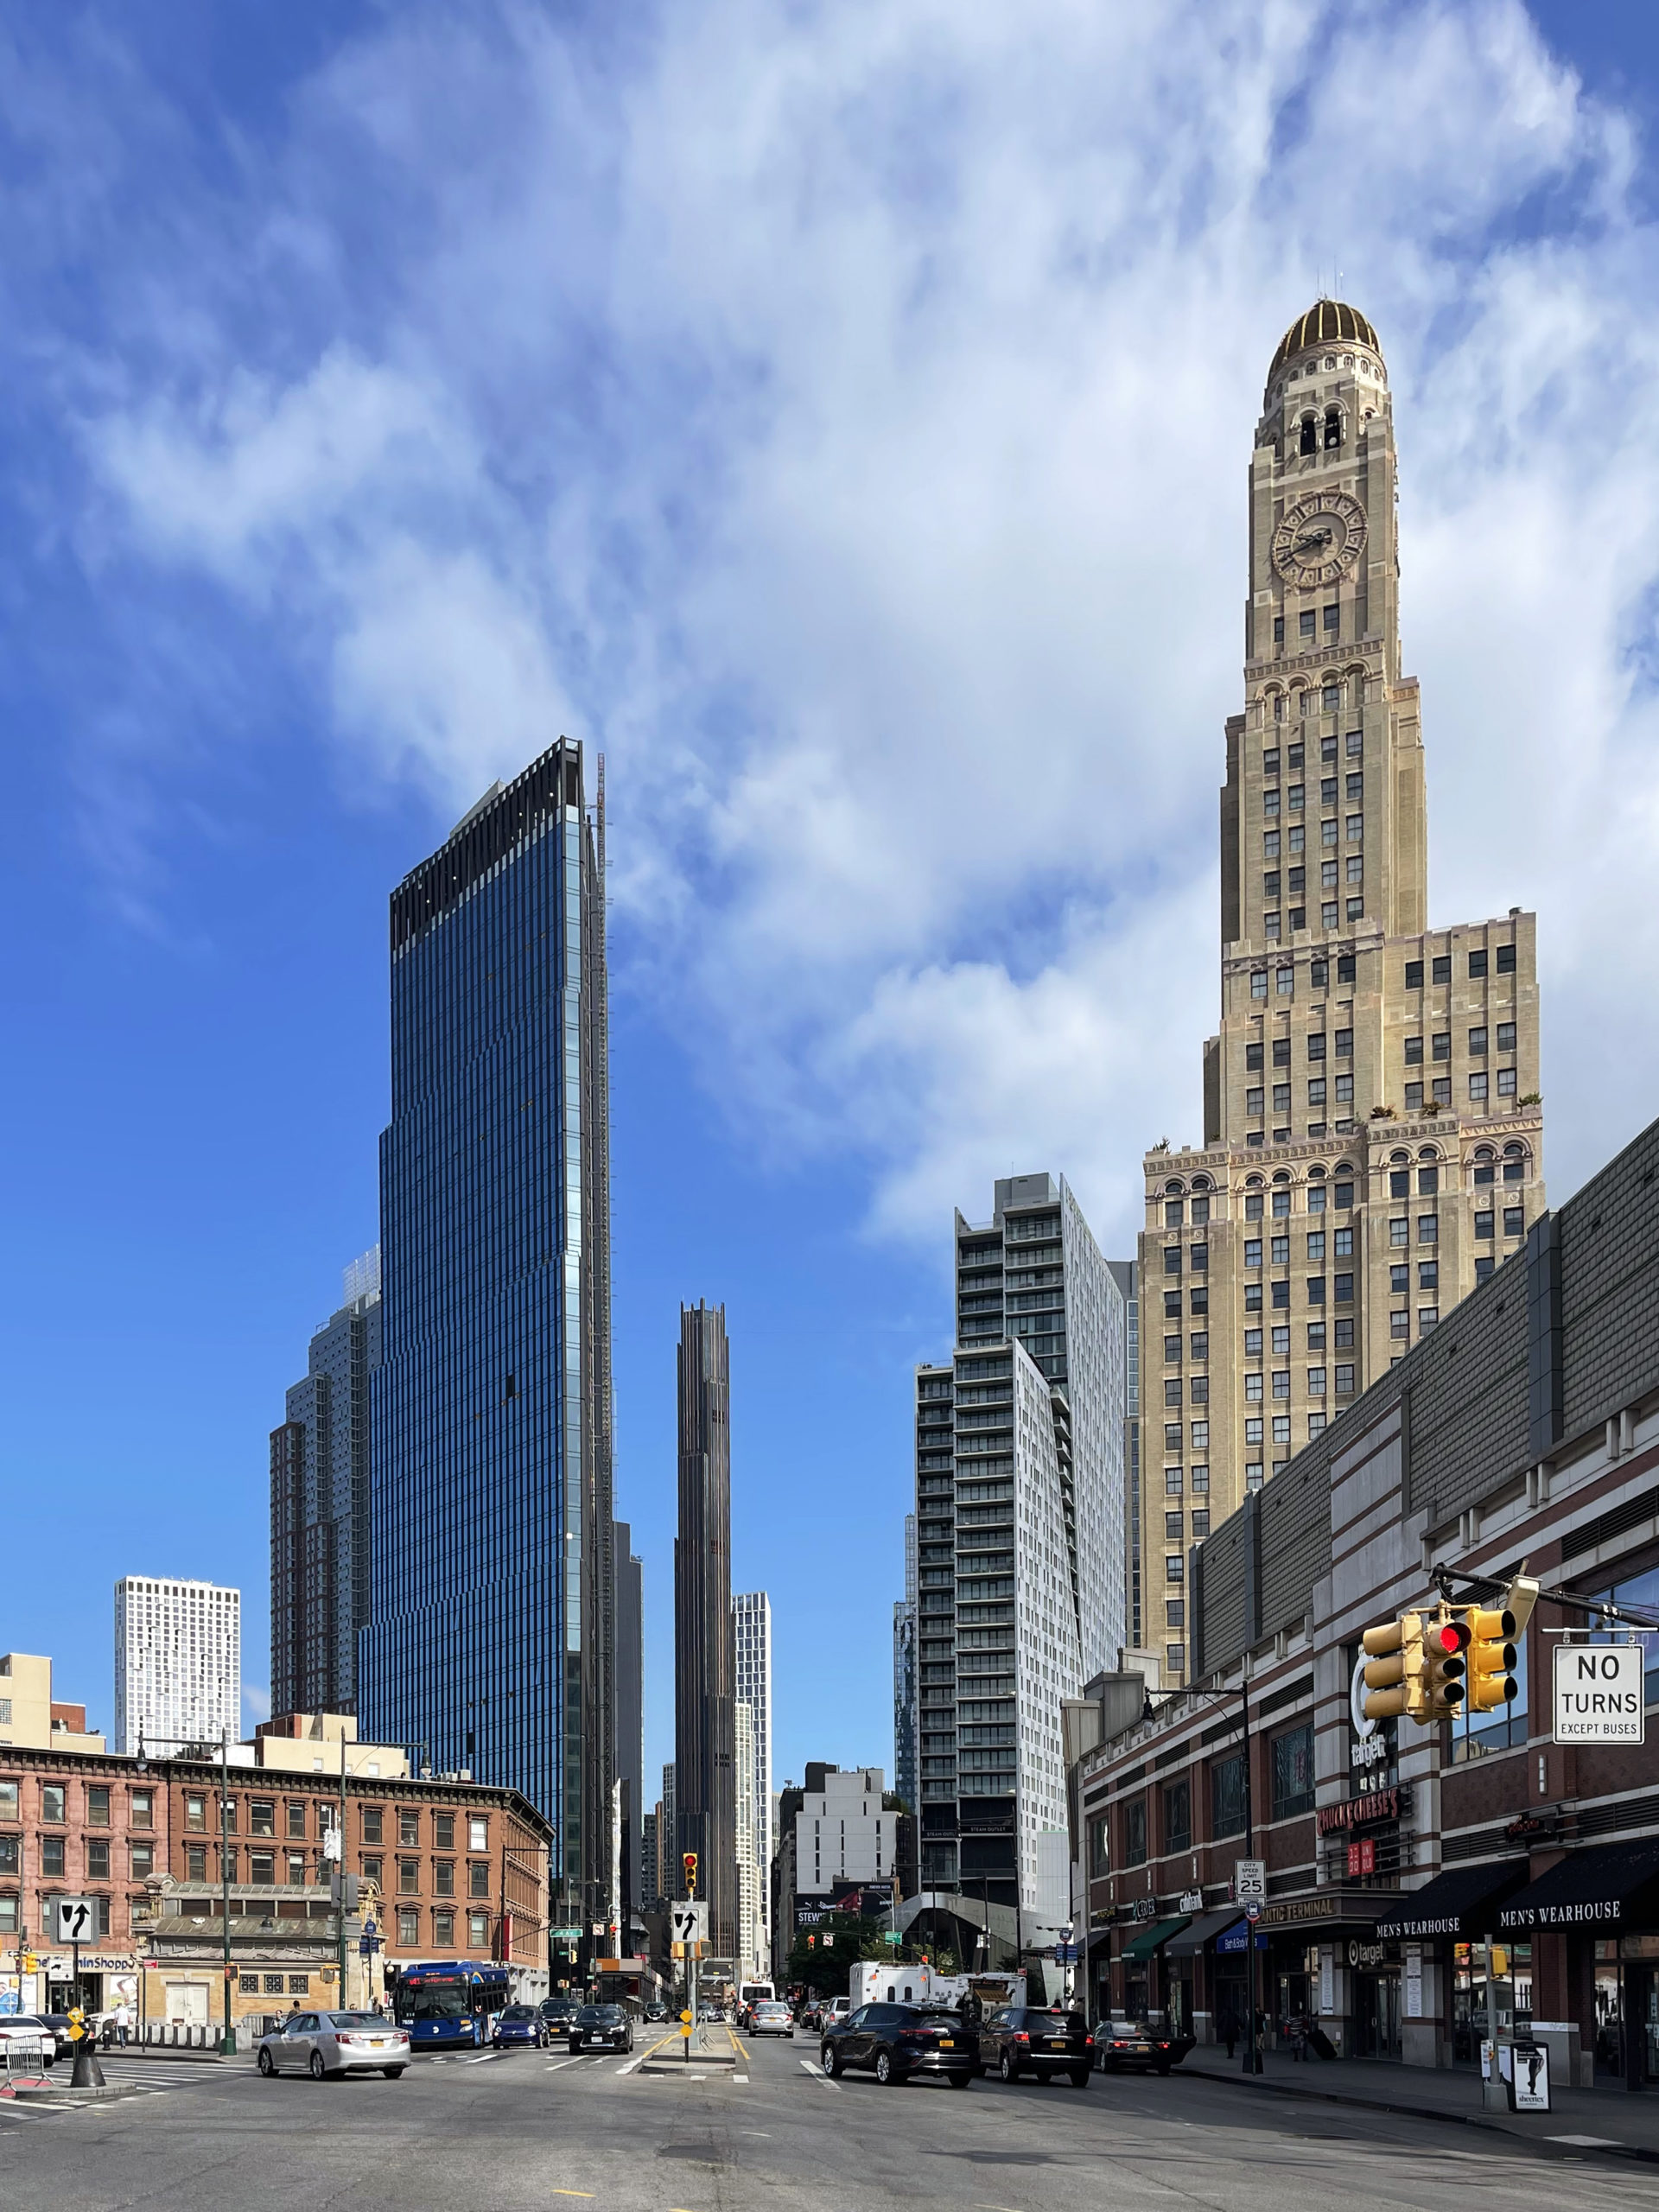
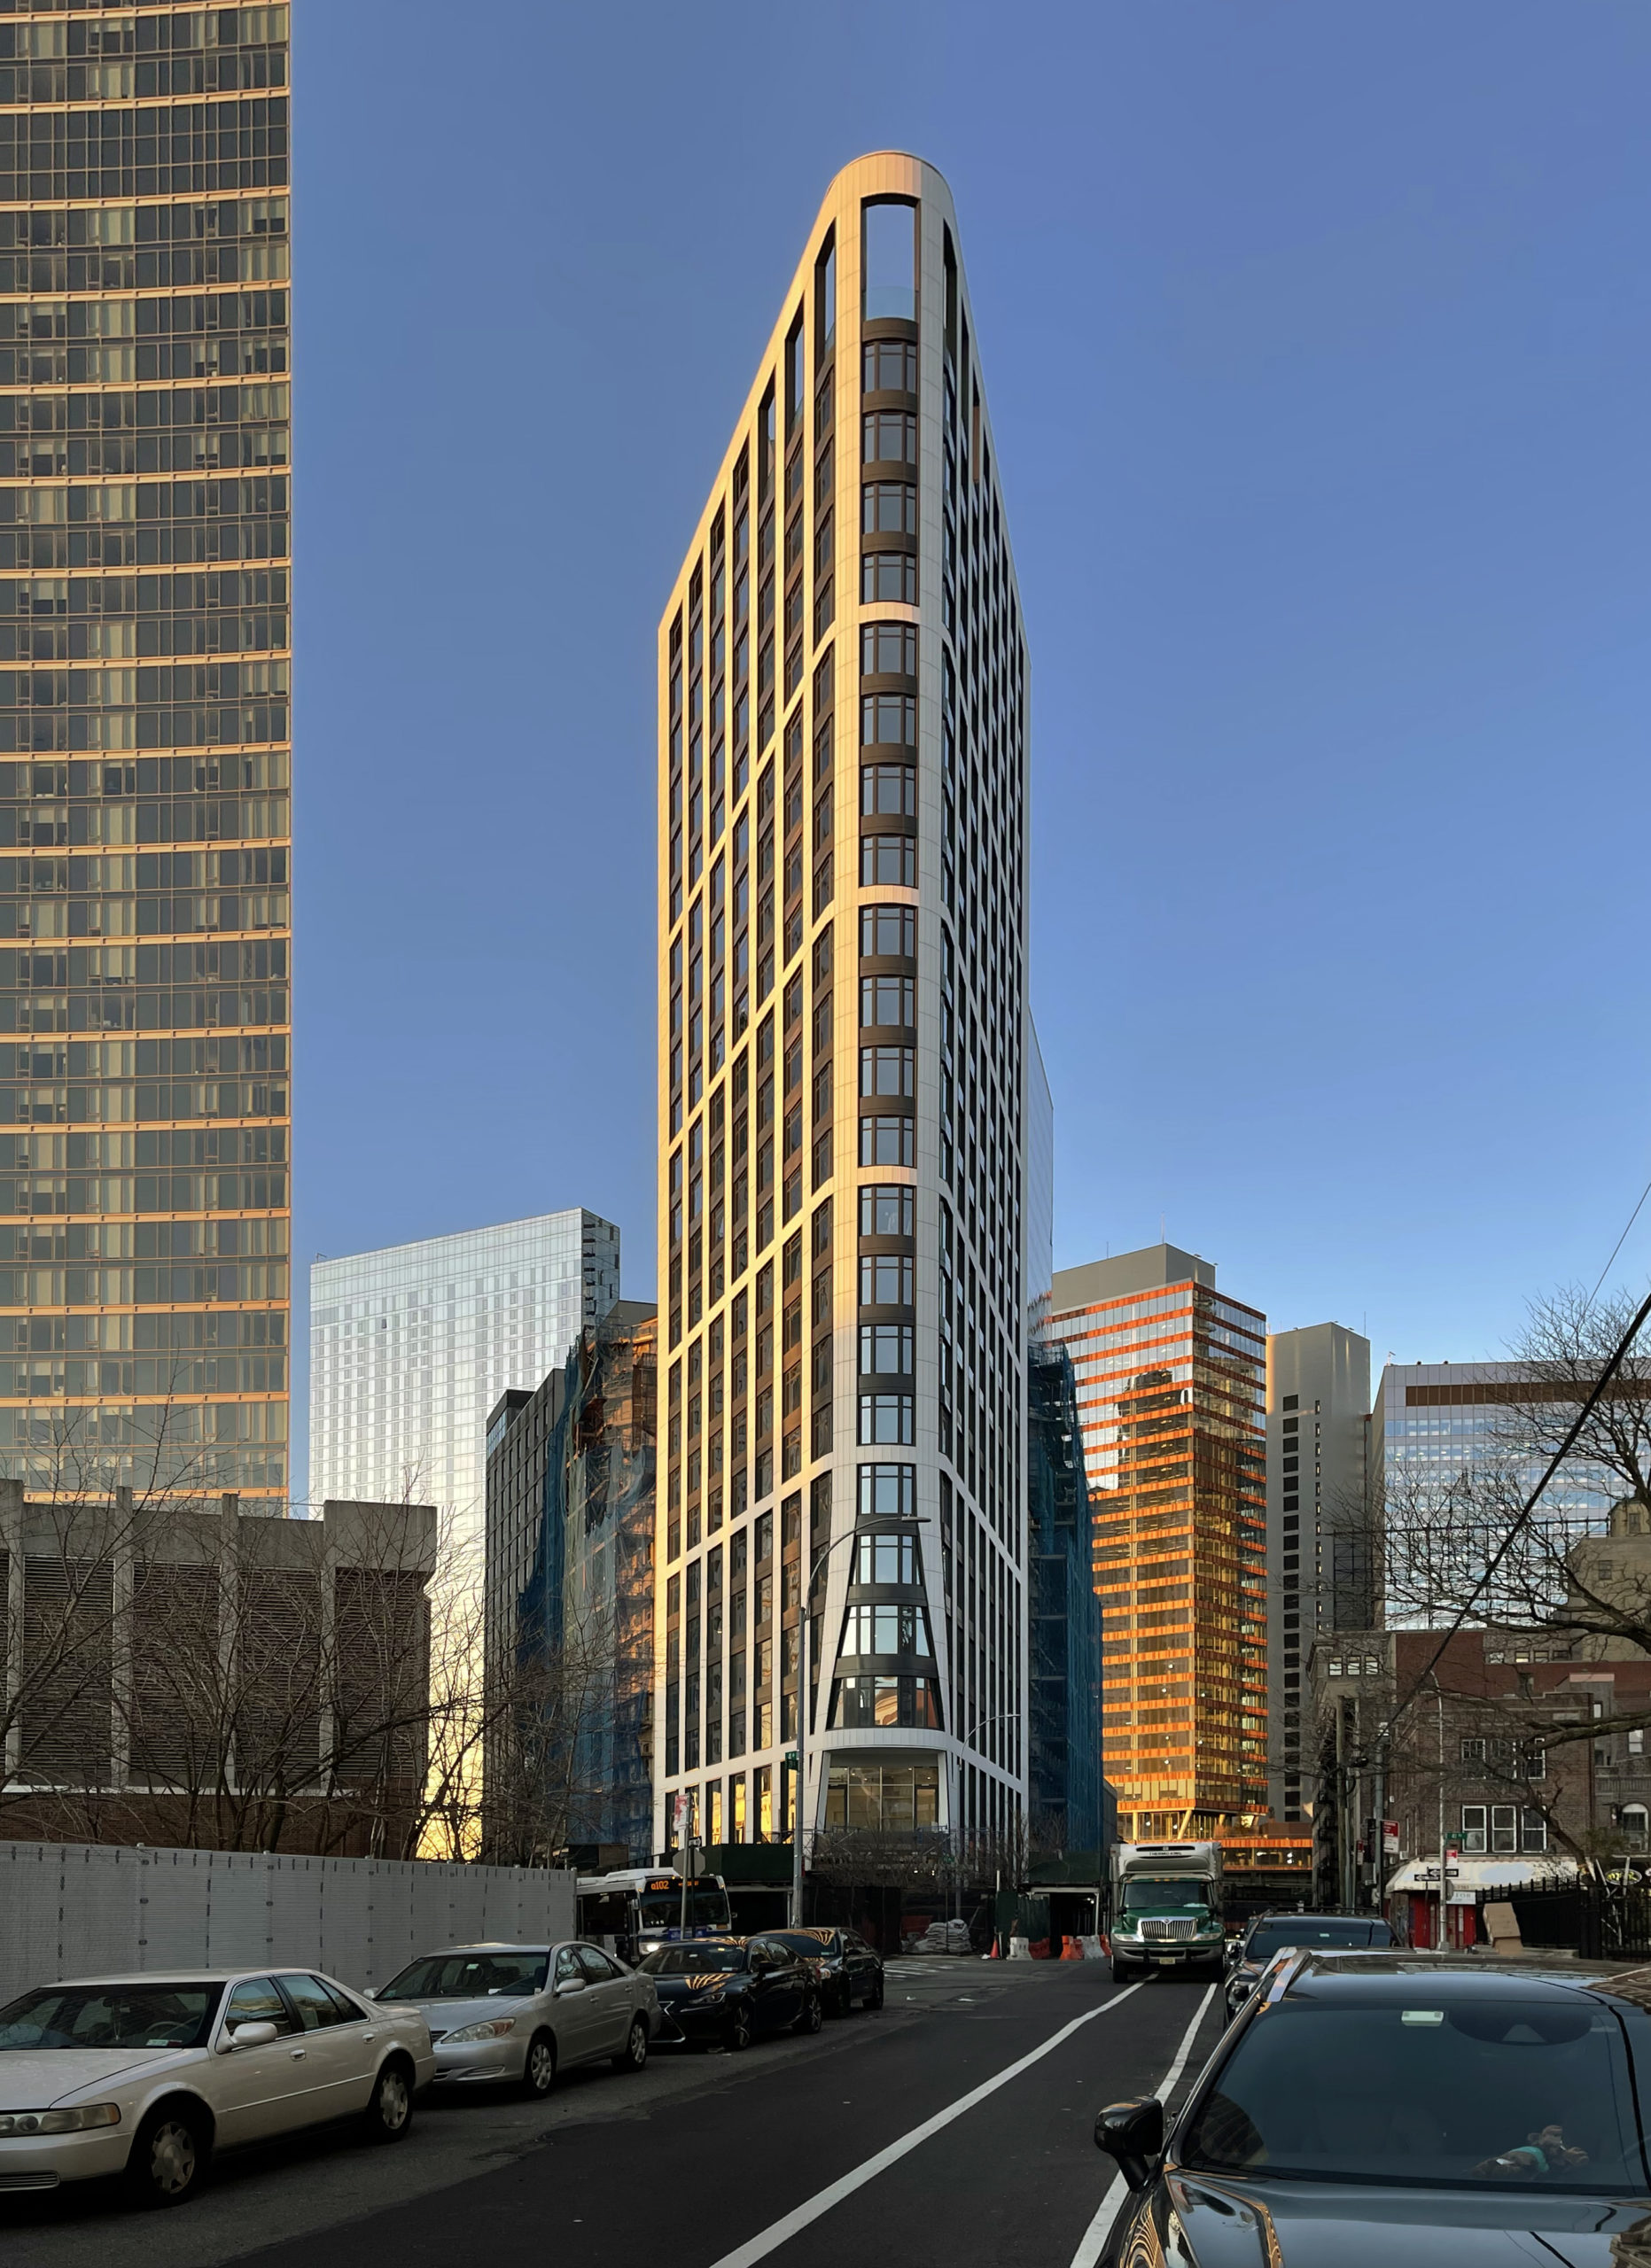
Photo by Michael Young
Number of permit filings per month
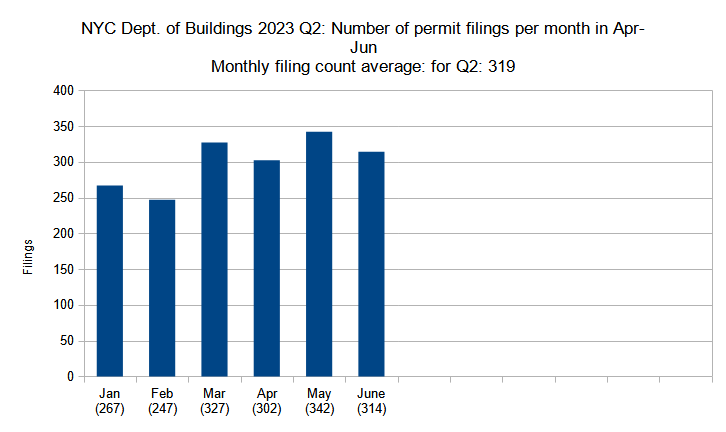
Number of new construction permits filed per month in New York City in Q1 and Q2 (January through June) 2023. Data source: the Department of Buildings. Data aggregation and graphics credit: Vitali Ogorodnikov
After an expected pandemic-driven filing slowdown in 2020, the number of average filings has generally increased every month, although a minor slump took place at the end of last year. The filing numbers, however, began to pick up again in the first quarter of this year. The second quarter not only displays a continuation of the upward trend, but shows the highest figures we’ve seen in years.
The second quarter of 2023 registered 319 permit filings per average month, beating every single quarter since at least the start of 2020. With 302 filings in April, 342 in May, and 314 in June, each month in Q2 2023 exceeds all but two months from the entire previous year. In fact, May had the highest number of monthly permit filings of any of the 42 months that have elapsed since YIMBY started keeping track of the statistic in 2020.

Photo by Michael Young
Number of permit filings by borough
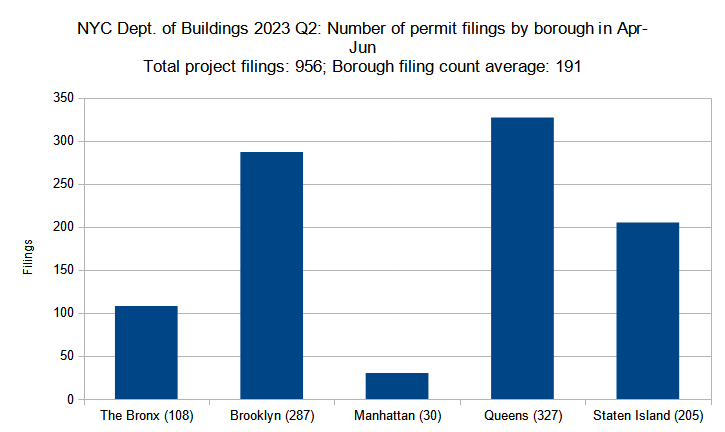
Number of new construction permits filed per borough in New York City in Q2 (April through June) 2023. Data source: the Department of Buildings. Data aggregation and graphics credit: Vitali Ogorodnikov
The borough-based distribution of total permit filing volume remained virtually unchanged from the previous quarters. Queens, New York City’s largest borough, leads in the total number of filings, closely followed by Brooklyn. Staten Island, replete with predominantly small-scale filings such as single-family homes and garages, again registers at third place, with the Bronx following behind. Manhattan, traditionally defined by fewer yet larger-scale filings, came in last place.
While the general trend has remained unchanged, each borough grew by double digits in terms of total filings. Between Q1 and Q2, Queens rose from 284 to 327 filings (15 percent growth), Brooklyn from 251 to 287 filings (14 percent), and Staten Island from 194 to 205 (6 percent), and The Bronx from 94 to 108 (15 percent). Manhattan displayed the greatest relative growth, increasing from 17 filings in Q1 to 30 in Q2 (76 percent growth).
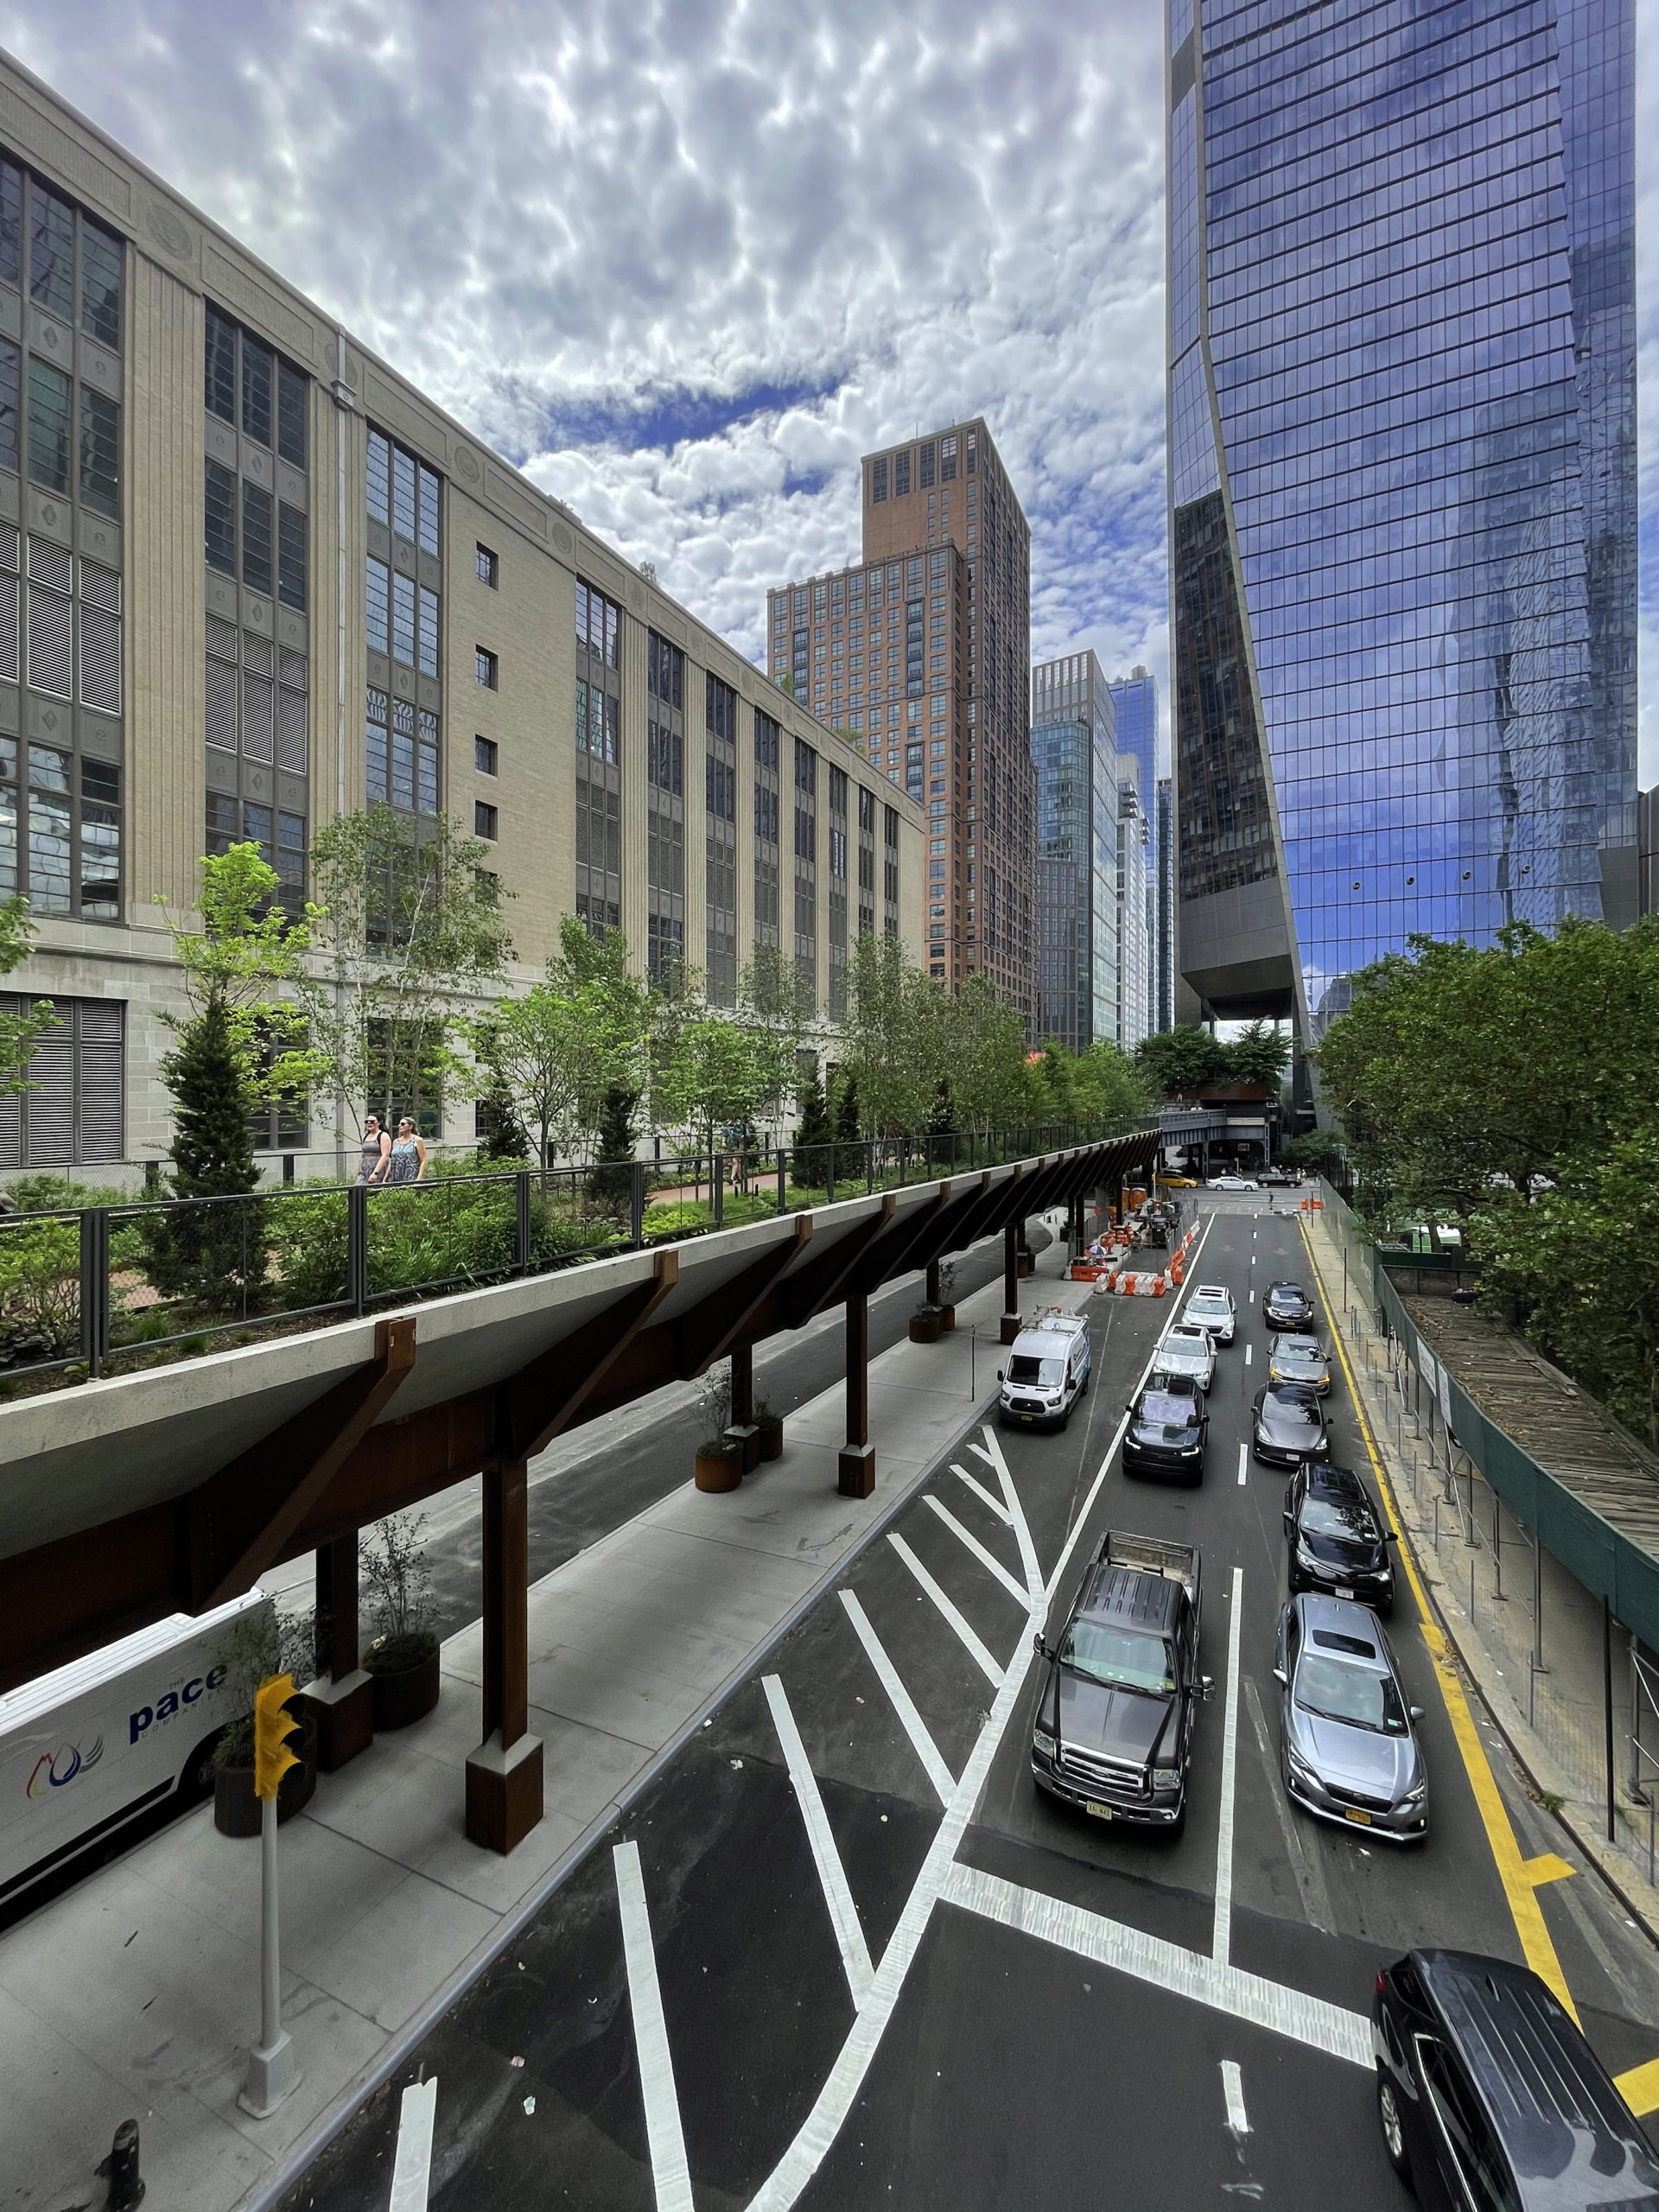
Photo by Michael Young
Permits listed by unit count per filing
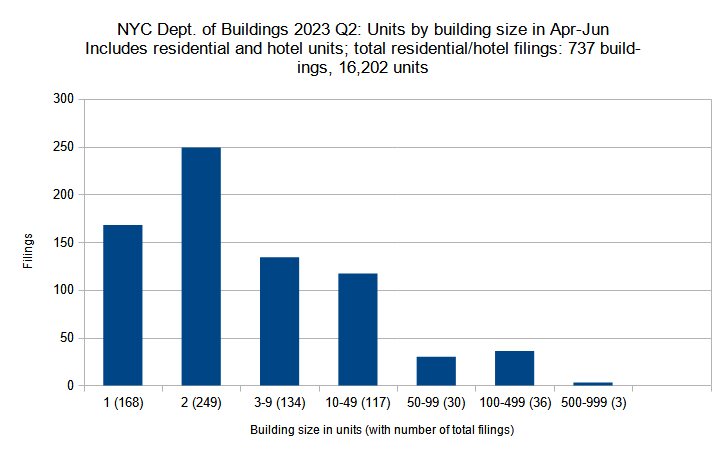
New residential and hotel construction permits filed in New York City in Q2 (April through June) 2023 grouped by unit count per filling. Data source: the Department of Buildings. Data aggregation and graphics credit: Vitali Ogorodnikov
The total number of filed-for units grew by 77 percent, rising from 9,138 in the first quarter to 16,202 in the second, yet the total number of filings has increased more modestly, with a 14-percent uptick from 840 in Q1 to 956 in Q2. Since the majority of the filings are for residential projects, the data infers that apartment project filings have generally increased in average size and unit count.
The second-quarter data confirms our supposition. Between the two quarters, the four categories of filings for projects under 50 residential or hotel units (which make up the majority of all filings) have remained largely consistent. Single-family filings dipped from 171 in Q1 to 168 in Q2. Two-family filings, still the largest category, rose from 231 in Q1 to 249 in Q2. Filings for small apartment buildings (three to nine units) notched up from 121 to 134. Filings for medium-sized developments (ten to 49 units) also rose slightly, from 106 to 117.
By contrast, the largest apartment building and hotel categories have displayed the most dramatic increases, which is a positive development for a city that draws its vitality and success from its urban density. Between the two quarters, the number of filings spanning 50 to 99 units rose by 50 percent, from a total of 20 in Q1 to 30 in Q2. The number of filings for projects with 100 to 499 units has more than doubled, rising from 17 in Q1 to 36 in Q2. The category that covers the largest proposals (500 units and above) has remained consistent between the two quarters, with three filings per quarter.

Photo by Michael Young
Residential and hotel units filed per borough
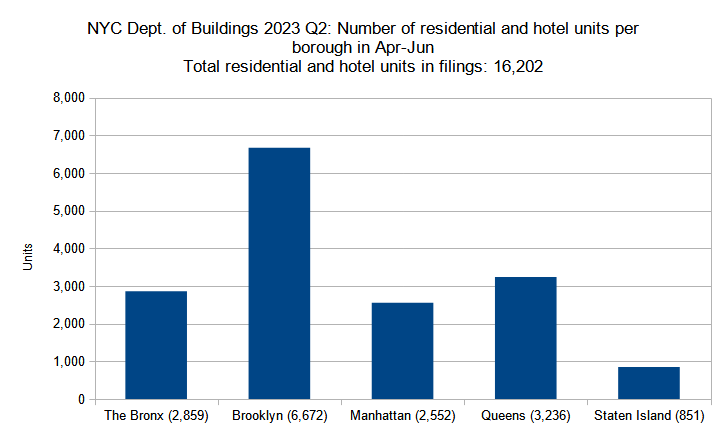
Number of residential and hotel units in new construction permits filed per borough in New York City in Q2 (April through June) 2023. Data source: the Department of Buildings. Data aggregation and graphics credit: Vitali Ogorodnikov
While the share of total permit filings by borough remained consistent, significant variation was noted in the number of filed-for residential and hotel units between the different boroughs.
Of all the boroughs, the tally for The Bronx remained the most consistent between the two quarters, and the borough remains in third place among its peers in terms of filed-for units. However, its rise from 2,483 filed-for residential and hotel units in Q1 to 2,859 units in Q2 still represents a significant growth of 15 percent. The borough’s largest filing is the 450-unit proposal at 120 East 144th Street in Mott Haven, which is the quarter’s seventh-largest filing by unit count.
By contrast, Brooklyn’s unit count more than doubled, surging from 3,118 in Q1 to 6,672 in Q2, propelling the borough to first place. Brooklyn’s largest filing, the 591-unit project at 589 Fulton Street in Downtown Brooklyn, boasts the highest unit count for the quarter.
In turn, Queens slipped to second place, not only because of Brooklyn’s meteoric rise, but also owing to a slight dip in its own unit count, lowering by 7 percent from 3,487 filed-for units in Q1 down to a still-significant total of 3,236 units in Q2. The borough’s highest unit-count filing for the quarter, a 561-unit proposal at 29-10 Northern Boulevard in Long Island City, ranks as the city’s second-largest filing for the period (the 521-unit project planned at 147-35 95th Avenue in Jamaica ranks third).
In the previous quarter, the total unit count in Queens eclipsed that of Manhattan almost seven times over; this time, however, Manhattan’s tally almost caught up to that of the World’s Borough as it displayed a staggering quintuple growth from 541 unit filings in Q1 to 2,552 in Q2. Manhattan still remains in fourth place among the boroughs, although just barely. The filing with the highest unit count is 1440 Amsterdam Avenue in Manhattanville, where a 490-unit affordable housing development is proposed.
As expected, low-density Staten Island still ranks last among the boroughs in terms of its filed-for unit count. However, the borough’s figures still show significant growth as the filed-four unit tally has nearly quadrupled from 233 in Q1 to 851 in Q2. The three largest filings, 8 Stuyvesant Place (279 units) and 178 Richmond Terrace (216 units) in St. George, as well as 191 Edgewater Street in Rosebank (90 units), account for more than two-thirds of the borough’s total filed-for units.
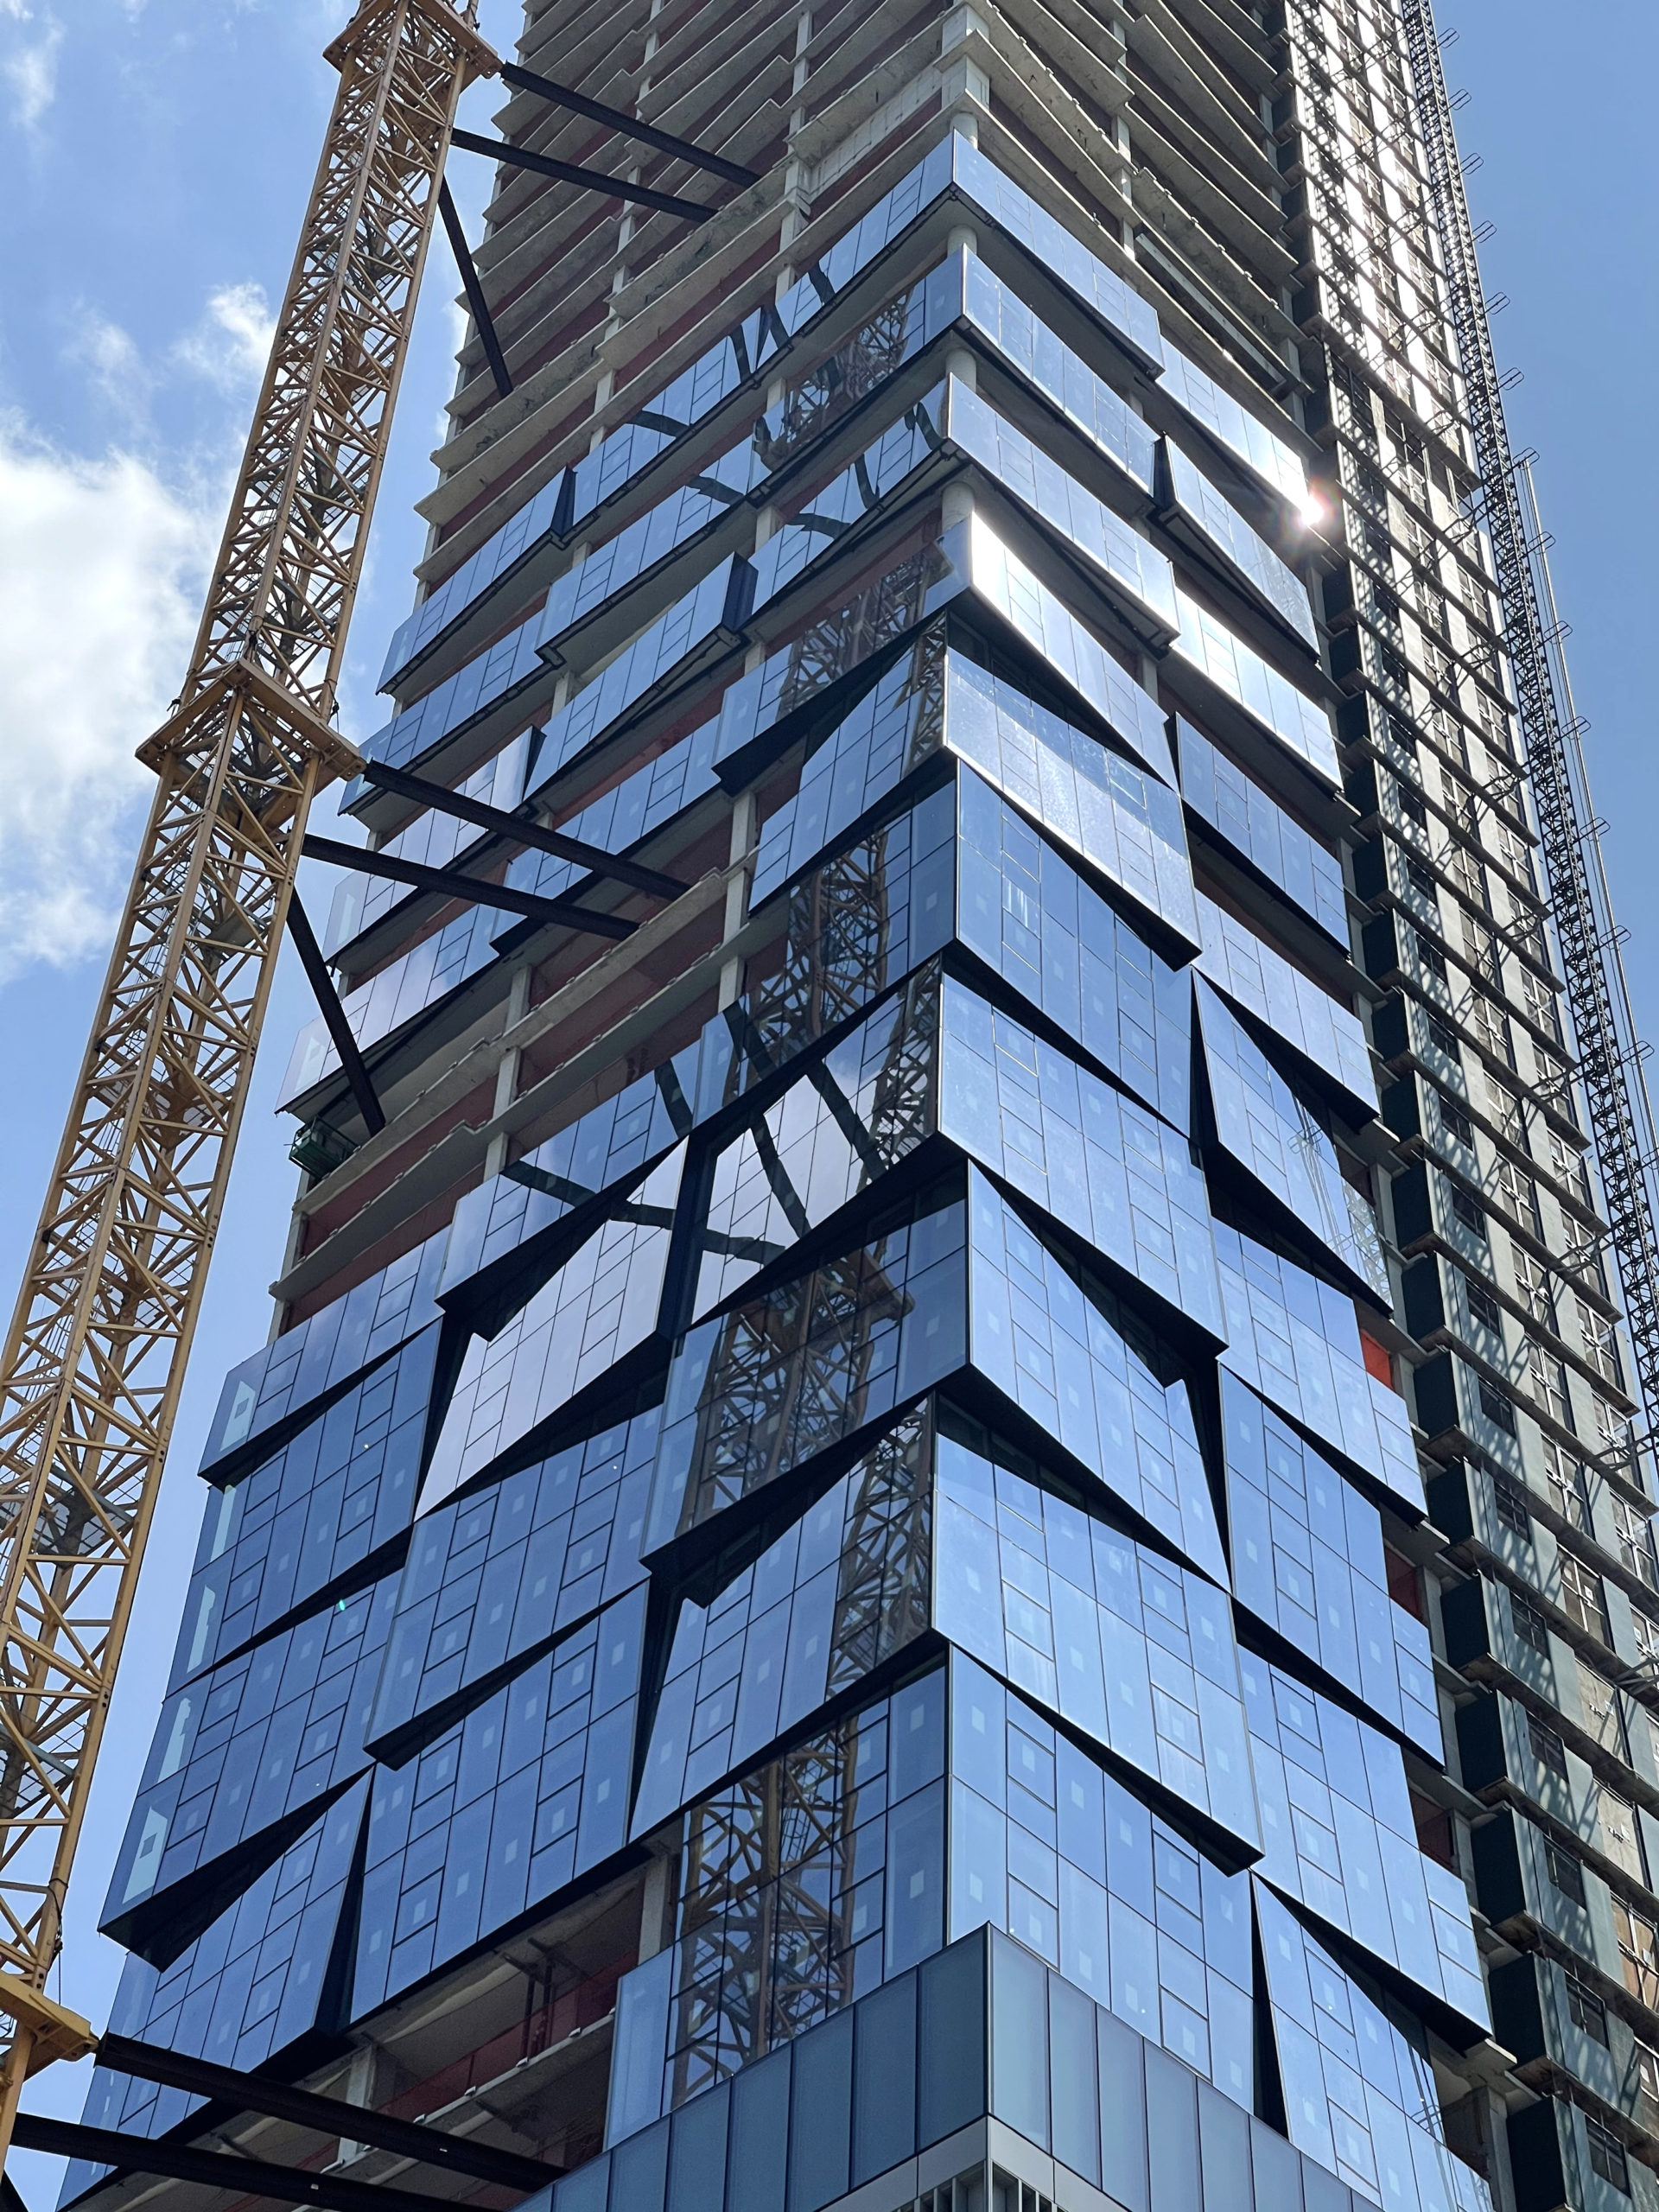
Photo by Michael Young
Permits listed by average unit count per filing
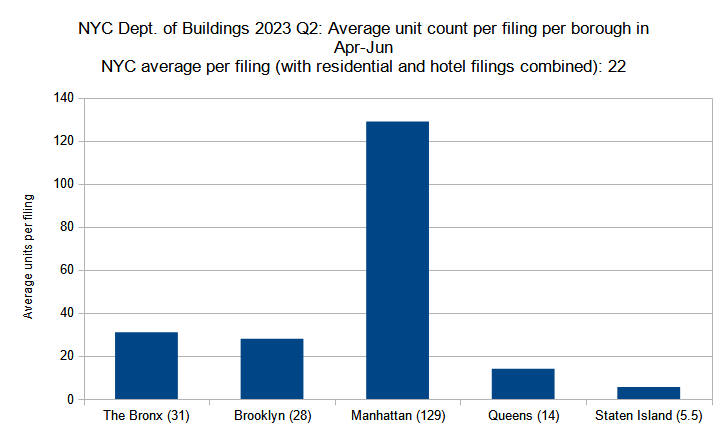
Average unit count (residential and hotel) per new construction permit per borough filed in New York City in Q2 (April through June) 2023. Data source: the Department of Buildings. Data aggregation and graphics credit: Vitali Ogorodnikov
The average unit count per residential or hotel filing, when tallied by borough, reflects the trends observed in the above analysis, as the growths and decreases in unit counts within each borough roughly reflect fluctuations in average filing unit counts.
During the period, the size of an average residential or hotel filing in The Bronx remained the same, with 31 filings per quarter. Meanwhile, as Brooklyn doubled its number of unit filings between the two quarters, the average unit count per filing also nearly doubled from 15 in Q1 to 28 in Q2, almost catching up with The Bronx.
The average filing size for Manhattan more than doubled, ballooning from 53 units per filing in Q1 to 129 in Q2, further distancing its lead over its counterparts. Queens, which saw a slight dip in the total filed-for unit count between the two quarters, saw a concurrent minor decrease in average filing size from 16 units in Q1 down to 14 units in Q2.
As before, one- and two-family developments comprise the overwhelming majority of filings in sprawling Staten Island. However, while apartment building filings in the borough were virtually absent in the first quarter of the year, the second quarter saw filings for five apartment buildings with between five and 279 units each, increasing the average unit count per filing from 1.5 in the first quarter to 5.5 in the second.

Photo by Michael Young
Permit filings by floor count category
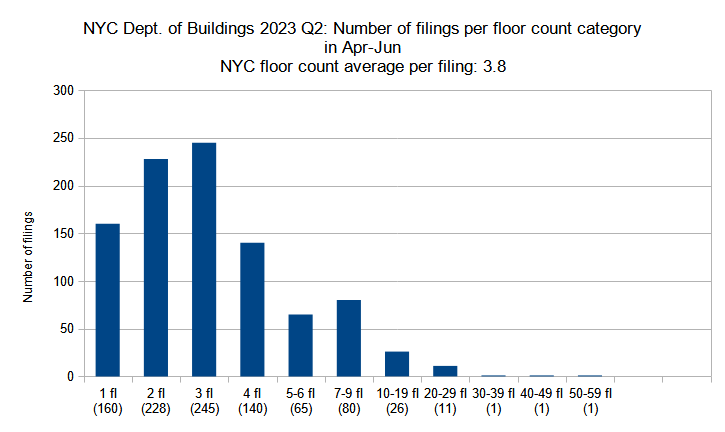
New construction permits filed in New York City in Q2 (April through June) 2023 grouped by floor count. Data source: the Department of Buildings. Data aggregation and graphics credit: Vitali Ogorodnikov
Though New York City is renowned for its skyline, it remains a predominantly low-rise city, a fact that is reflected in new building filings. Over the course of our record-keeping, YIMBY has observed that the average floor count for project filings for any given period tends to hover around four stories, or just below. In the year’s first quarter, the figure dipped lower than usual, down to an average of 3.6 floors per filing. In the second quarter, however, the figure rose back slightly, up to an average of 3.8 stories.
The total number of filings for single-story structures, many of which represent garages that come with single-family developments, rose from 132 in Q1 up to 160 in Q2. While the number of two-story filings remained almost the same, three-story filings saw a dramatic increase from 206 in Q1 up to 245 in Q2. Four-story filings rose from 126 in Q1 to 140 in Q2.
More dramatic relative increases were observed in the mid- and high-rise categories. While filings in the five- to six-story category remained constant, with 65 in each quarter, filings for buildings with seven to nine floors rose from 64 in Q1 up to 80 in Q2. Concurrently, between the two quarters, the number of filings for ten- to 19-story buildings rose from 18 to 26 and 20- to 29-story filings increased in count from five to 11.
For the second quarter, the five filings with the highest floor counts are 589 Fulton Street in Downtown Brooklyn (52 stories), 29-10 Northern Boulevard in Long Island City, Queens (46 stories), 711 Seventh Avenue in the Theater District (32 stories), and 1440 Amsterdam Avenue in Manhattanville and 126 East 57th Street in Midtown East (28 stories each).
Photo by Michael Young
Average number of floors per filing per borough
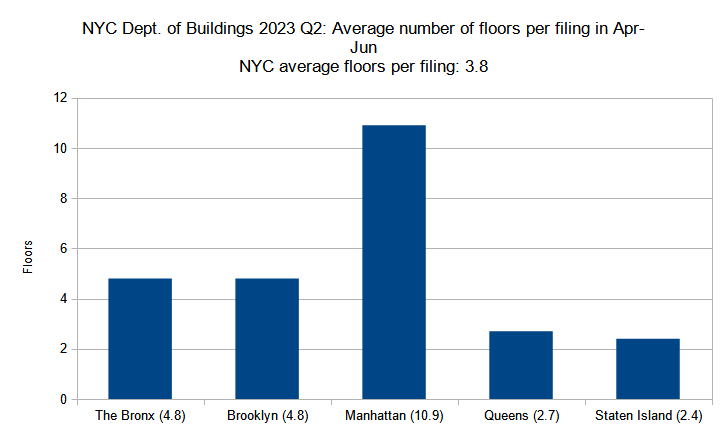
Average number of floors per new construction permit per borough filed in New York City in Q2 (April through June) 2023. Data source: the Department of Buildings. Data aggregation and graphics credit: Vitali Ogorodnikov
The breakdown of average floor count per filing by borough remained largely the same as in the previous quarter. Manhattan, the city’s most densely populated borough, continues to boast the highest average floor count per filing, although it dipped from an average of 11.8 floors in Q1 down to 10.9 floors in Q2.
In turn, The Bronx inched up slightly from 4.7 in Q1 to 4.8 in Q2. Brooklyn caught up to a second-place tie by increasing from 4.4 floors in Q1 to 4.8 stories in Q2. The Queens average shrank slightly, dropping from three stories in Q1 to 2.7 stories in Q2. Curiously, despite registering a number of filings in Q2 that are much larger than any in Q1, Staten Island’s average remained static at 2.4 floors.
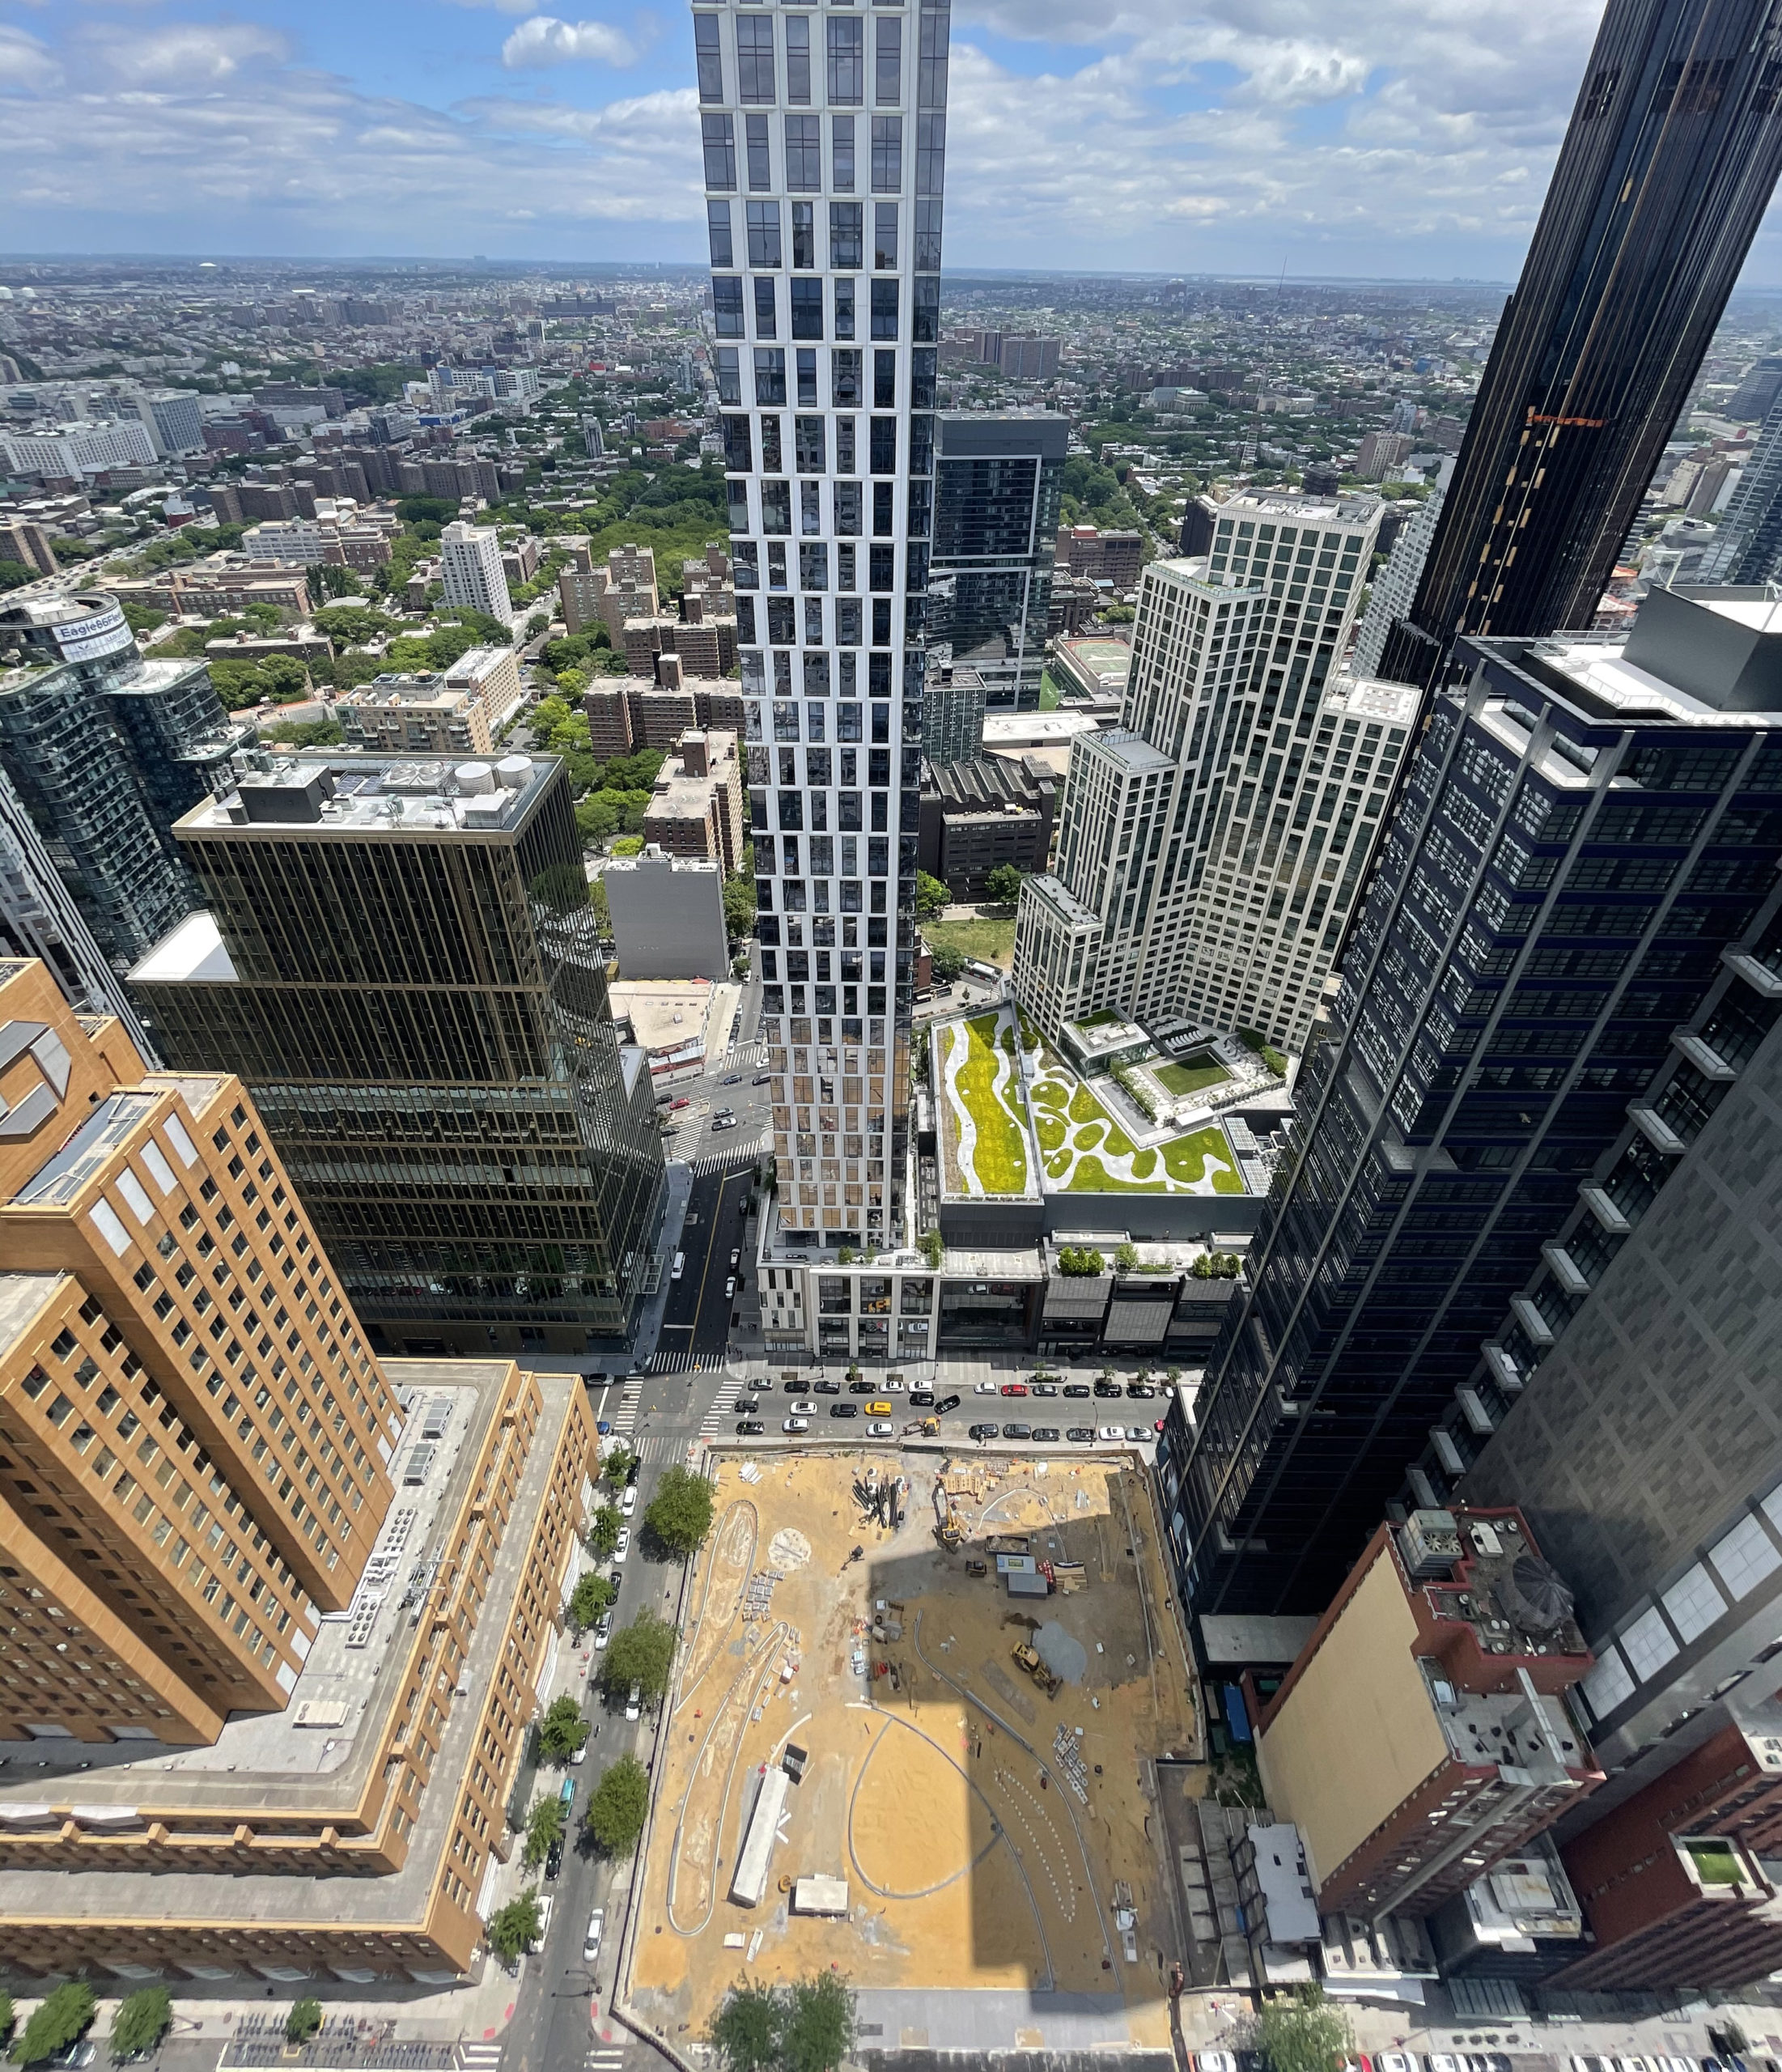
Photo by Michael Young
Permits listed by floor area per filing
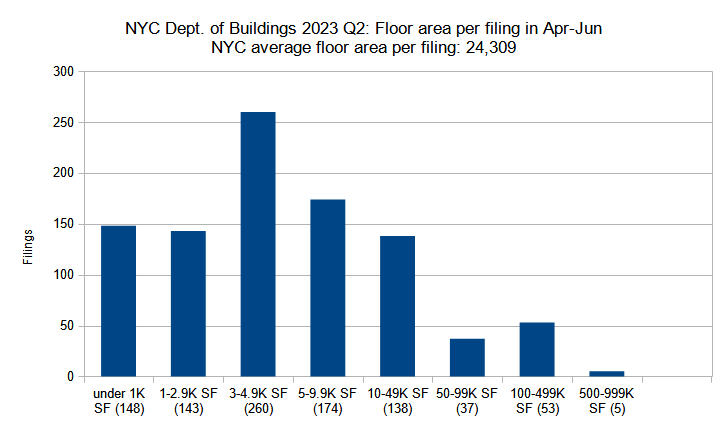
New construction permits filed in New York City in Q2 (April through June) 2023 grouped by total floor area. Data source: the Department of Buildings. Data aggregation and graphics credit: Vitali Ogorodnikov
Although the increase in overall new building filings was rather modest (from 840 in Q1 to 956 in Q2), the total filed-for square footage nearly doubled, surging from 13.4 million square feet in Q1 to 23.2 MSF in Q2. As such, the floor area of the average filing has increased significantly, growing from 15,890 square feet in Q1 to 24,309 square feet in Q2.
Curiously, two smaller categories, namely for buildings under 1,000 square feet and those between 3,000 to 5,000 square feet, saw notable increases, with the former rising from 106 in Q1 to 148 in Q2 and the latter increasing from 218 in Q1 to 260 in Q2. Numbers for the rest of the categories under 50,000 square feet largely remained stable.
The dramatic quarterly increase in total square footage comes mostly from an uptick in large filings. The number of filings for buildings measuring 50,000 to 100,000 square feet rose from 29 in Q1 to 37 in Q2. Filings measuring 100,000 to 500,000 square feet more than doubled, increasing from 26 in Q1 to 53 in Q2, as did those in the 500,000 to 1-million-square-foot category, which grew from two in Q1 to five in Q2.
In the second quarter, the filings with the largest footage are for a facility at 980 East 149th Street in Hunts Point, The Bronx (986,360 square feet), a five-story commercial building at 39-02 Northern Boulevard in Douglaston, Queens (883,470 square feet), and residential high-rises at 589 Fulton Street in Downtown Brooklyn (597,824 square feet), 407 West 206th Street in Inwood (537,702 square feet), and 29-10 Northern Boulevard in Long Island City, Queens (510,543 square feet).
Photo by Michael Young
Total floor area filed by borough
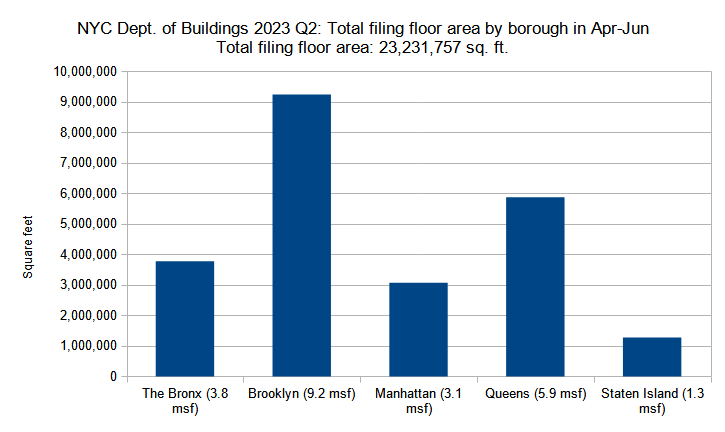
Combined floor area of new construction permits filed per borough in New York City in Q2 (April through June) 2023. Data source: the Department of Buildings. Data aggregation and graphics credit: Vitali Ogorodnikov
The total filed-for square footage in Brooklyn more than doubled between the two quarters, ballooning from 4.3 million square feet in Q1 to 9.2 million square feet in Q2 and pushing the borough to first place among its peers. Queens, now in second place, showed a less drastic increase, rising from 4.8 million square feet in Q1 to 5.9 MSF in Q2.
The Bronx, still in third place, rose from 2.1 million square feet in Q1 to 3.8 MSF in Q2, nearly doubling its total. The figure for Manhattan more than doubled, increasing from 1.5 MSF in Q1 to 3.1 MSF in Q2. Finally, Staten Island pushed past the 1-million mark by rising from around 689,000 square feet in the first quarter to 1.5 million square feet in the second.
The largest filings per borough are as follows: The Bronx: 980 East 149th Street in Hunts Point (986,360 square feet); Brooklyn: 589 Fulton Street in Downtown Brooklyn (597,824 square feet); Manhattan: 407 West 206th Street in Inwood (537,702 square feet); Queens: 39-02 Northern Boulevard in Douglaston; and Staten Island: 8 Stuyvesant Place in St. George (314,464 square feet).

Photo by Michael Young
Average floor area per permit filing by borough
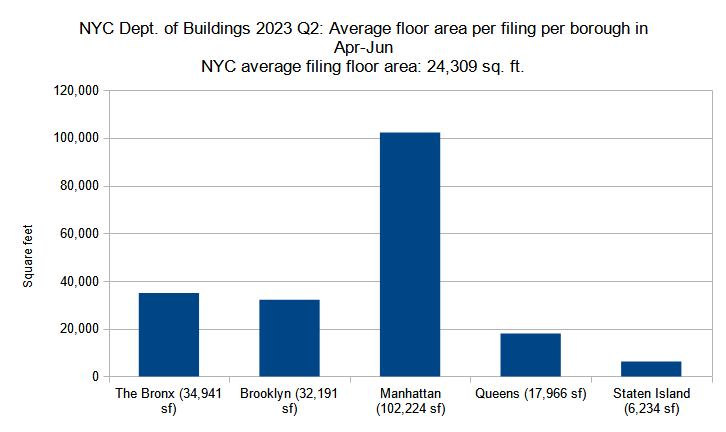
Average floor area per new construction permit per borough filed in New York City in Q2 (April through June) 2023. Data source: the Department of Buildings. Data aggregation and graphics credit: Vitali Ogorodnikov
As expected, the chart displaying the average floor area per filing per borough in the second quarter of the year closely follows the trends observed in the summary of average unit counts per filing. Every borough showed an increase in its average filing size.
Manhattan, still easily in the lead, saw its average filing size increase from 81,000 square feet in Q1 to 102,000 square feet in Q2. The Bronx, still in second place, rose from 22,000 square feet in Q1 to 35,000 square feet in Q2. Brooklyn followed closely, nearly doubling its 17,000 square feet in Q1 to 32,000 square feet in Q2.
The figure for Queens rose more gradually, increasing from 17,000 square feet in Q1 to 18,000 square feet in Q2. Lastly, while Staten Island maintains the smallest average of the boroughs, it showed a dramatic increase from 3,600 square feet in Q1 to 6,200 square feet in Q2.
Photo by Michael Young
In all, the second quarter of 2023 showed some of the most impressive figures of any quarter over the past few years, a total of 956 new building filings with 23.2 million square feet and 16,202 residential and hotel units. While the numbers are certainly encouraging, the city still must do much more to put a dent into its dire housing affordability crisis.
This change needs to happen at all levels. Federal government ought to increase funding for transit infrastructure, a vital support system for high-density cities such as New York. In turn, the state government must ease its restrictive, Albany-legislated floor-to-area limitations that tether much of New York City, and encourage development not only in the city, but also in the satellite towns, which provide alternative residential options within the metropolitan area. The city needs to increase the number of, and funding for, new schools, libraries, and other social infrastructure necessary to support high density. Finally, development-averse New Yorkers ought to reconsider their hesitant views because an ample, adequate supply of new housing will lower the cost of living across the board and ultimately improve the quality of life of city residents of all income levels.

Photo by Michael Young
Photo by Michael Young

Photo by Michael Young
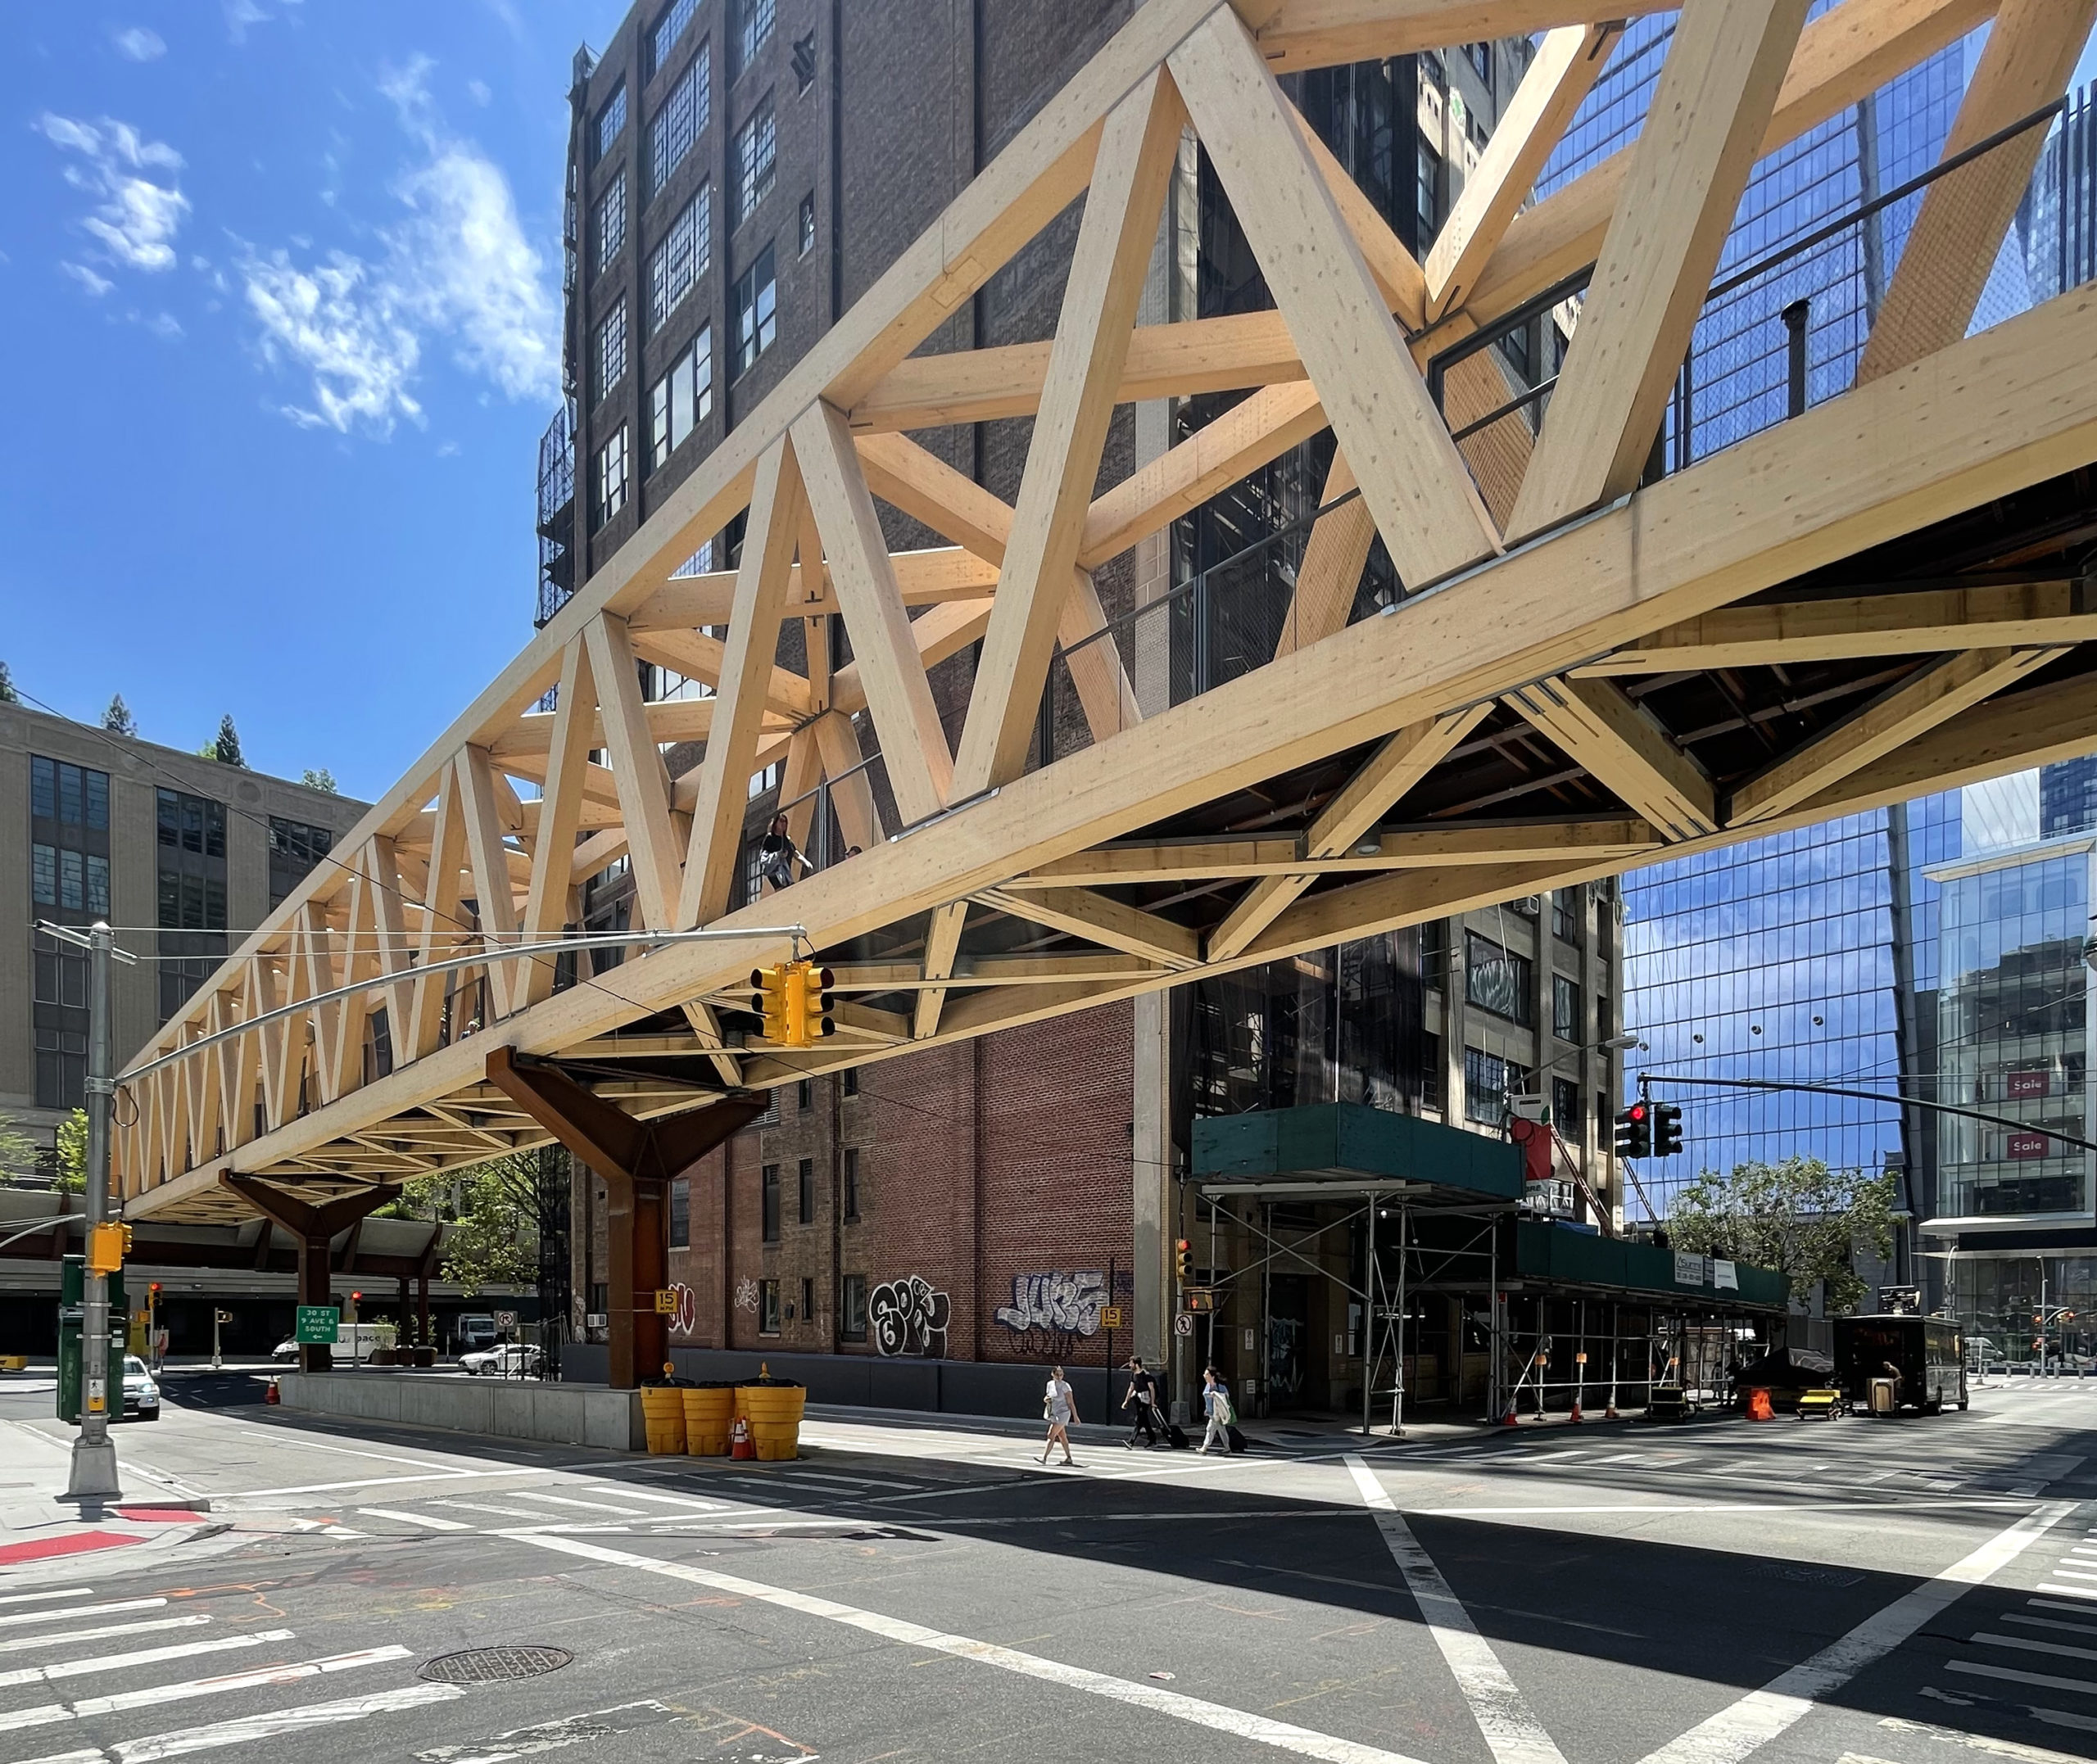
Photo by Michael Young
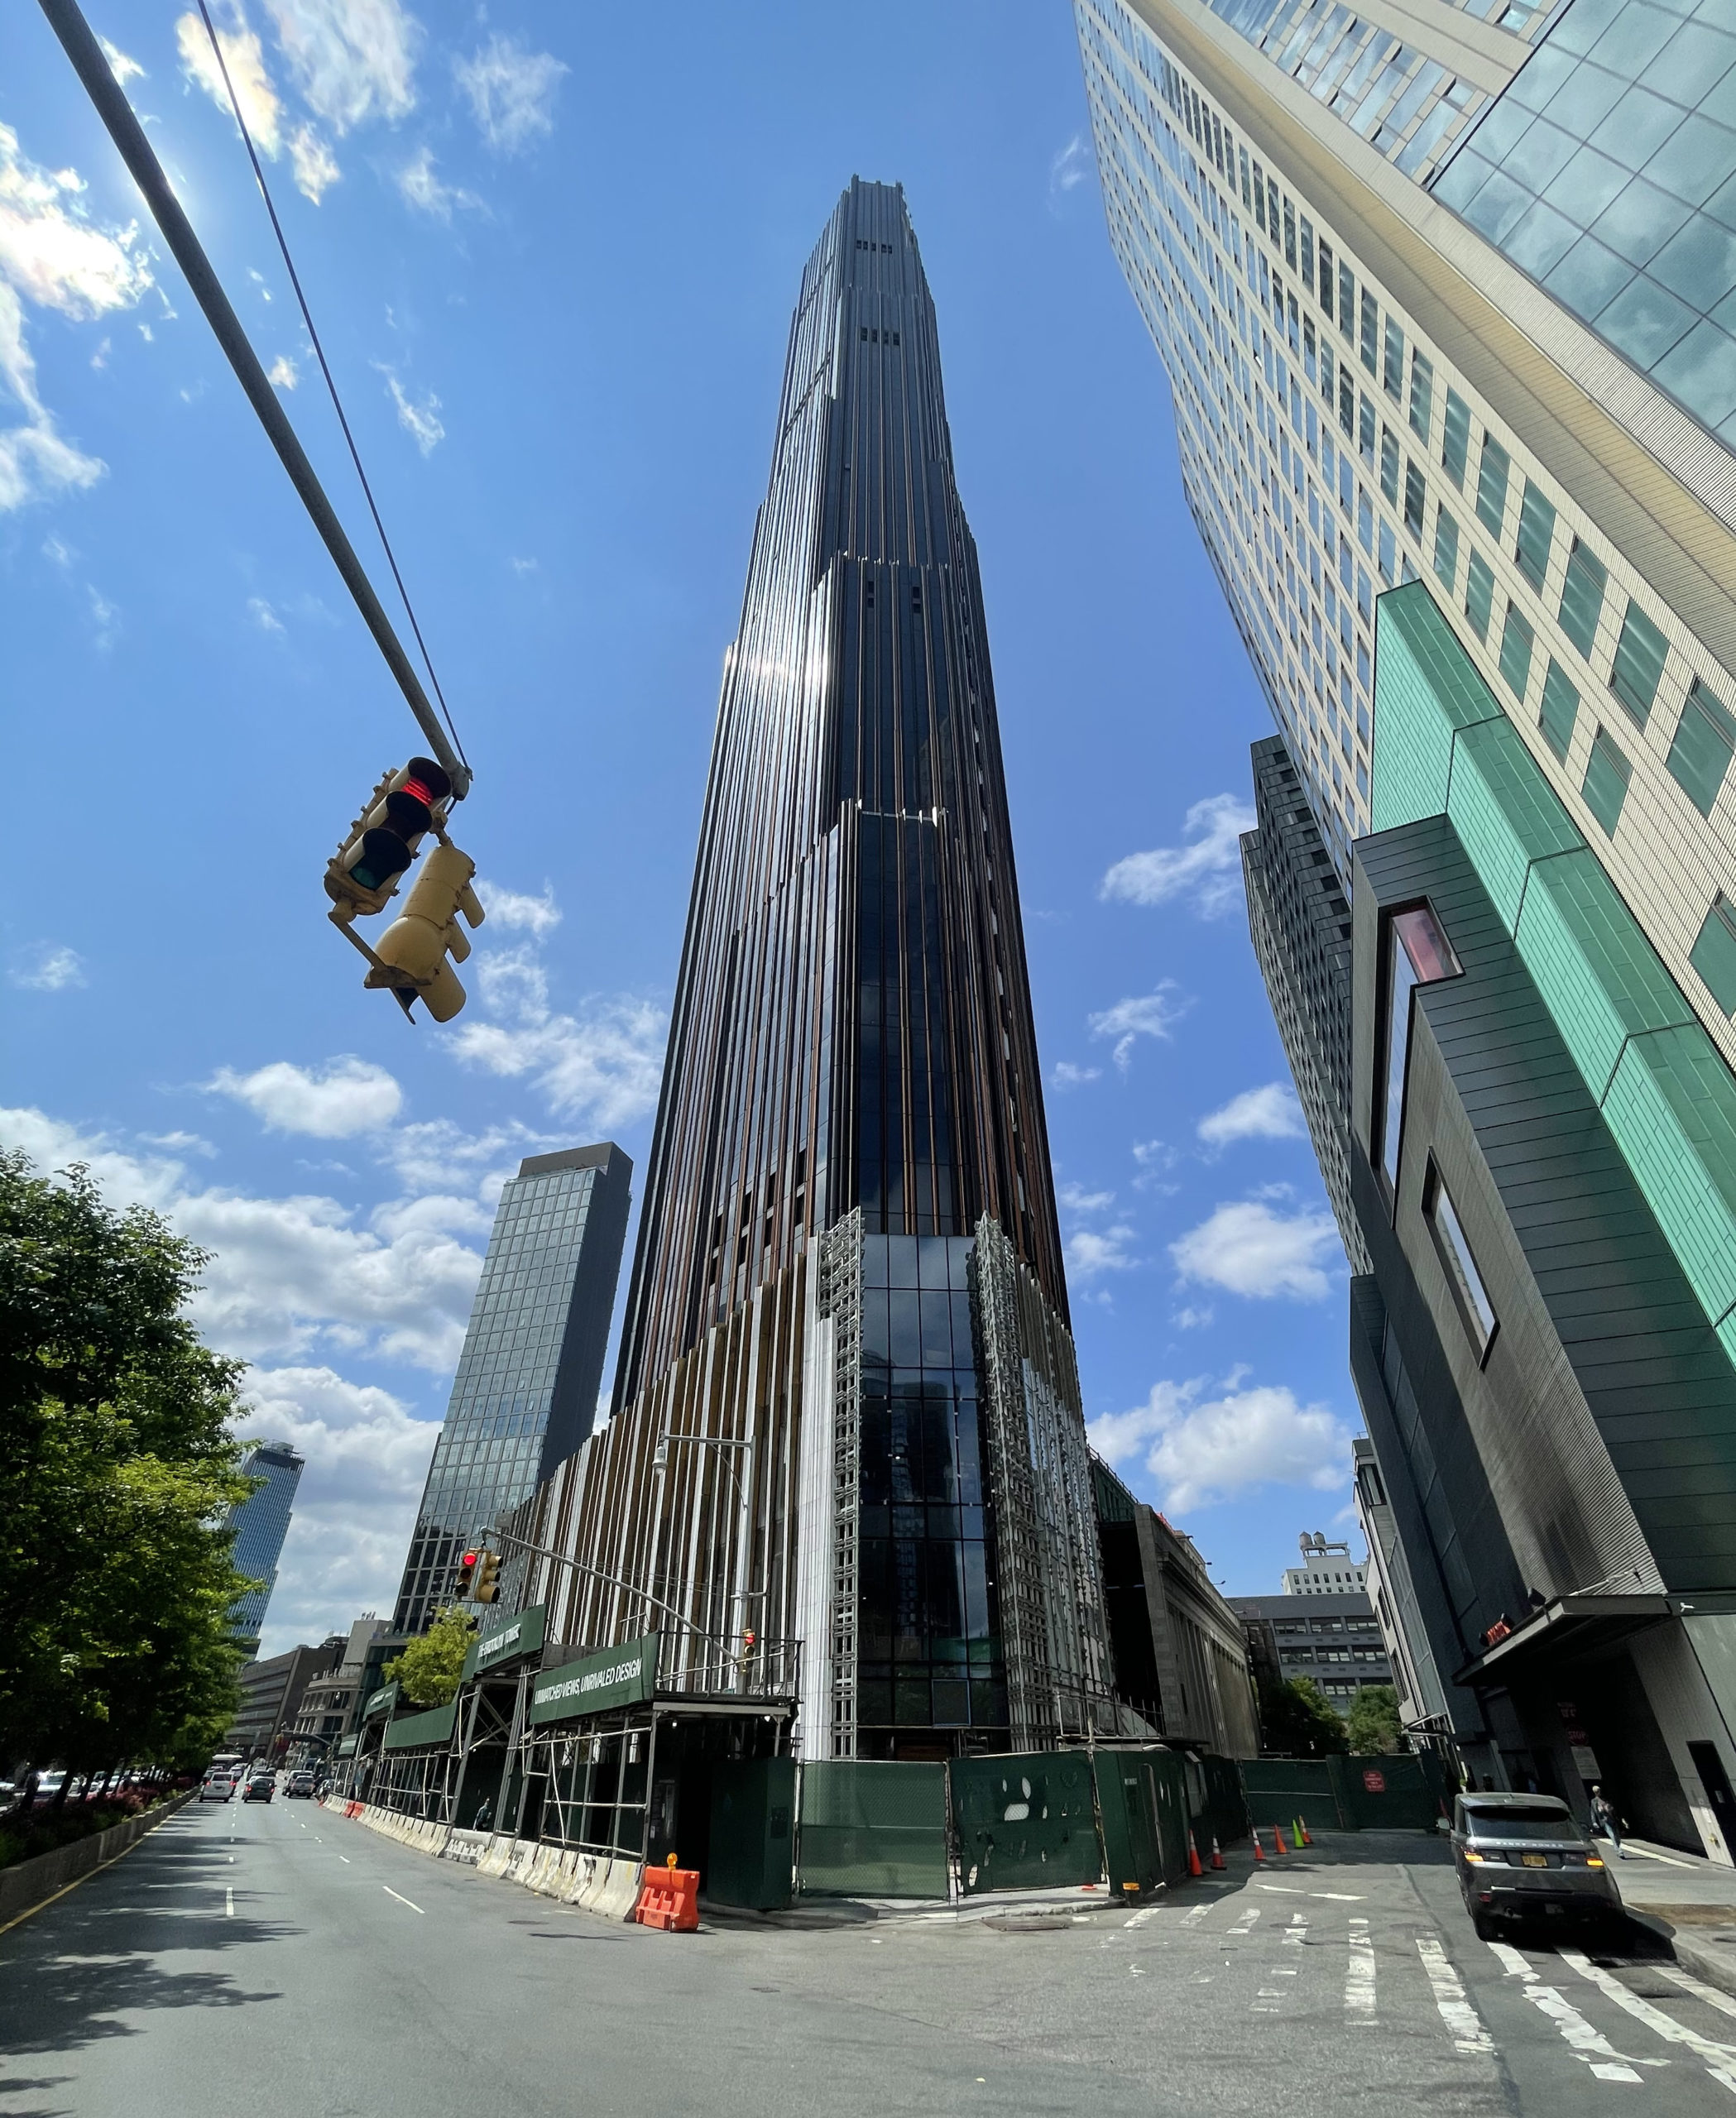
Photo by Michael Young
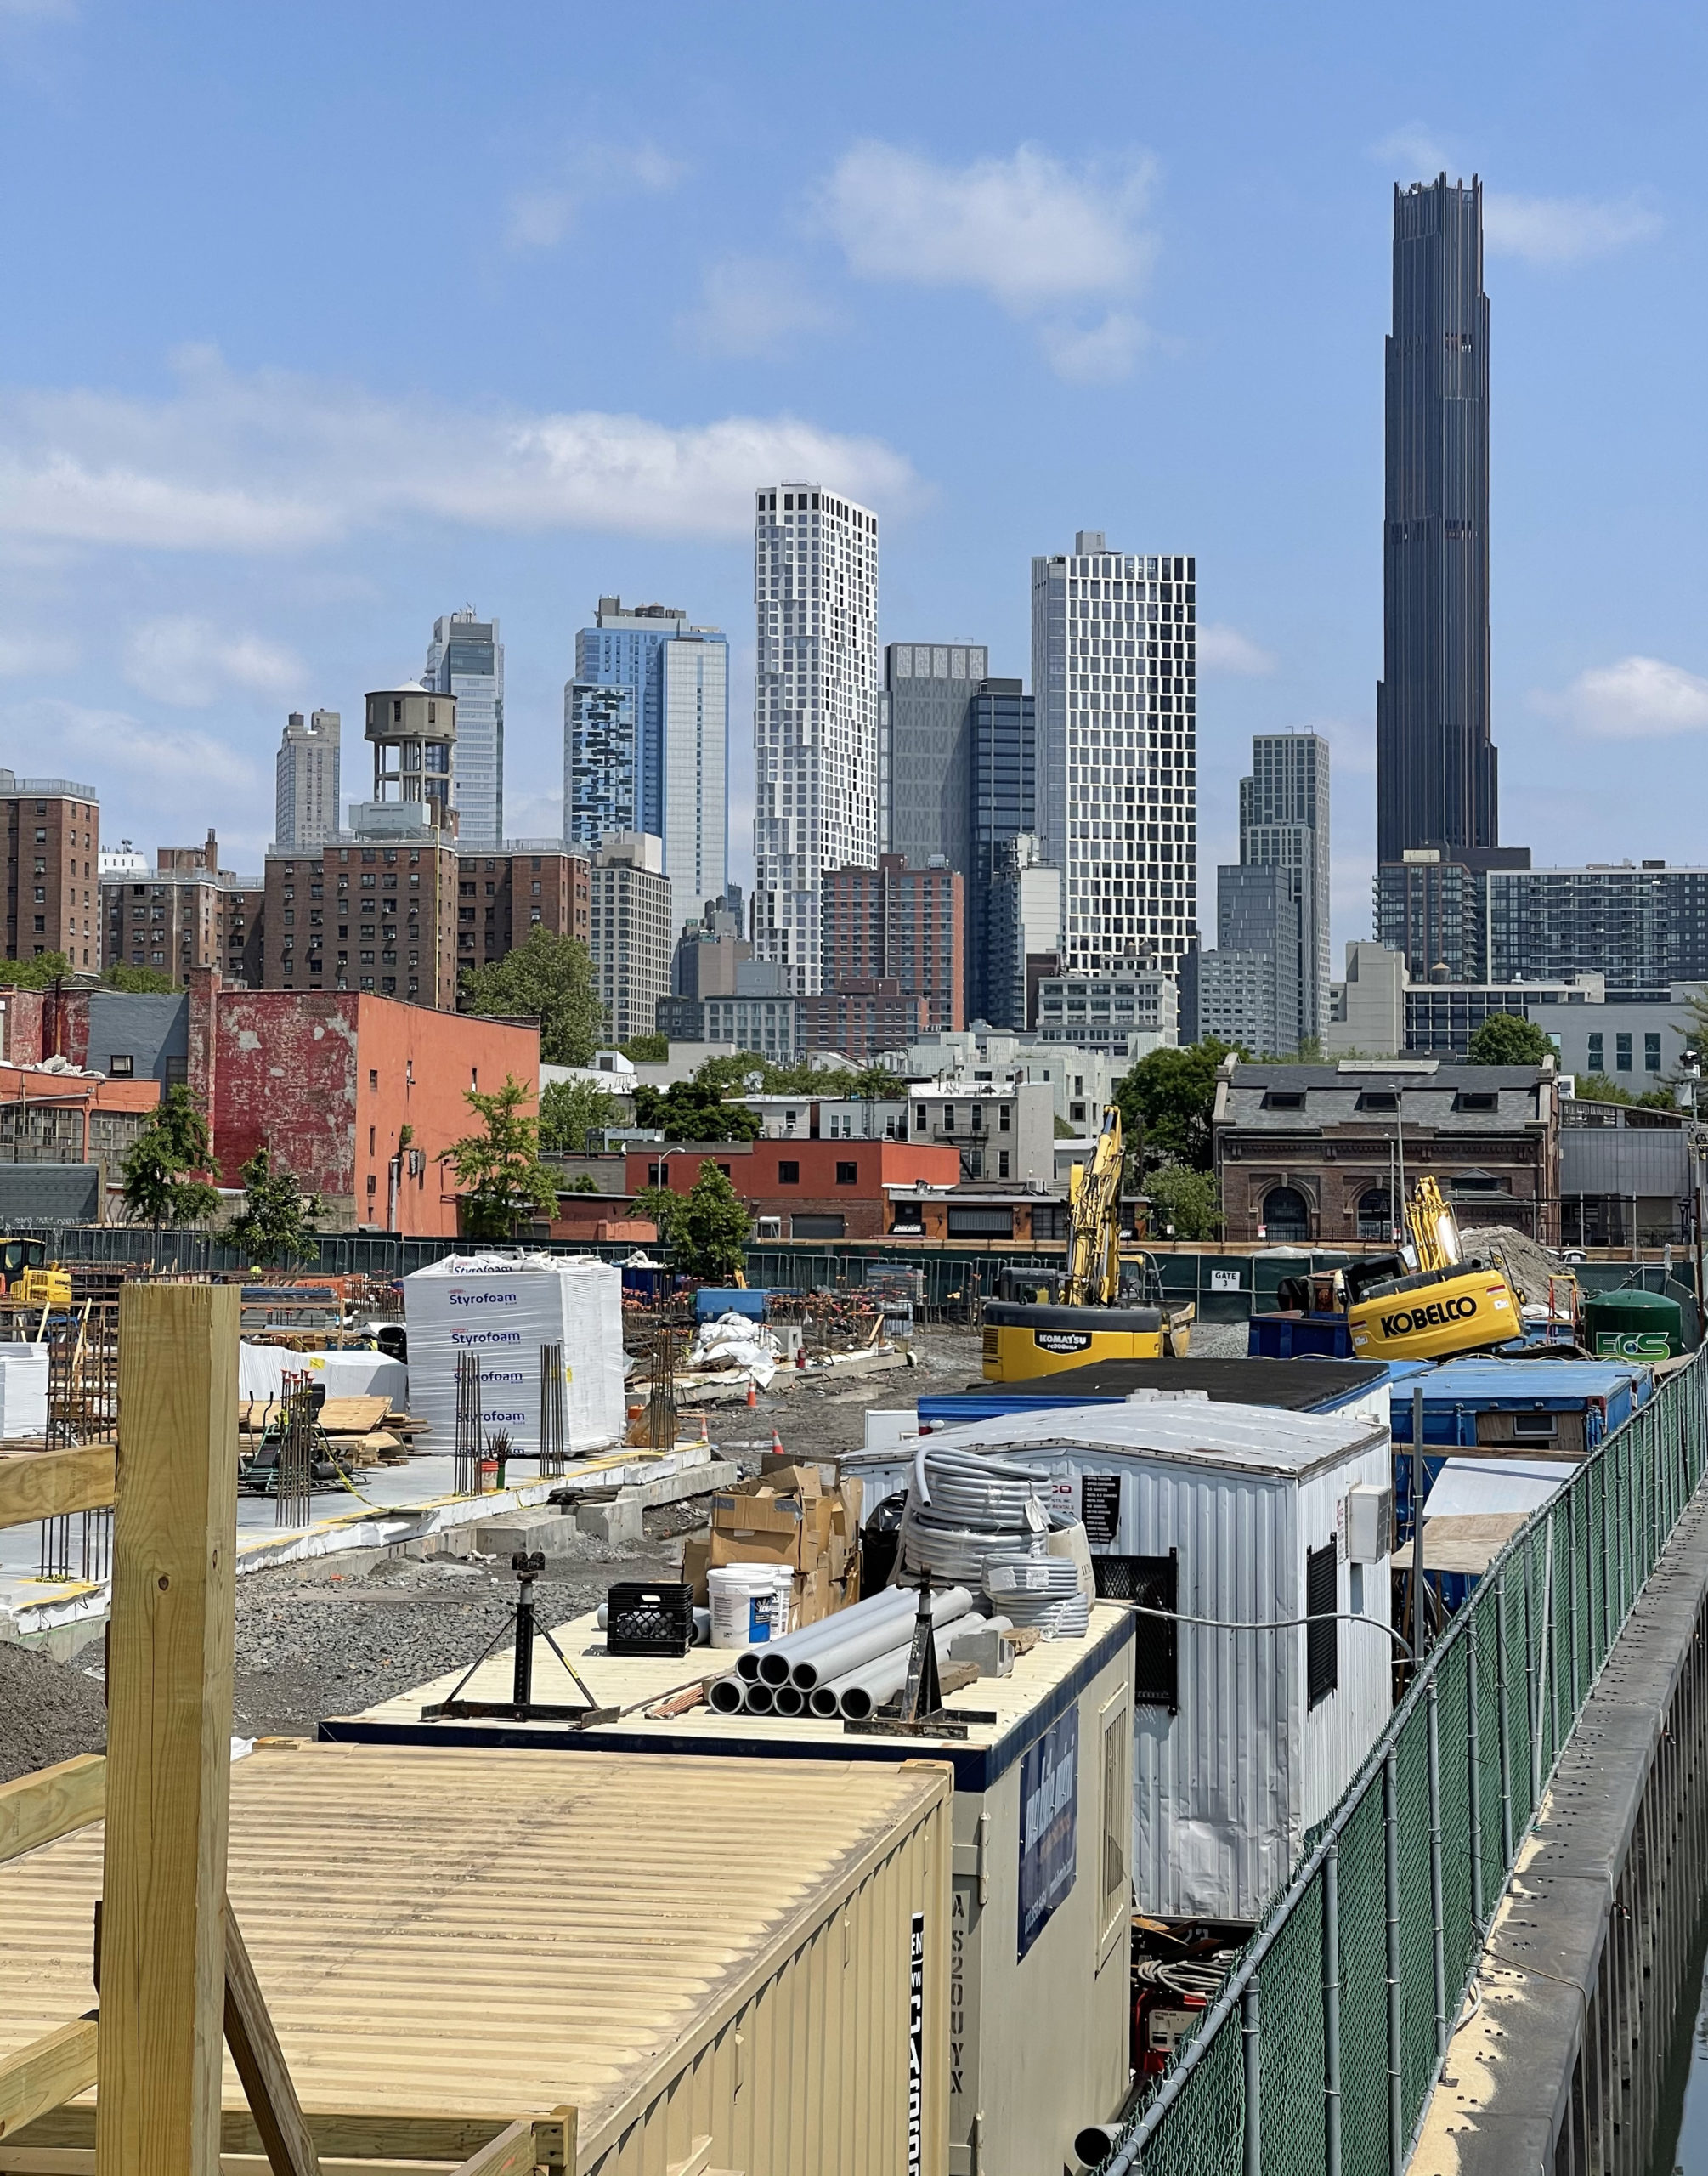
Photo by Michael Young

Photo by Michael Young
Photo by Michael Young

Photo by Michael Young
Photo by Michael Young

Photo by Michael Young
Photo by Michael Young
Photo by Michael Young

Photo by Michael Young

Photo by Michael Young
Photo by Michael Young
595 Dean Street. Photo by Michael Young

Photo by Michael Young

Looking up the main staircase. Photo by Michael Young

Photo by Michael Young

Photo by Michael Young

Photo by Michael Young


Photo by Michael Young
NOVA at at 41-05 29th Street – Photo by Michael Young
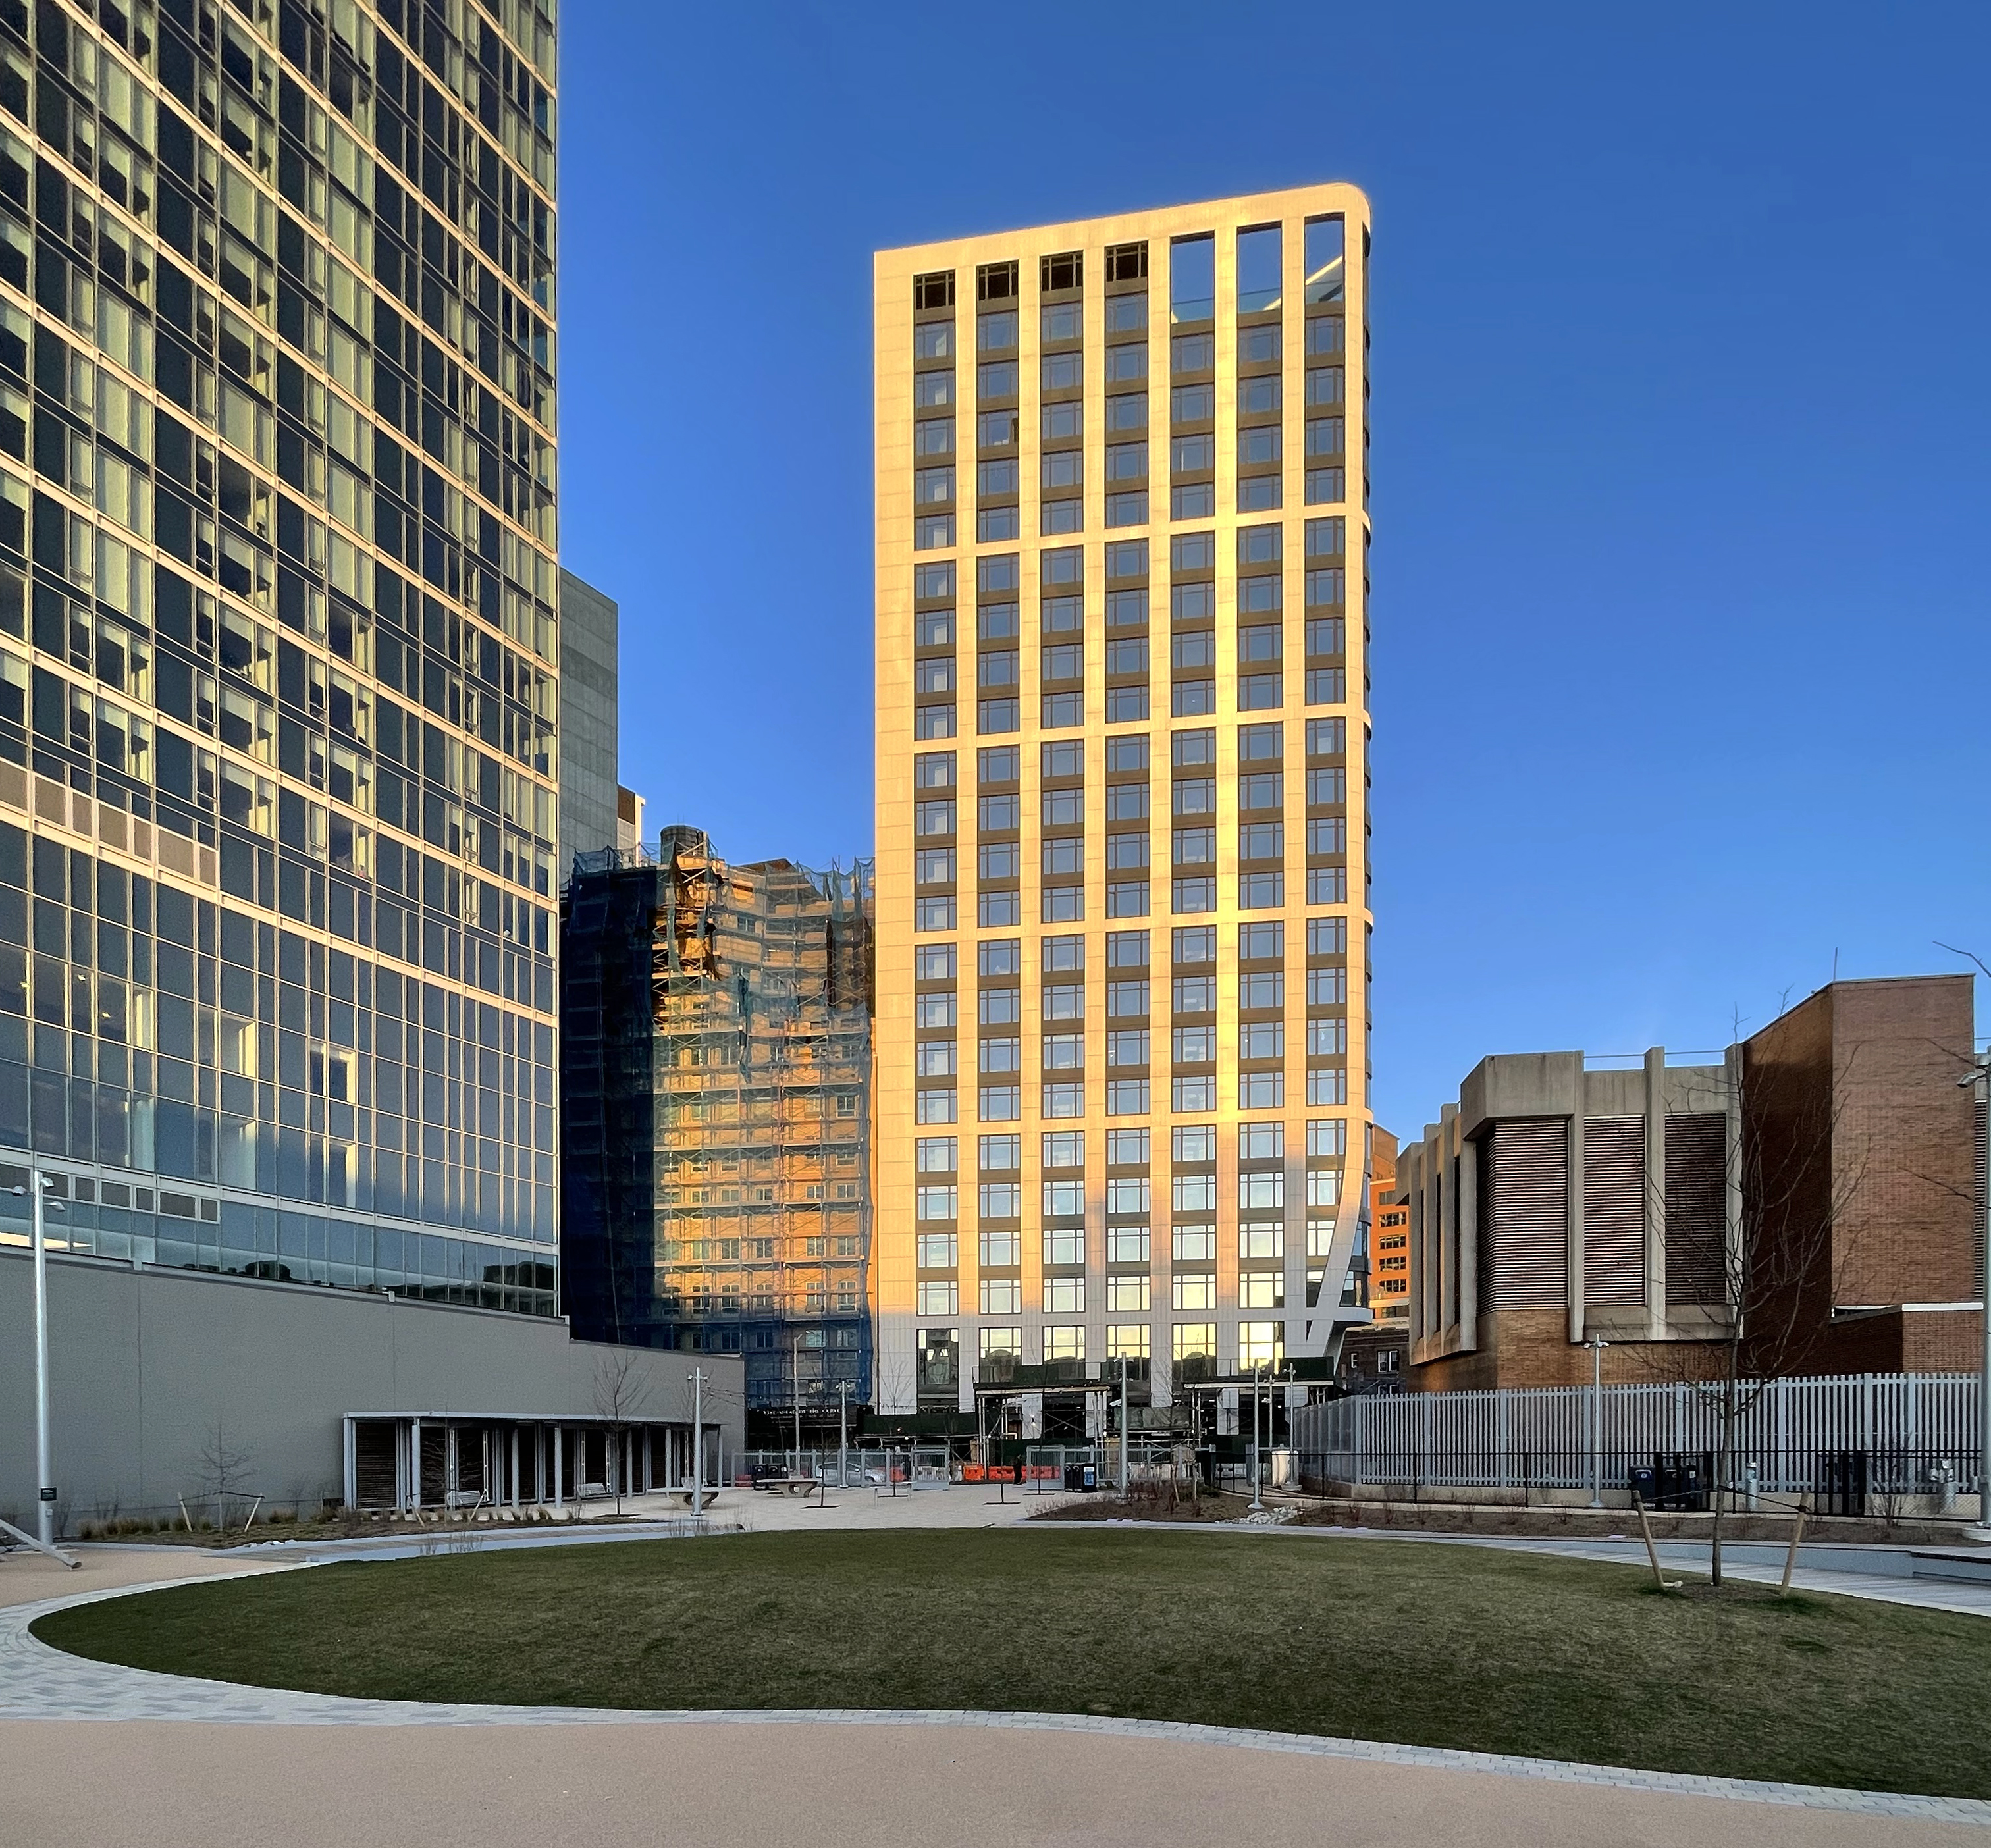
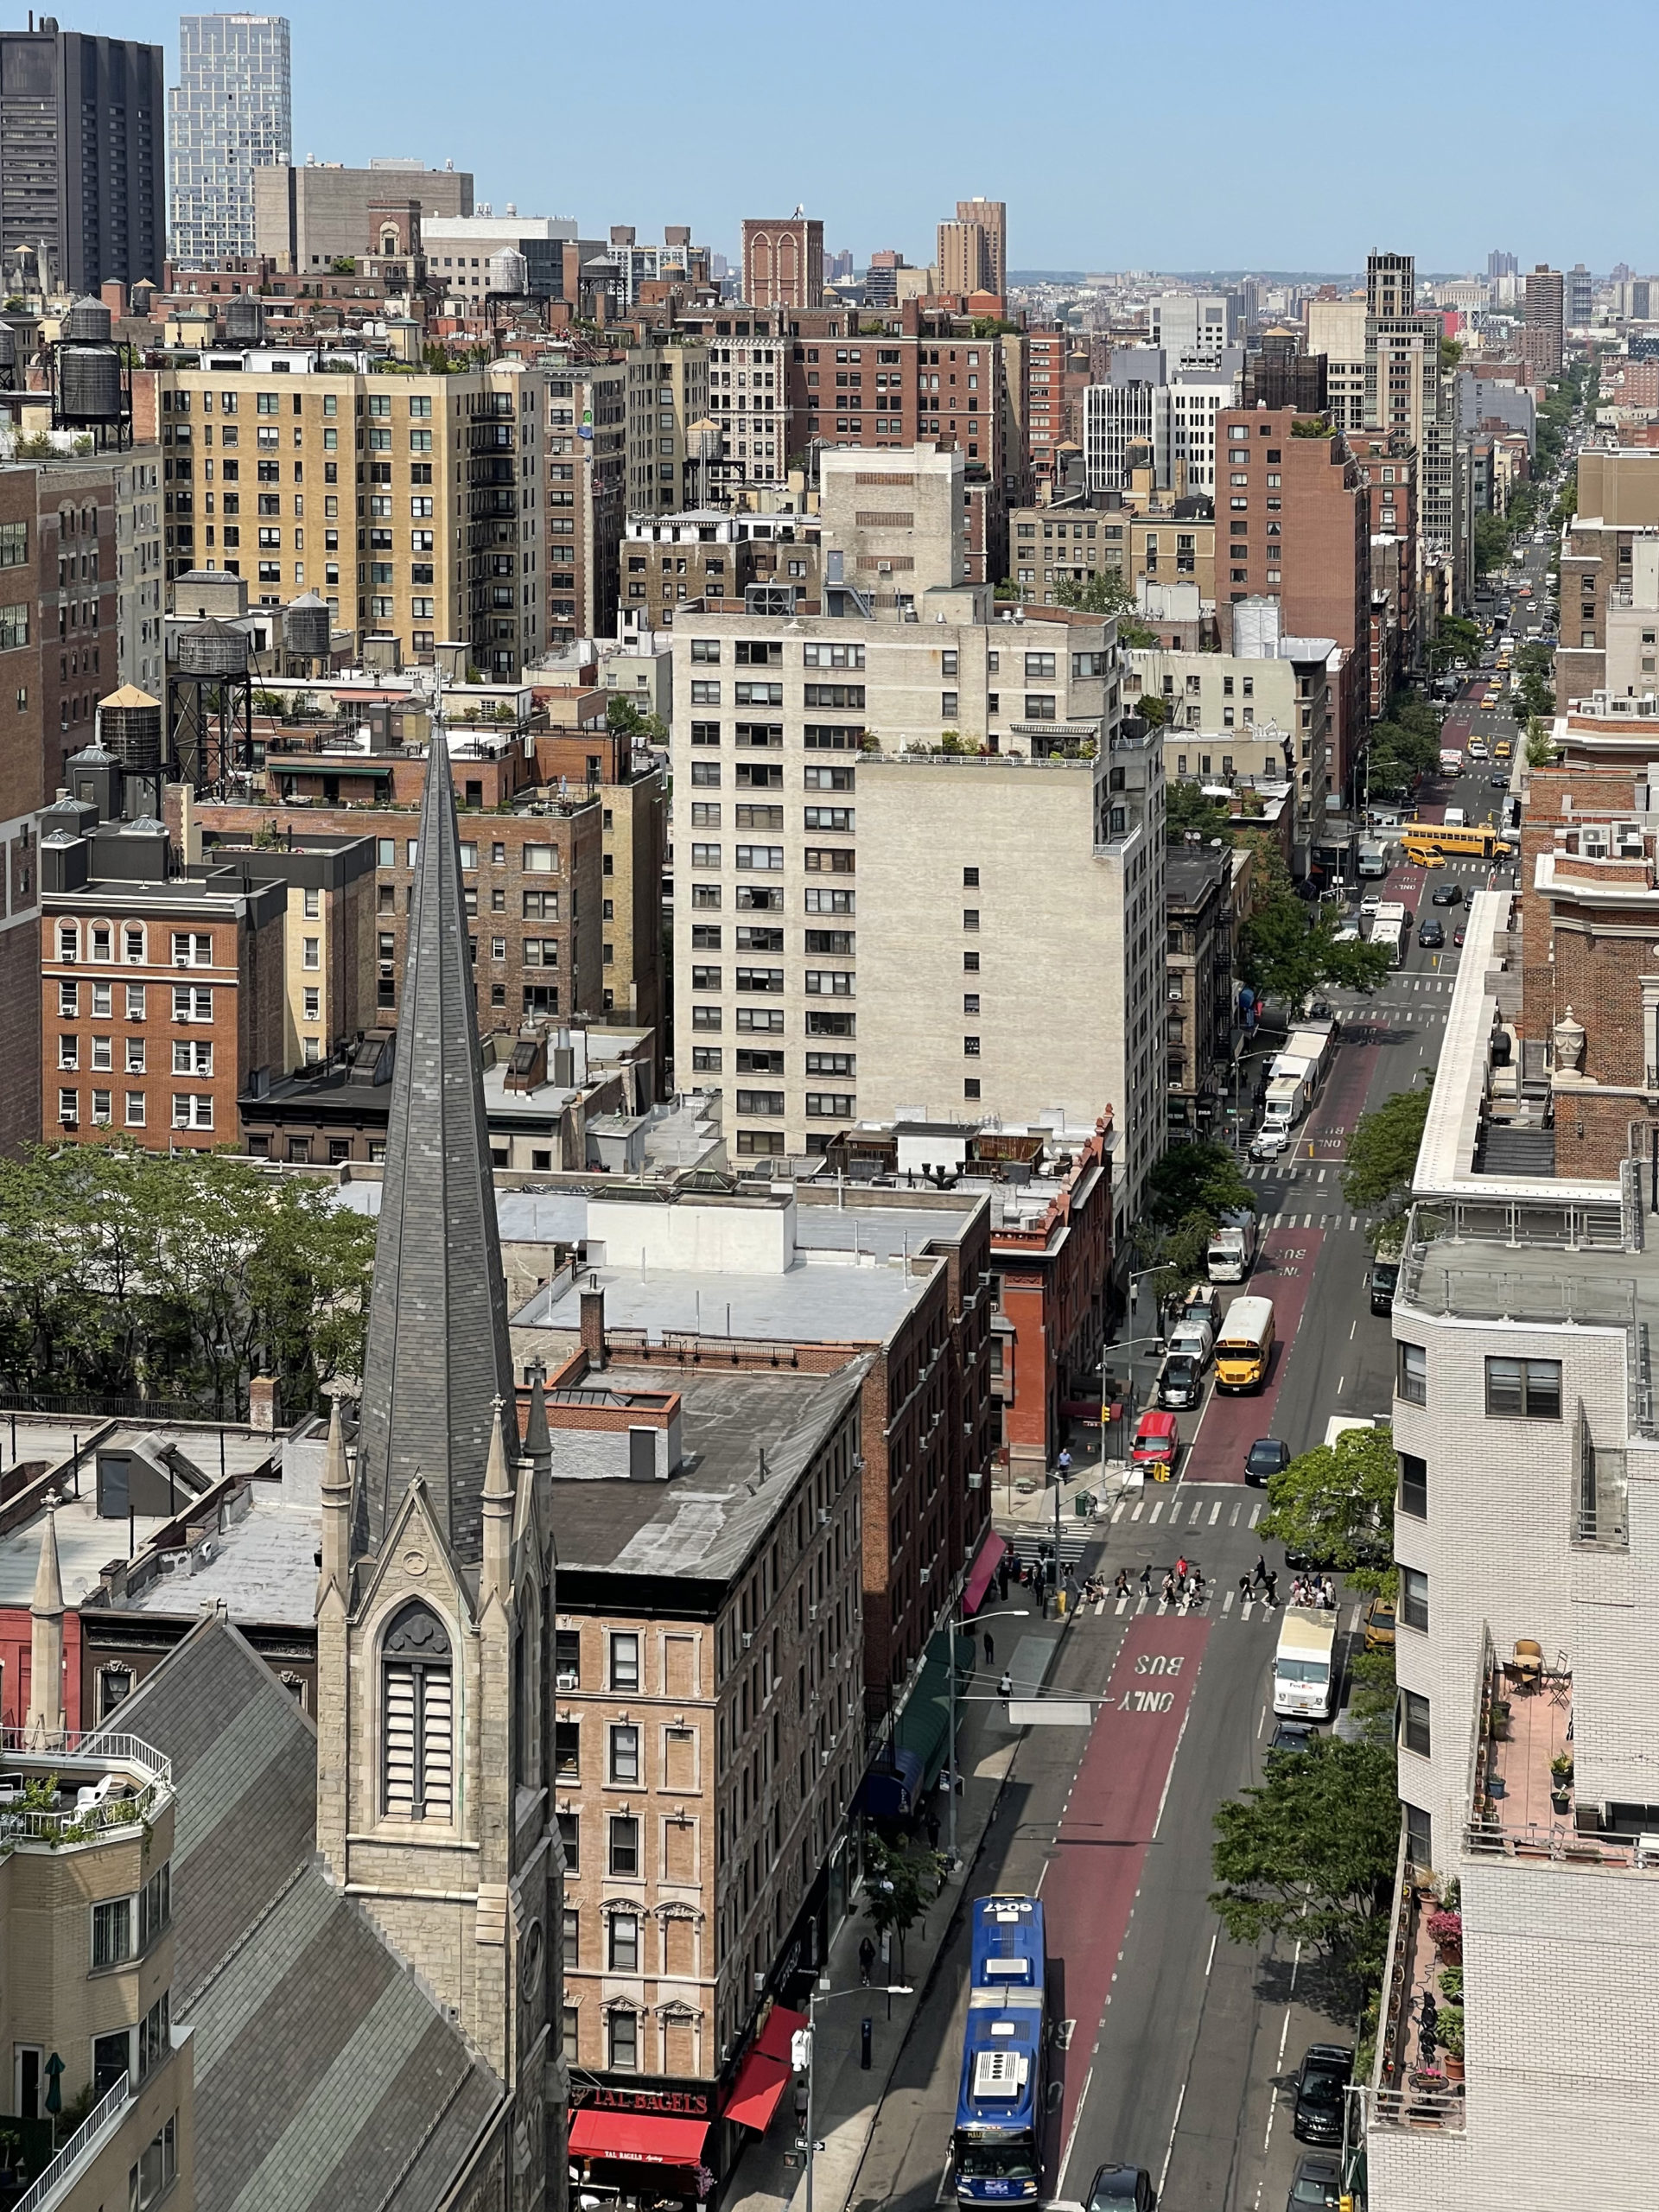
Photo by Michael Young
Subscribe to YIMBY’s daily e-mail
![]()
Follow YIMBYgram for real-time photo updates
Like YIMBY on Facebook
Follow YIMBY’s Twitter for the latest in YIMBYnews
New York is back! Building boom.
What is the net increase in units over what was previously occupying these properties? That is what I always wonder.
19k new units isn’t so impressive if they demolished 17k units to make room for them.
The ultra YIMBYs are silent about this phenomenon
Plus 2k better than minus 2k, I reckon! And did you just pull those numbers out of your hat?
Um, what? Virtually no old units were demolished to make way for new ones.
It’s good to see that the statistics are strong.
Hey NYC Dept of Buildings, it’s way past time to separate residential and hotel units. They are not the same, even with airbnb, and it’s ridiculous the difference will not be provided.
Given the skyscraper boom is clearly abating, hopefully developers will now focus on the continuing need for more housing not just for tax cheating millionaires.
“Cheating”? Well, maybe not. As a CPA, I say they could be tax-avoiding millionaires. Tax avoidance, in which tax laws are followed so as to minimize/eliminate their tax exposure/liability, is perfectly legal. Its tax evasion – aka cheating – that is illegal.
There is a lot of photographic work here, Michael Young.