
Construction is booming in New York, confirming that last quarter’s surge was no aberration. New York YIMBY’s third-quarter report, which covers June through August, indicates a continuation of the development momentum from the spring when total filed-for square footage rose by 73 percent.
Despite a slight dip, Q3 had strong totals of 986 filings (a 3-percent increase over Q2), 18.3 million square feet filed for (a 21-percent drop from Q2), and a total of 14,010 filed-for residential and hotel units (a 14-percent drop from Q2). The quarter also registered a new monthly filing count record for the entire three-plus year period during which YIMBY has tracked monthly totals. The following report takes a detailed look at the trends and statistics for new project filings during the third quarter of 2023, as analyzed from data submitted to the Department of Buildings. The complete list of quarterly filings, with detailed information on every project, is available with a subscription to YIMBY’s Building Wire.
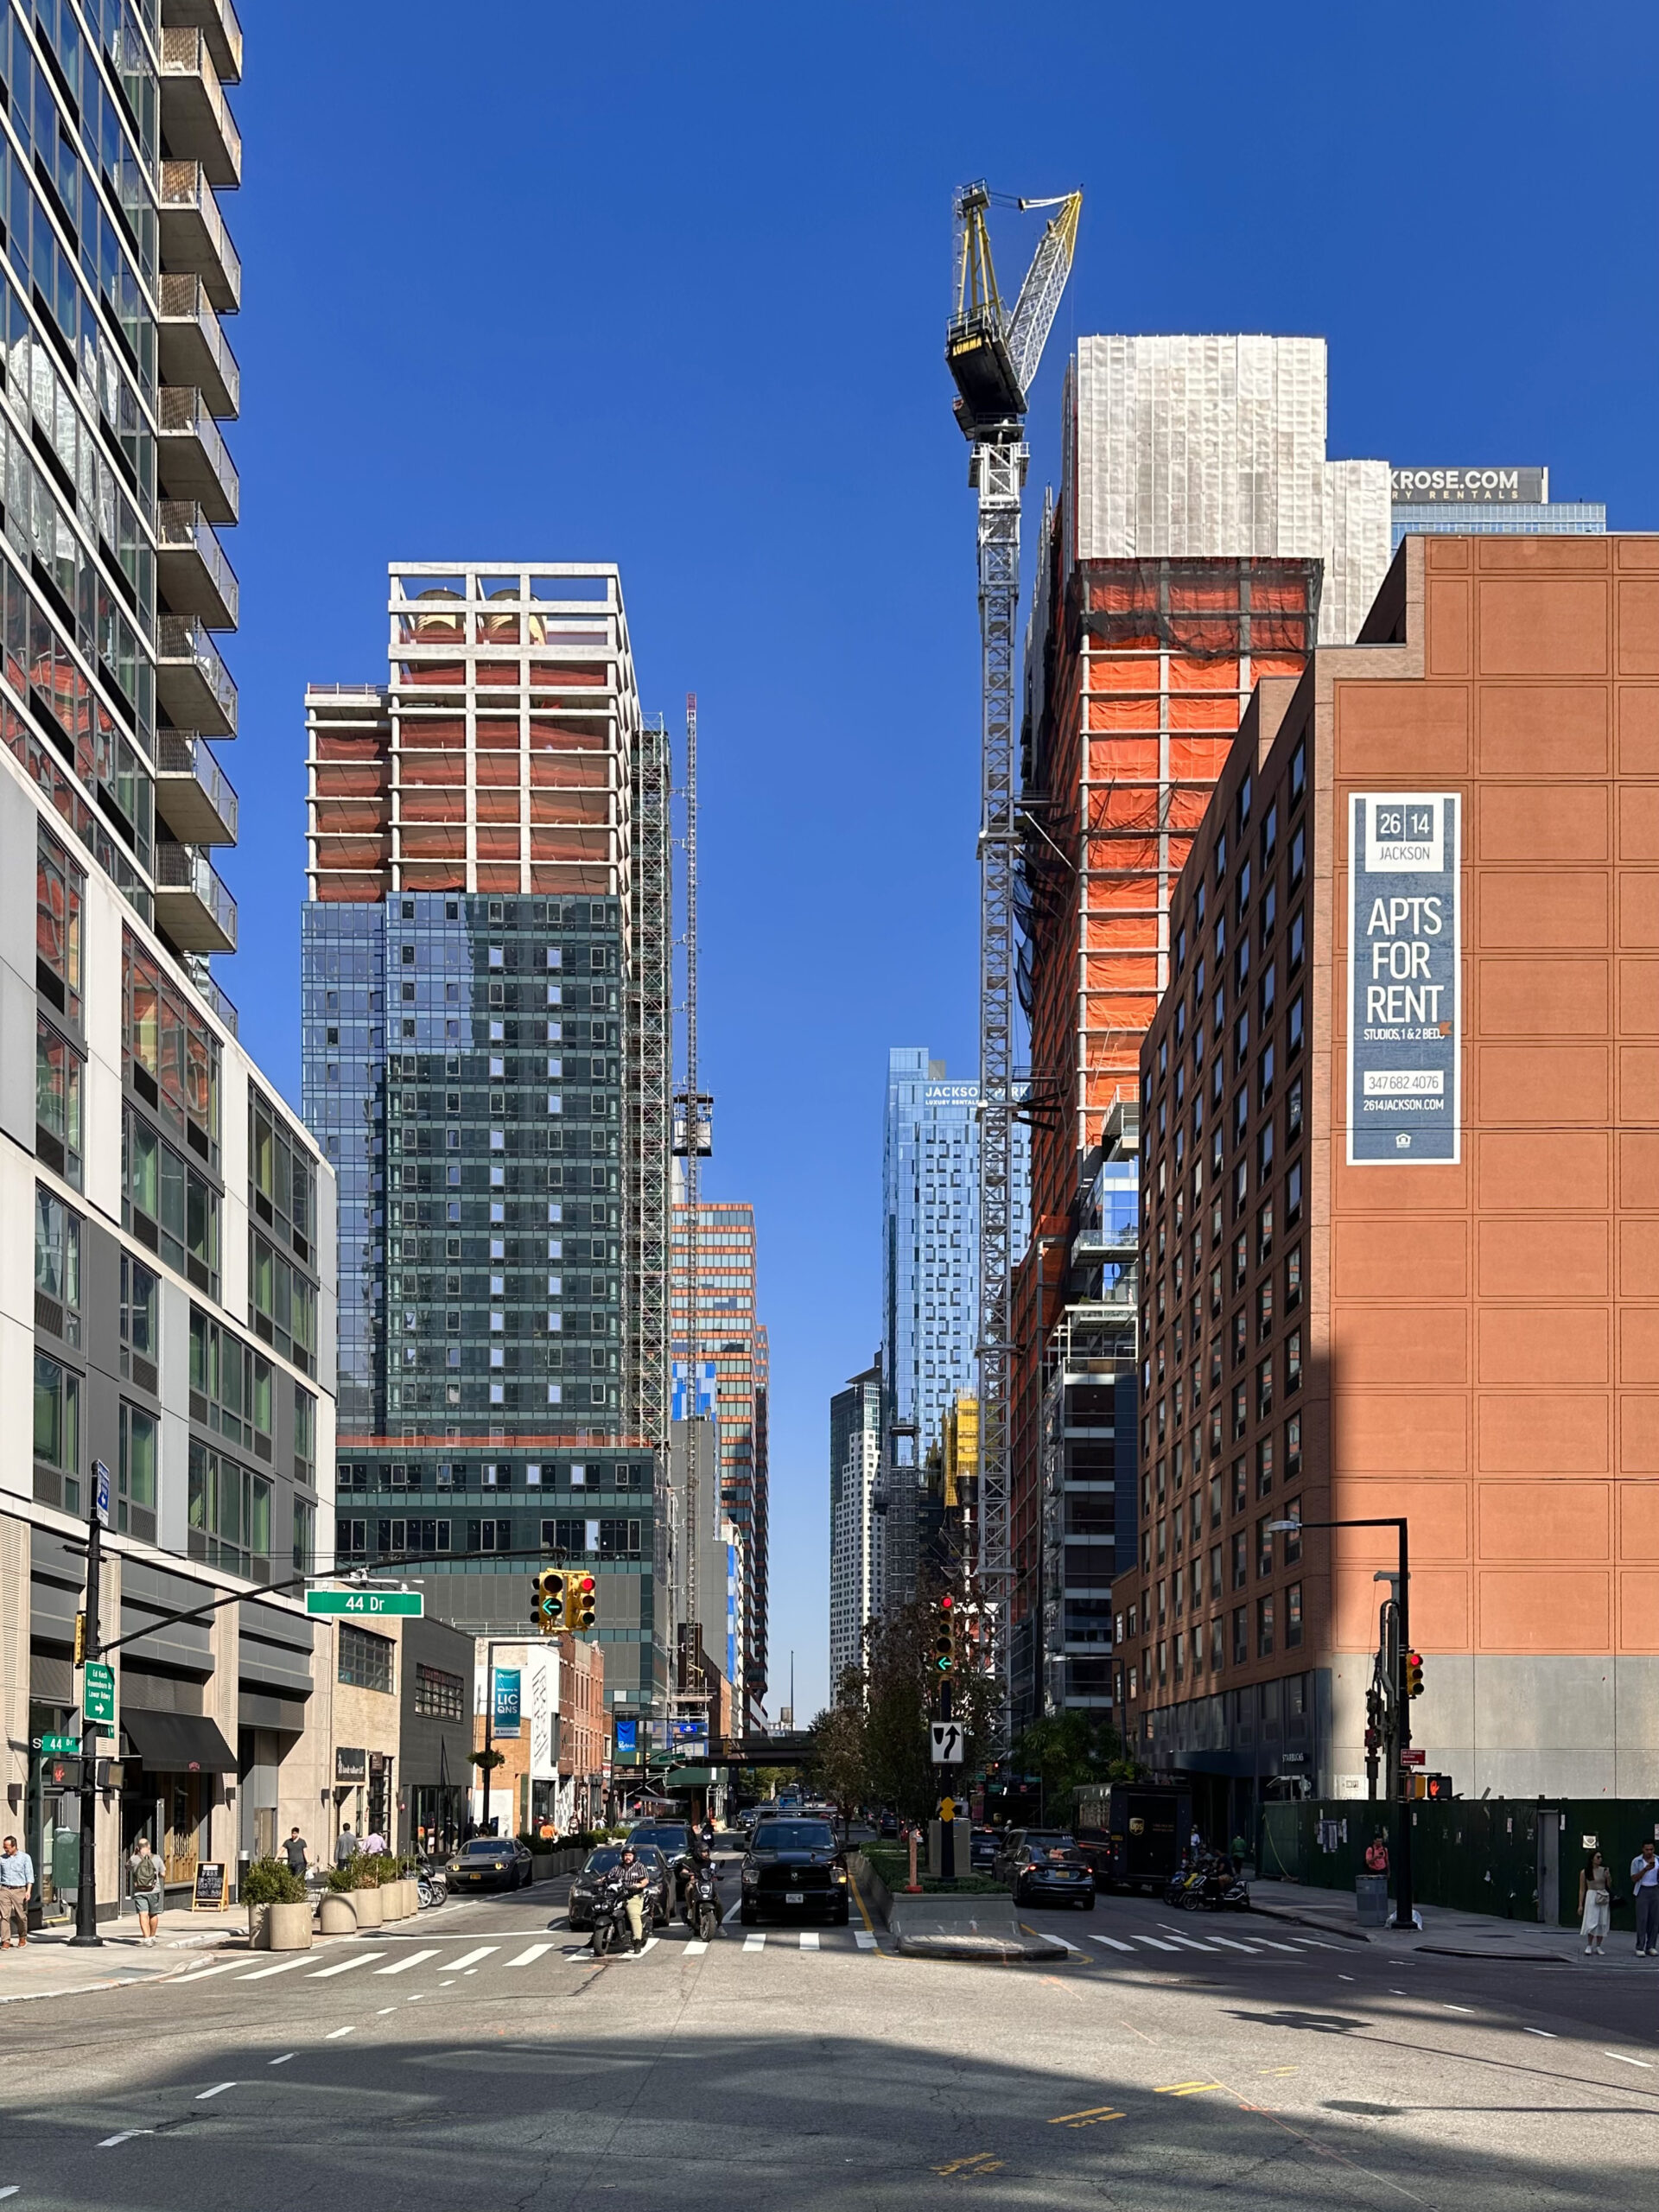
Photo by Michael Young
Number of permit filings per month
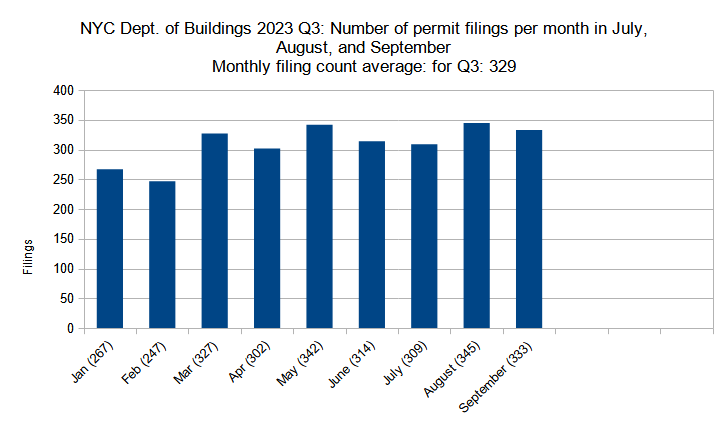
Number of new construction permits filed per month in New York City in Q1 through Q3 (January through September) 2023. Data source: the Department of Buildings. Data aggregation and graphics credit: Vitali Ogorodnikov
The third quarter of 2023 saw a continuation of the gradual upward trend observed for monthly construction filing totals over the course of the year. Q3 registered an average of 329 permits per month, slightly outpacing Q2’s average of 319 monthly permits and setting a new record for any quarterly average since YIMBY began keeping count in 2020. Likewise, with a total of 345 construction filings, August set a new monthly record for the period.
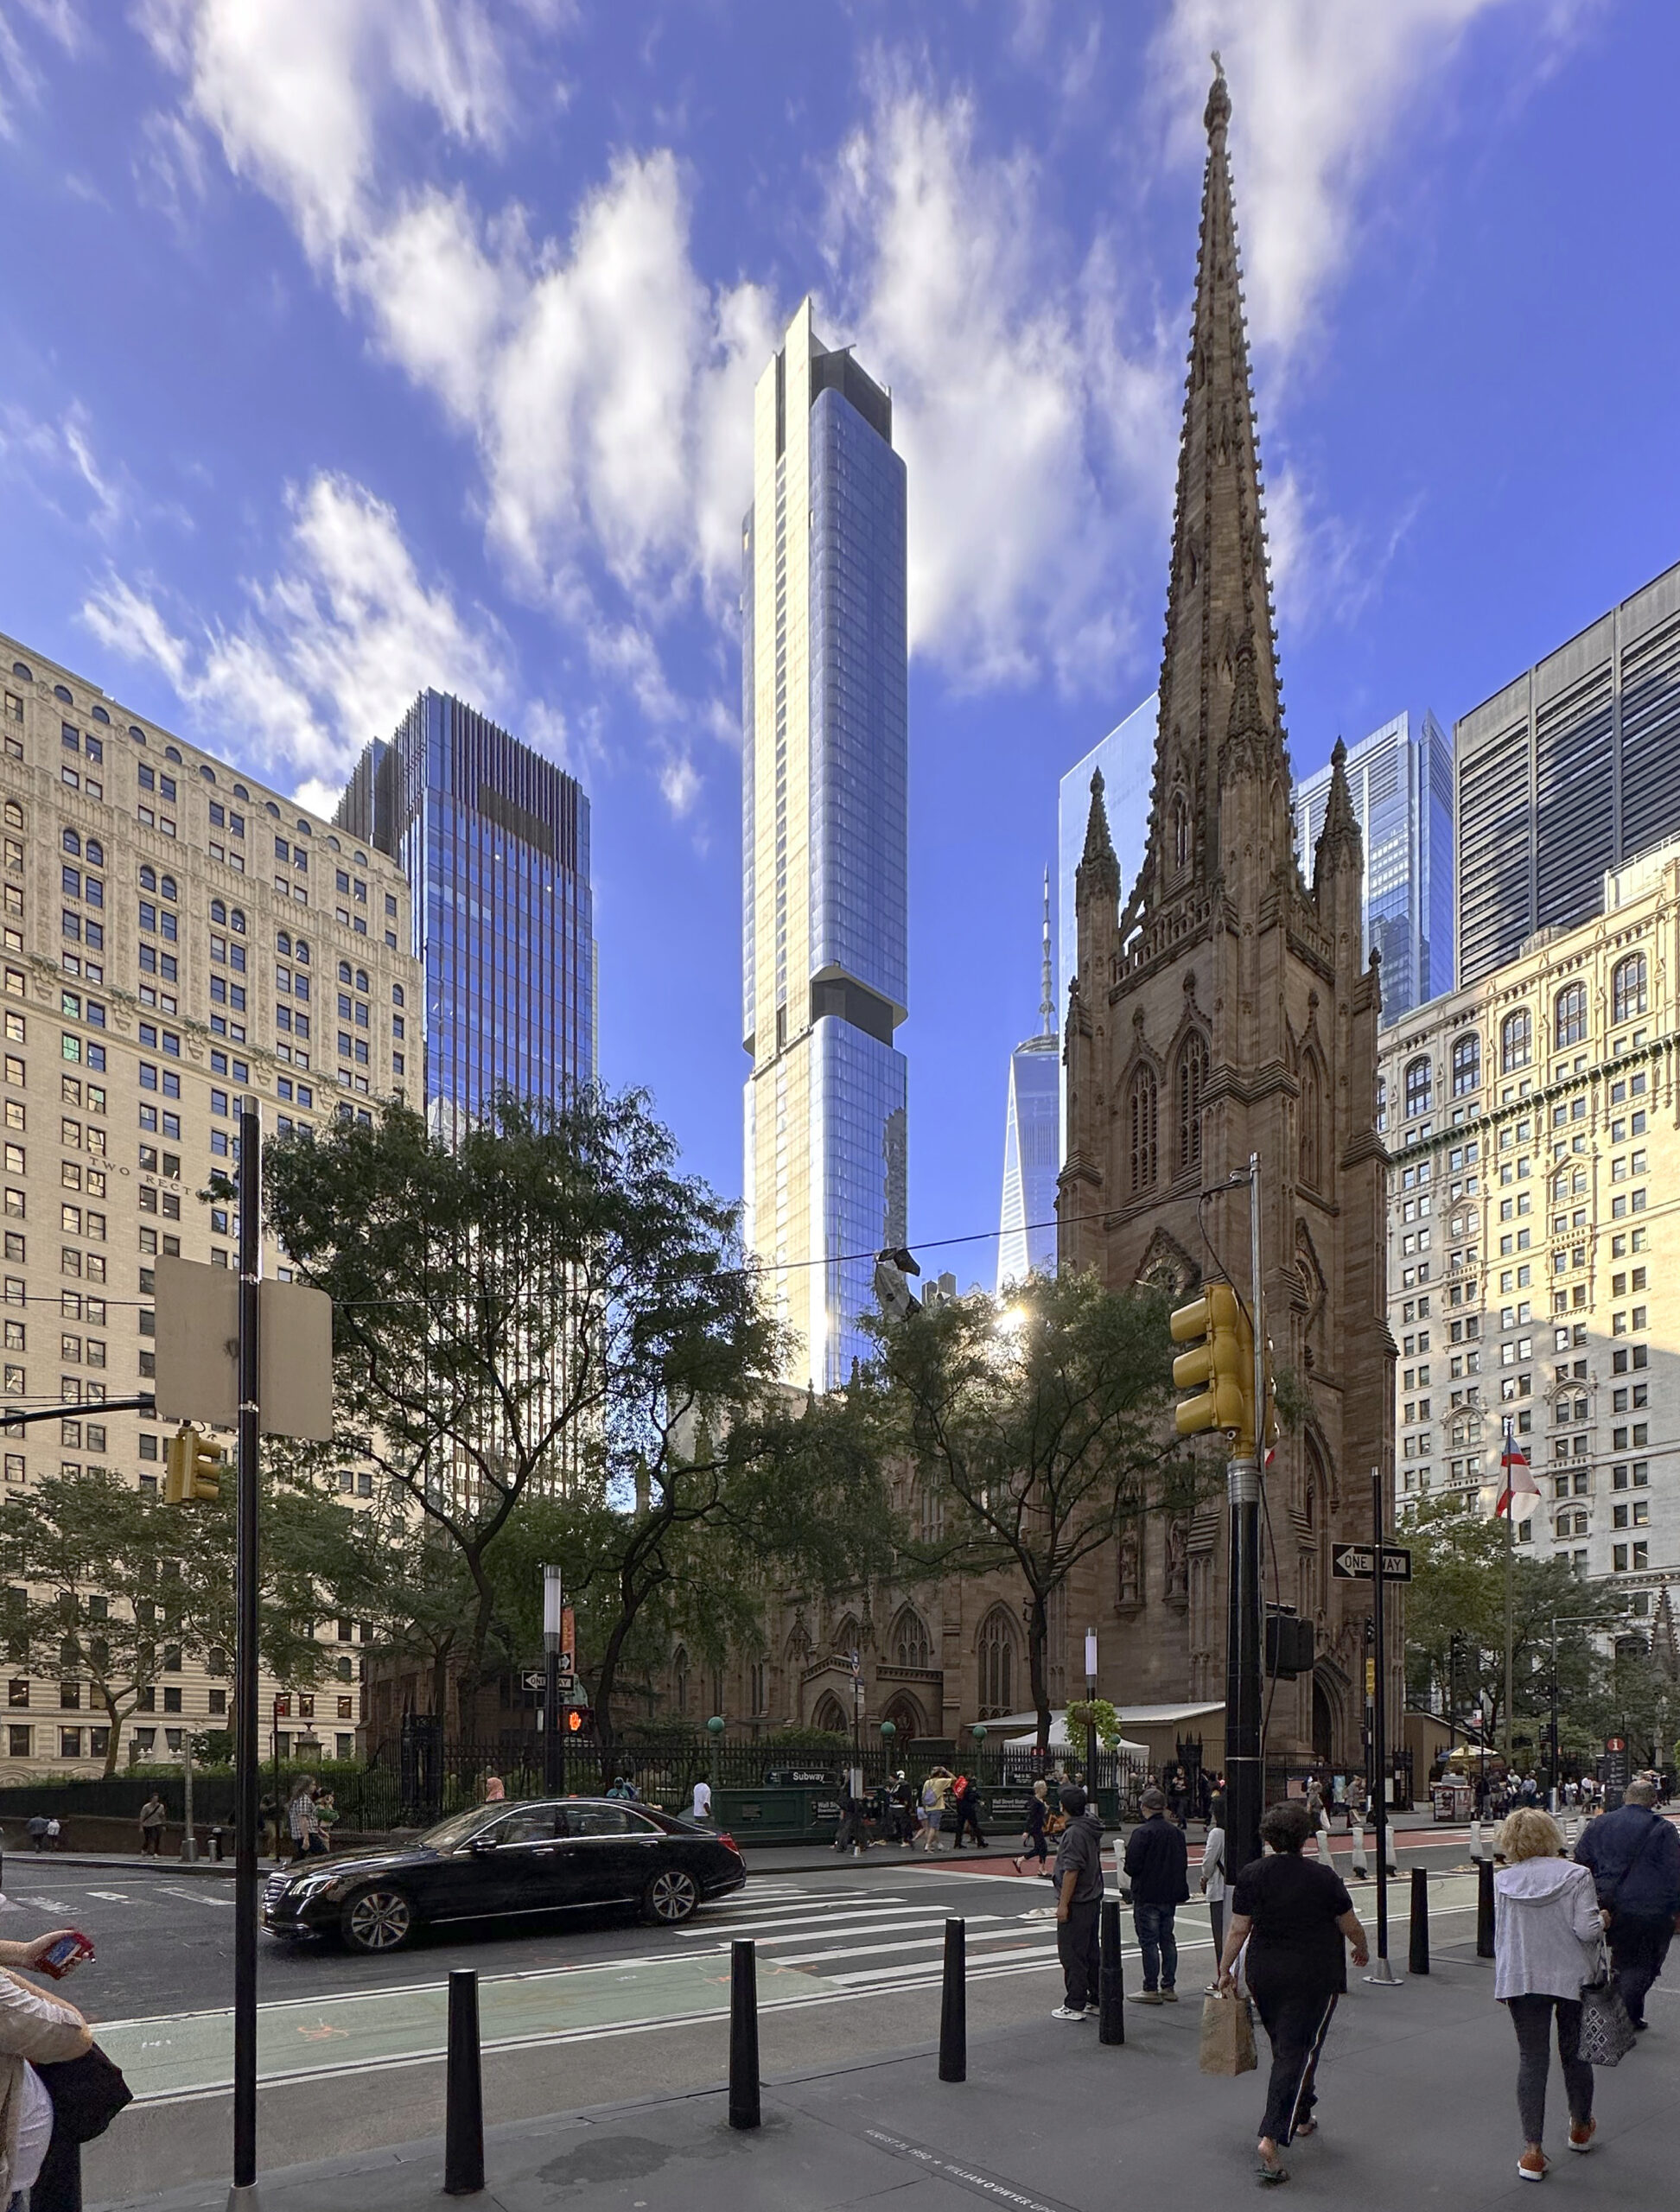
Photo by Michael Young
Number of permit filings by borough
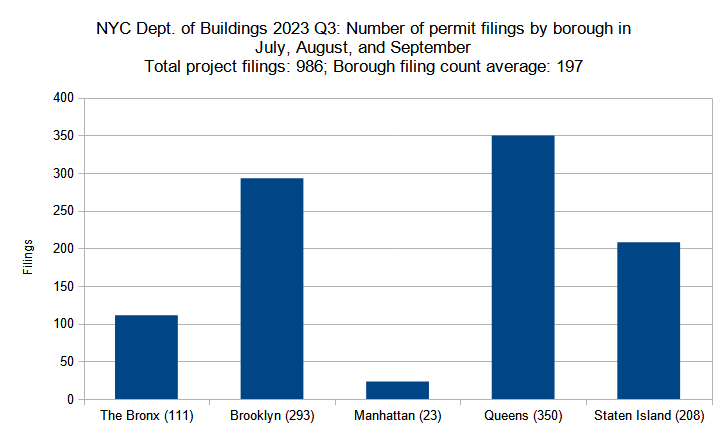
Number of new construction permits filed per borough in New York City in Q3 (July through September) 2023. Data source: the Department of Buildings. Data aggregation and graphics credit: Vitali Ogorodnikov
The third quarter of 2023 tallied a total of 986 construction filings, slightly exceeding the previous quarterly total of 956. The overall trend has remained consistent, with higher-density boroughs like Manhattan and The Bronx giving rise to fewer but larger-scale filings than those of their lower-density counterparts. Below is the breakdown of borough statistic changes between the year’s second and third quarters:
- The Bronx – 3-percent increase (108 to 111 permits)
- Brooklyn – 2-percent increase (287 to 293)
- Manhattan – 23-percent decrease (30 to 23)
- Queens – 7-percent increase (327 to 350)
- Staten Island – 1-percent decrease (205 to 208)
During the third quarter, the number of construction permit filings remained generally consistent for The Bronx, Brooklyn, and Staten Island, each registering only minor fluctuations. The greatest growth was observed in Queens, which increased its permit count by 7 percent. The greatest drop-off took place in Manhattan, which saw a 23-percent decrease in the total number of filed construction permits.

Photo by Michael Young
Permits listed by unit count per filing
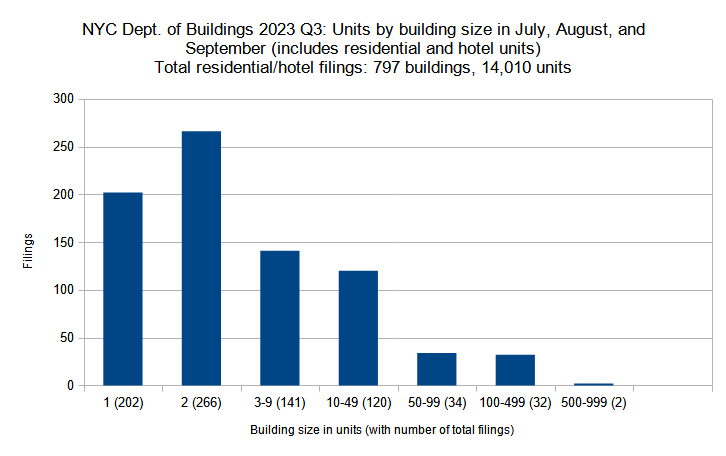
New residential and hotel construction permits filed in New York City in Q3 (July through September) 2023 grouped by unit count per filling. Data source: the Department of Buildings. Data aggregation and graphics credit: Vitali Ogorodnikov
New York City saw 60 more filings for residential and hotel construction projects, up from 737 in Q2 to 797 in Q3. On the other hand, the total number of filed-for residential and hotel units saw a modest drop from 16,202 in the second quarter down to 14,010 units in the third. As the numbers above suggest, Q3 saw a shift toward slightly smaller unit counts per residential/hotel filing. Below, the filing size categories are compared between the two quarters individually:
- Single-family – 20-percent increase (168 to 202 units)
- Two-family – 7-percent increase (249 to 266)
- Three to nine units – 5-percent increase (134 to 141)
- Ten to 49 units – 3-percent increase (117 to 120)
- 50 to 99 units – 13-percent increase (30 to 34)
- 100 to 499 units – 11-percent decrease (36 to 32)
- 500 to 599 units – 33-percent decrease (3 to 2)
The greatest increase, both in terms of percentage and absolute numbers, took place among single-family construction filings which, with a 34-filing increase, grew by 20 percent. Every subsequent category, however, saw a gradually smaller relative increase (with the category with filings counting 50 to 99 units breaking the trend), and gradually larger decreases in the two categories with 100 and more units.
Photo by Michael Young
Residential and hotel units filed per borough
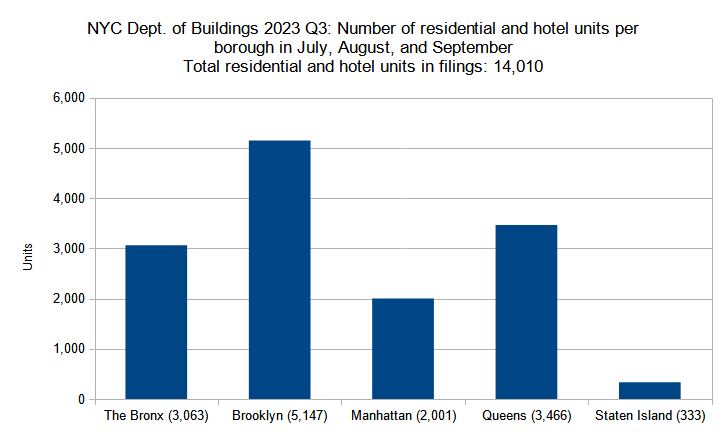
Number of residential and hotel units in new construction permits filed per borough in New York City in Q3 (July through September) 2023. Data source: the Department of Buildings. Data aggregation and graphics credit: Vitali Ogorodnikov
The third quarter of 2023 registered a combined total of 14,010 residential and hotel unit filings throughout New York City, a slight yet still notable 14-percent drop from the previous quarterly total of 16,202. Below is a by-borough comparison between the two quarters:
- The Bronx – 7-percent increase (2,859 to 3,063 residential and hotel units)
- Brooklyn – 23-percent decrease (6,672 to 5,147)
- Manhattan – 22-percent decrease (2,552 to 2,001)
- Queens – 7-percent increase (3,236 to 3,466)
- Staten Island – 61-percent decrease (851 to 333)
This dip may be attributed to significant decreases for three boroughs (Brooklyn, Manhattan, and Staten Island), which saw their totals shrink by 23, 22, and 61 percent, respectively, with Brooklyn displaying the largest cumulative decrease of around 1,500 units. In turn, The Bronx and Queens each saw 7-percent gains in their totals.
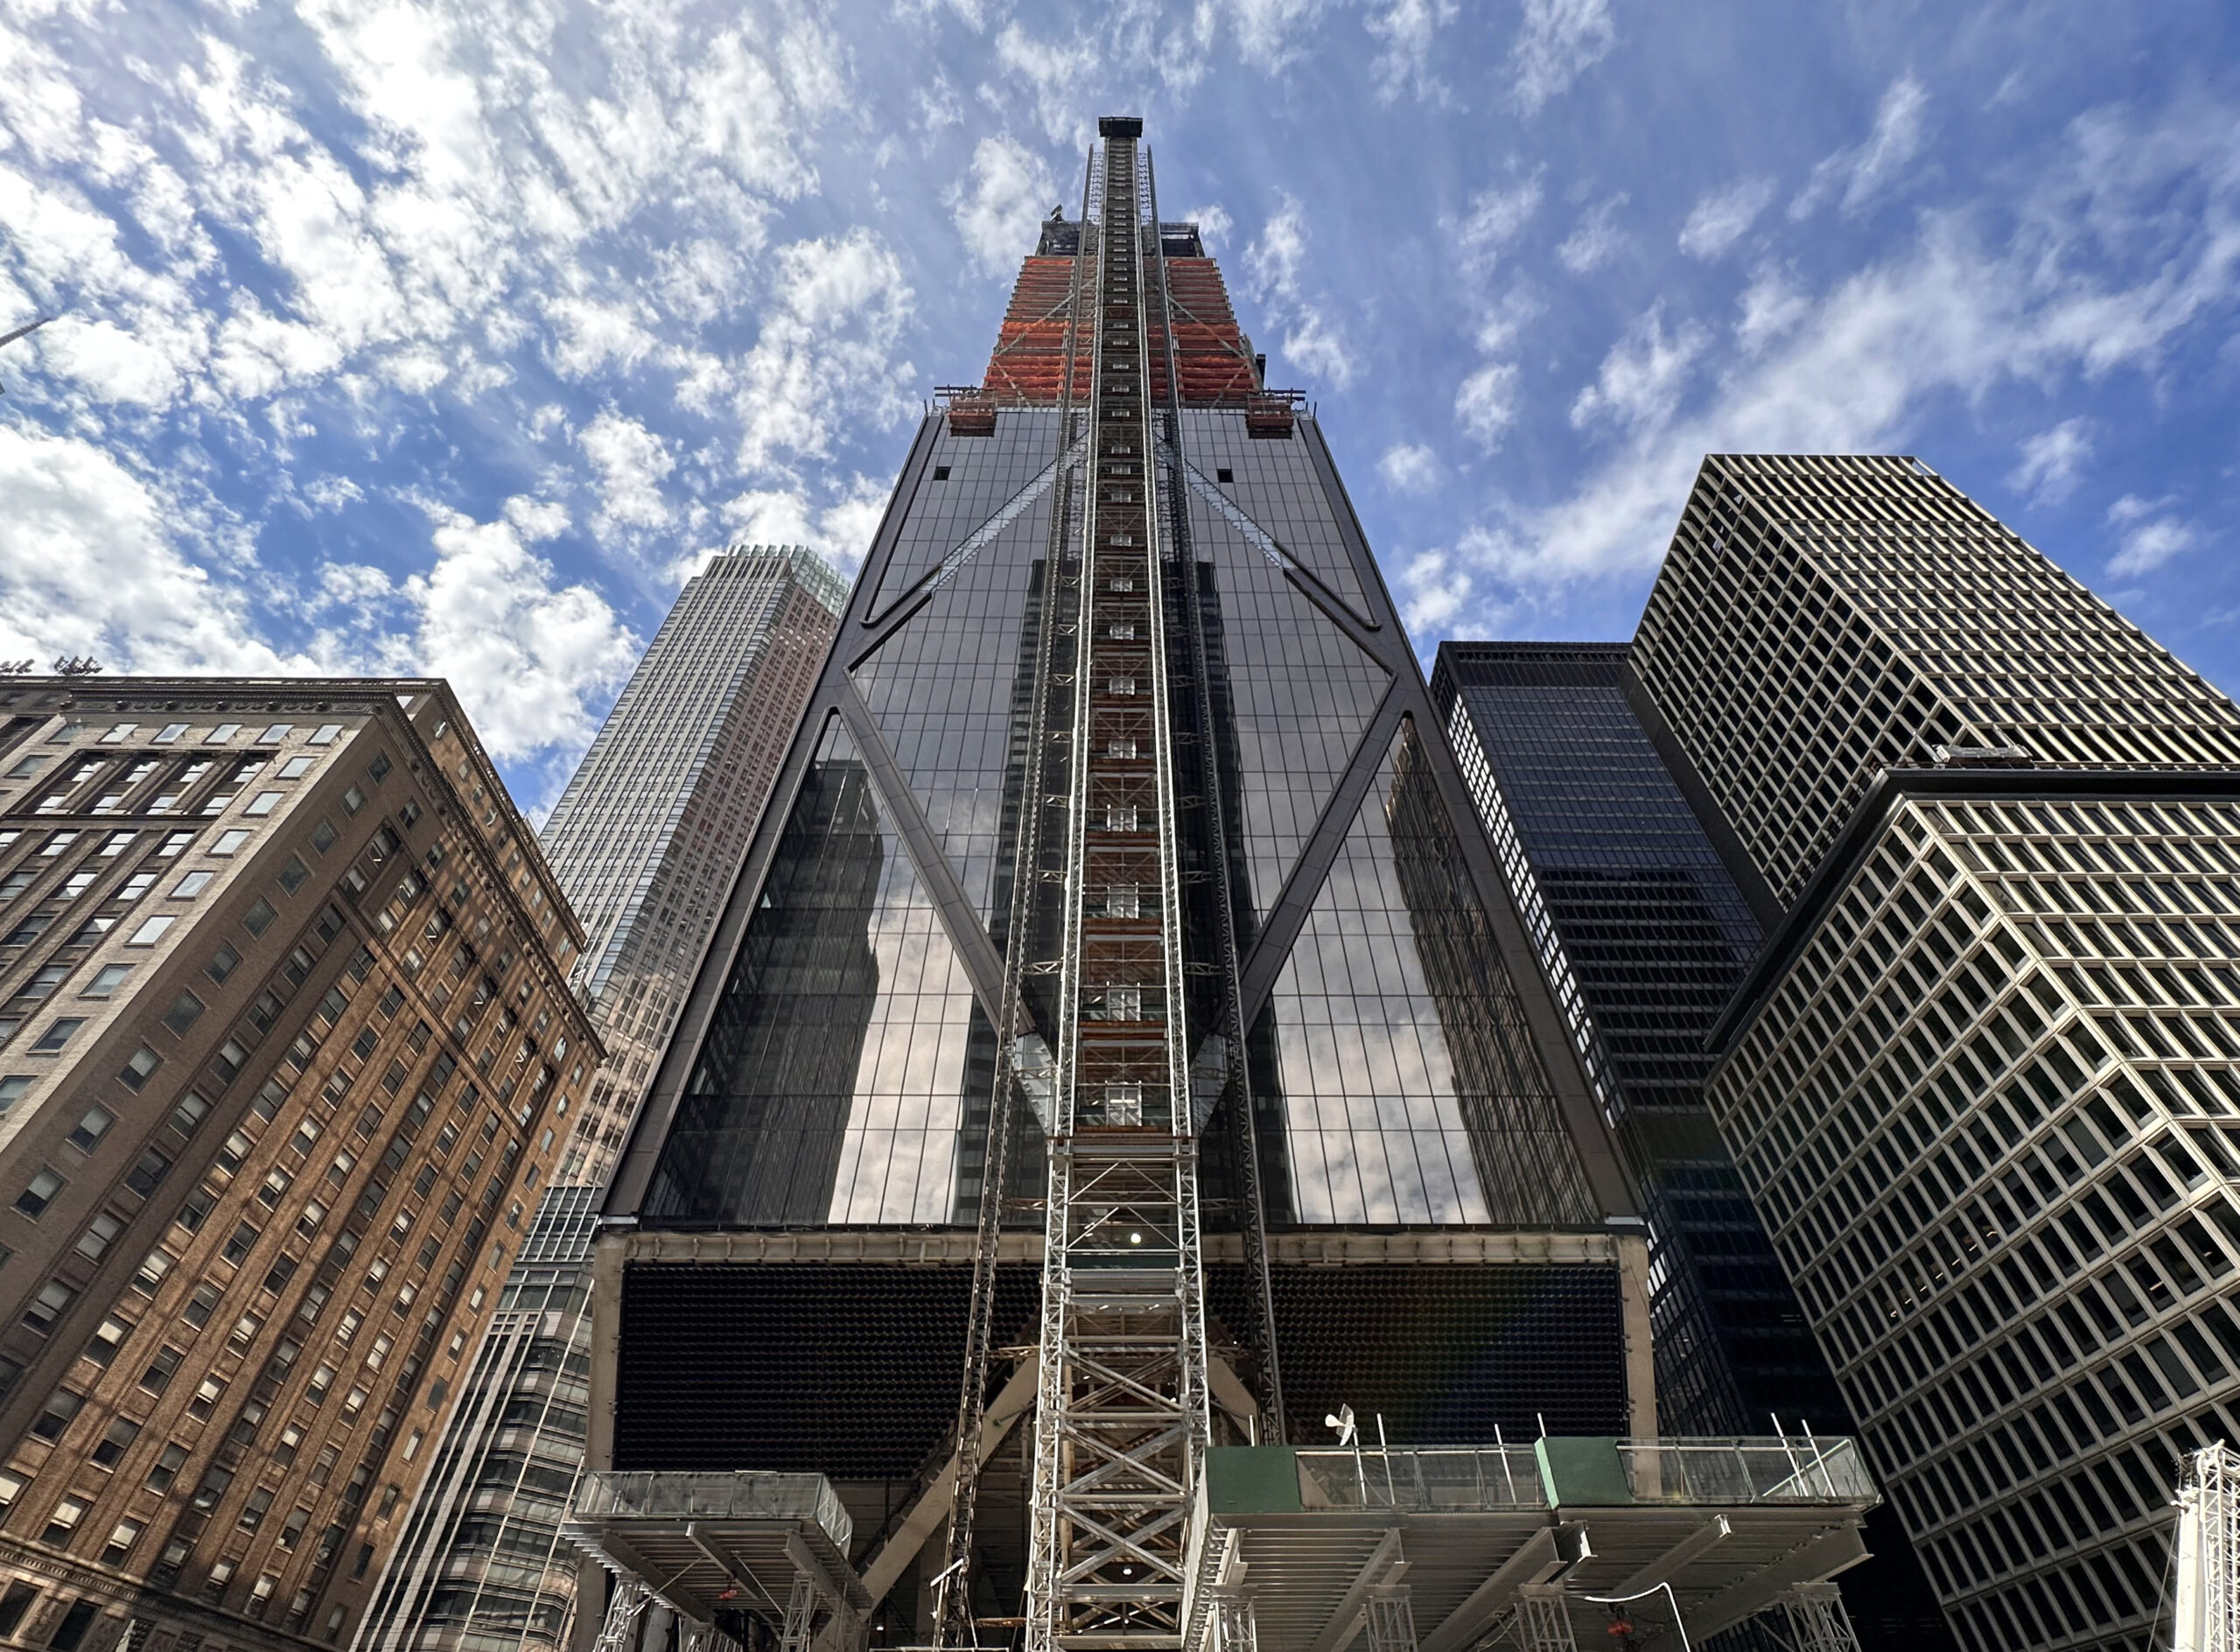
Photo by Michael Young
Permits listed by average unit count per filing
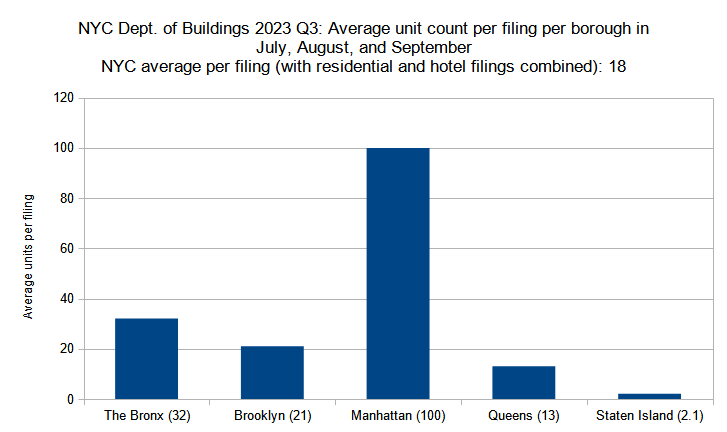
Average unit count (residential and hotel) per new construction permit per borough filed in New York City in Q3 (July through September) 2023. Data source: the Department of Buildings. Data aggregation and graphics credit: Vitali Ogorodnikov
Continuing a long-established trend, the size of new developments is by far the largest in Manhattan, which is zoned for the city’s highest densities. During the third quarter of 2023, the size of the average residential and hotel permit filing shrank slightly from its second-quarter average, lowering from 22 to 18 average units per residential or hotel permit. Below is a by-borough breakdown:
- The Bronx – 3-percent increase (31 to 32 residential and hotel units)
- Brooklyn – 25-percent decrease (28 to 21)
- Manhattan – 22-percent decrease (129 to 100)
- Queens – 7-percent decrease (14 to 13)
- Staten Island – 62-percent decrease (5.5 to 2.1)
Of the five boroughs, only The Bronx saw a slight (3-percent) increase in its average unit count per filing. The rest saw decreases of between 7 and 62 percent. In the third quarter, Manhattan barely managed to maintain its triple-digit unit count average, while a relative lack of large apartment building filings in Staten Island has bumped the borough’s average down to the size of a two-family dwelling.

Photo by Michael Young
Permit filings by floor count category
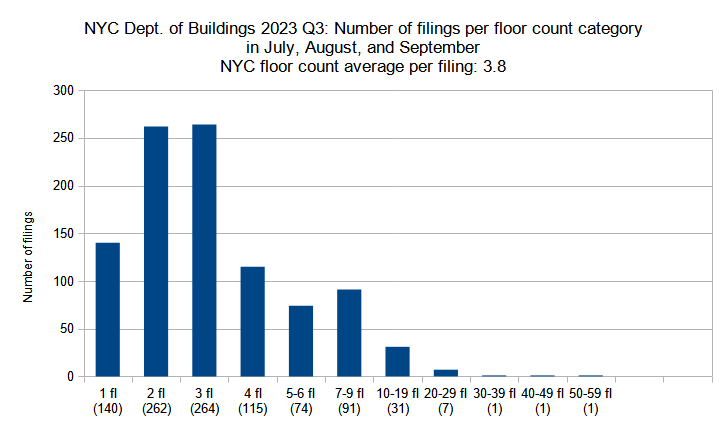
New construction permits filed in New York City in Q3 (June through September) 2023 grouped by floor count. Data source: the Department of Buildings. Data aggregation and graphics credit: Vitali Ogorodnikov
In Q3, the average floor count of 3.8 stories per permit filing remained on pace with the second quarter, and the overall trend remained generally consistent, as well. Below is a comparison per floor-count category between the two quarters:
- One-story – 12-percent decrease (160 to 140 permits)
- Two-story – 15-percent increase (228 to 262)
- Three-story – 8-percent increase (245 to 264)
- Four-story – 18-percent decrease (140 to 115)
- Five to six floors – 14-percent increase (65 to 74)
- Seven to nine floors- 14-percent increase (80 to 91)
- Ten to 19 floors – 19-percent increase (26 to 31)
- 20 to 29 floors – 36-percent decrease (11 to 7)
- 30 to 39 floors – no change (one permit in each quarter)
- 50 to 49 floors – no change
- 50 to 59 floors – no change
Compared to the second quarter, Q3 saw fewer filings in almost every low-rise category (four stories and below) yet tallied significant increases for mid- and low high-rise categories (five to 19 floors), with the highest jump, tallying 36 percent, observed among permit filings for proposals ranging from ten to 19 floors. Permit counts remained consistent for the three high–rise categories, with each quarter registering one permit in the 30-39, 40-49, and 50-59-story category.
The third quarter showed the most robust permit activity among high-rise proposals in Midtown Manhattan, where three of the top five permits with the highest floor counts are located. Below are the top five permit filings, in order:
- 1710 Broadway in Midtown Manhattan (54 floors)
- 201 West 54th Street in Midtown Manhattan (40 floors)
- 255 East 77th Street on the Upper East Side in Manhattan (33 floors)
- Rolex Headquarters at 665 5th Avenue in Midtown Manhattan (28 floors)
- 570 Fulton Street in Downtown Brooklyn (23 floors)
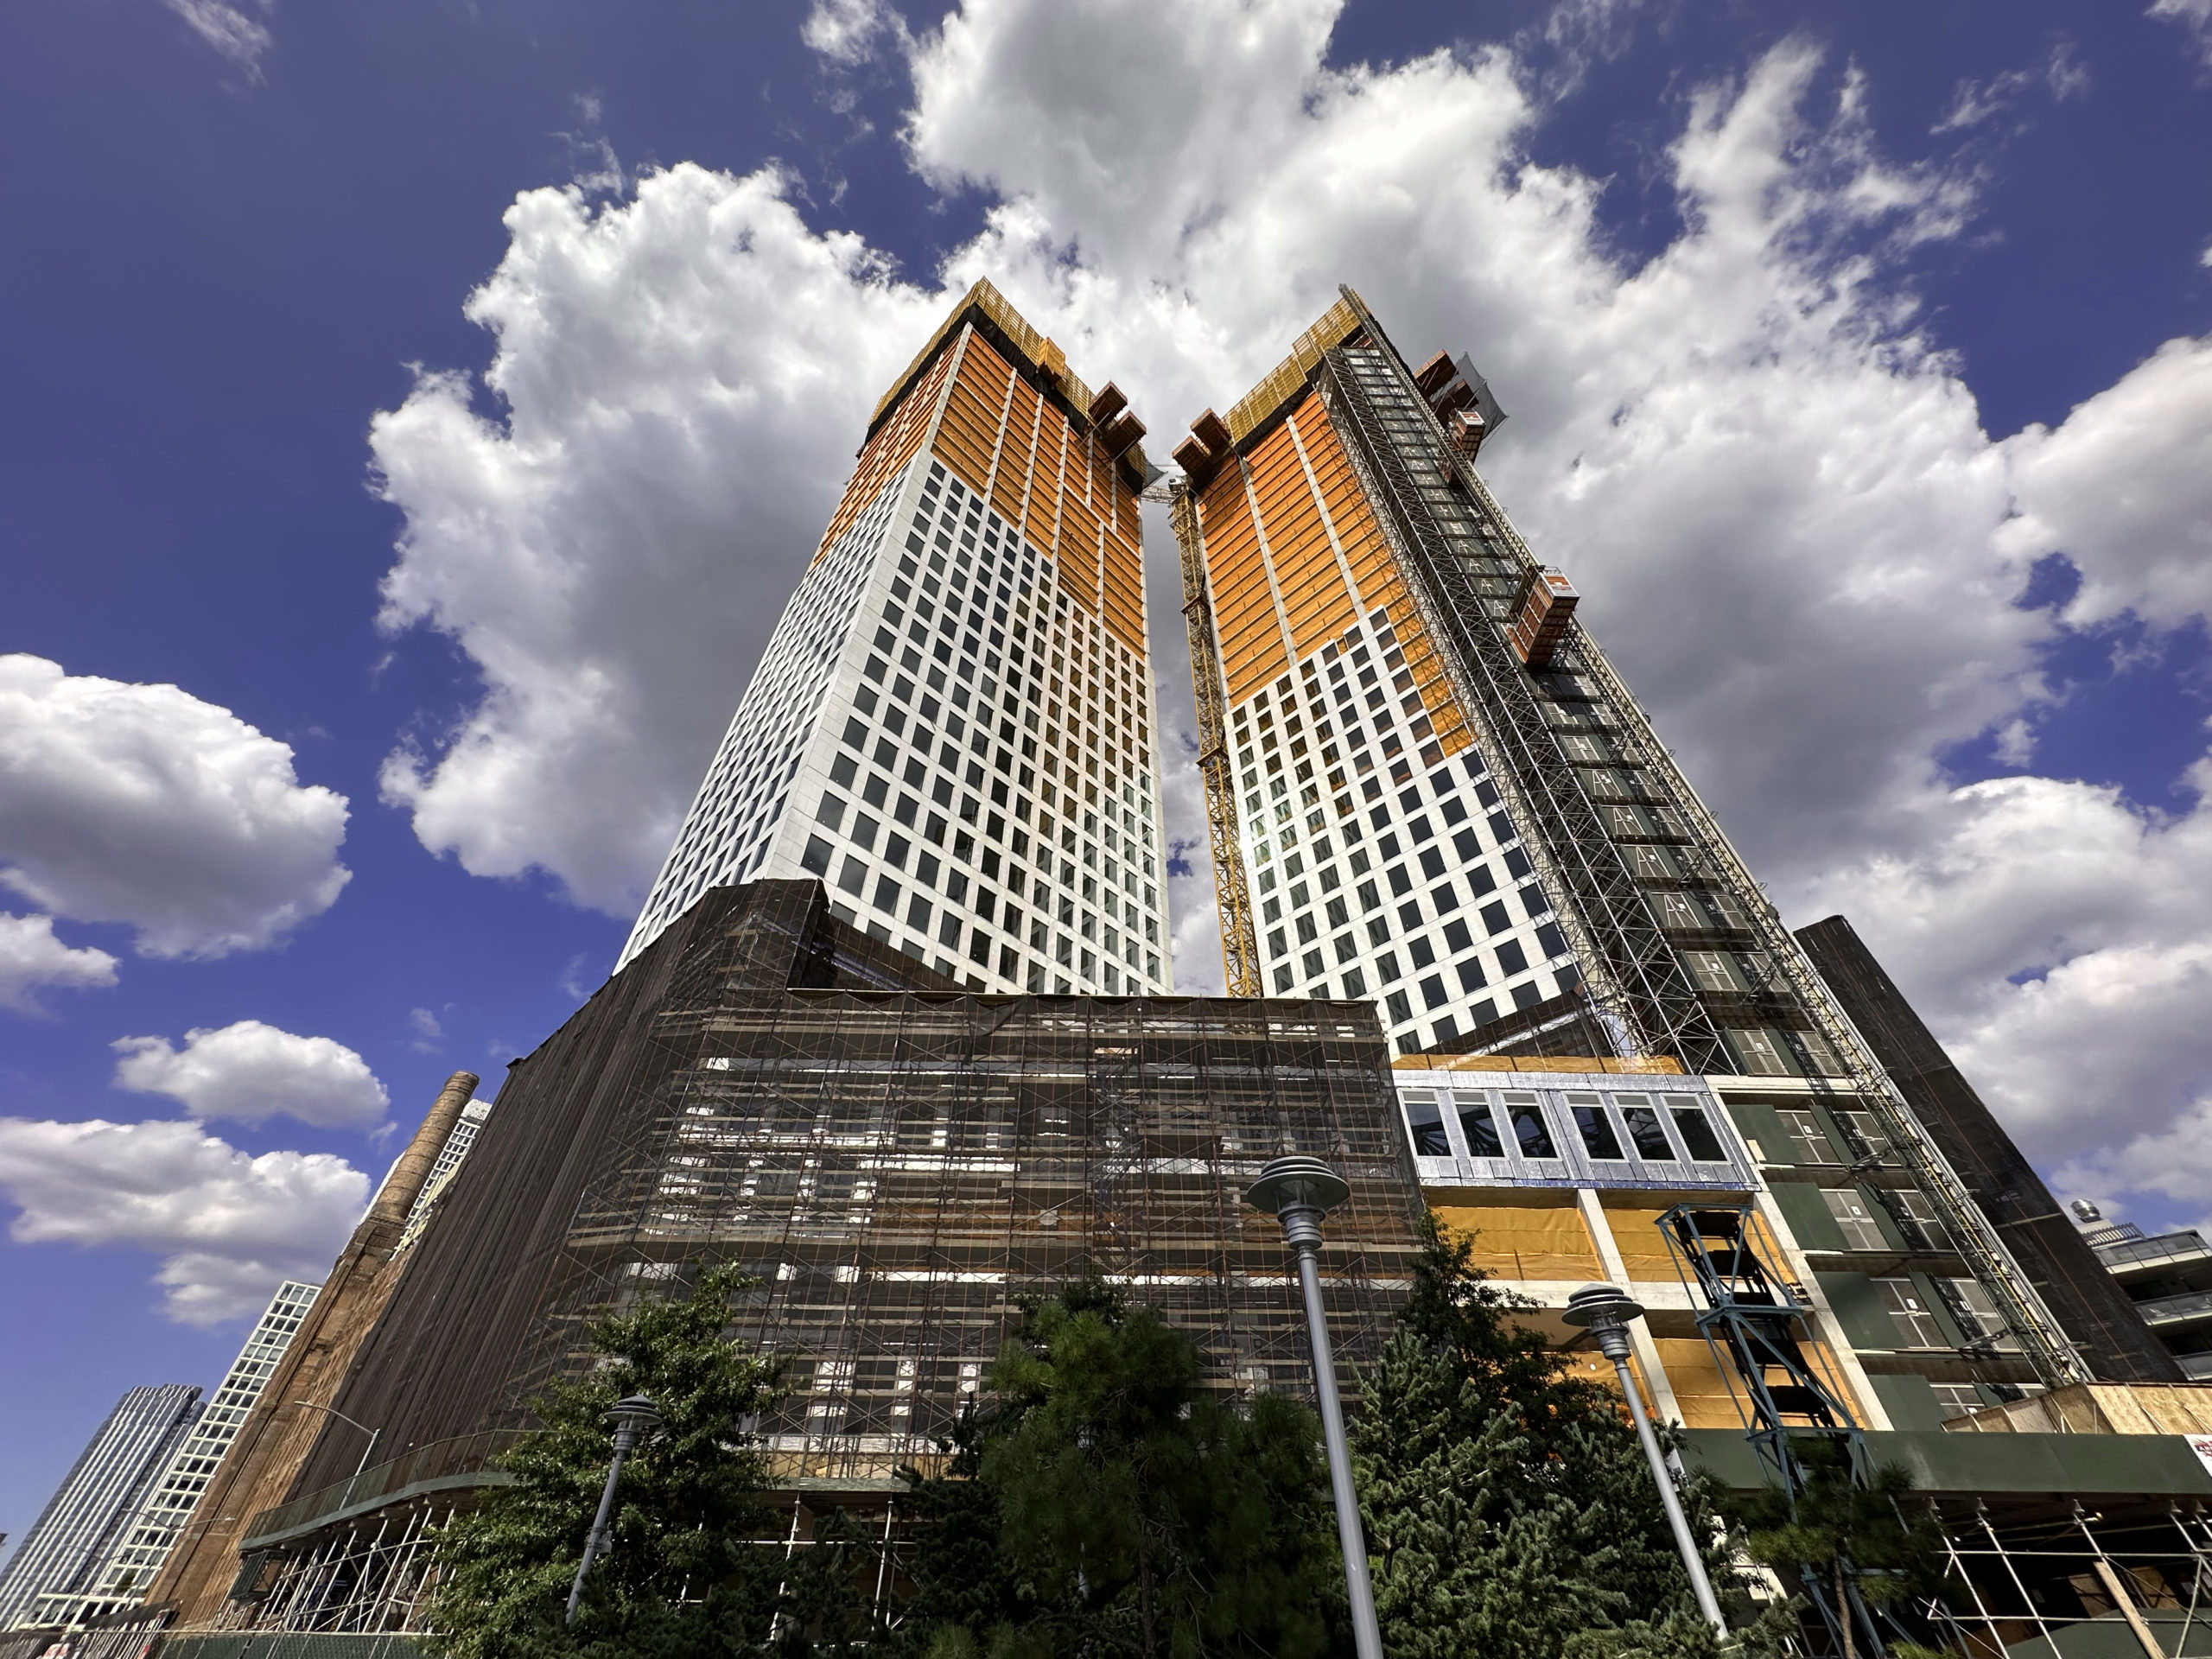
Photo by Michael Young
Average number of floors per filing per borough
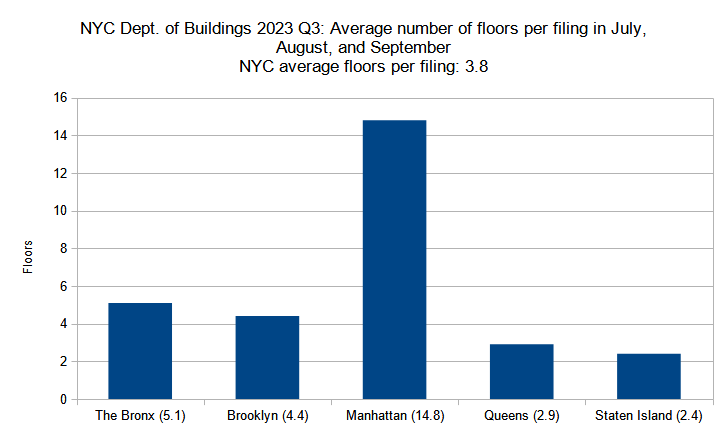
Average number of floors per new construction permit per borough filed in New York City in Q3 (July through September) 2023. Data source: the Department of Buildings. Data aggregation and graphics credit: Vitali Ogorodnikov
Construction permit filings had the highest number of floors in Manhattan, with the slightly less-dense boroughs of The Bronx, Brooklyn, and Queens following well behind and sprawling Staten Island maintaining its suburban scale. Below is the by-borough comparison between the two quarters:
- The Bronx – 6-percent increase (4.8 to 5.1 floors)
- Brooklyn – 8-percent decrease (4.8 to 4.4)
- Manhattan – 36-percent increase (10.9 to 14.8)
- Queens – 7-percent increase (2.7 to 2.9)
- Staten Island – no change (2.4 floors in each quarter)
The average floor count rose dramatically in Manhattan, adding around four floors per permit filing between the second and third quarters. After tying for second place in the previous quarter with an average of 4.8 floors per filing, in the third quarter The Bronx and Brooklyn diverged prominently, with the former’s average gaining 0.3 floors and the latter losing 0.4 floors. Queens notched up a slight gain of 0.2 stories and Staten Island has remained consistent.
The following are the permit filings in each borough with the highest floor counts:
- The Bronx – 1010 Washington Avenue in Morrisania (16 floors)
- Brooklyn – 570 Fulton Street in Downtown Brooklyn (23 floors)
- Manhattan – 1710 Broadway in Midtown Manhattan (54 floors)
- Queens – 95-25 Waltham Street in Jamaica (16 floors)
- Staten Island – 5 Stuyvesant Place in St. George (seven floors)

Photo by Michael Young
Permits listed by floor area per filing
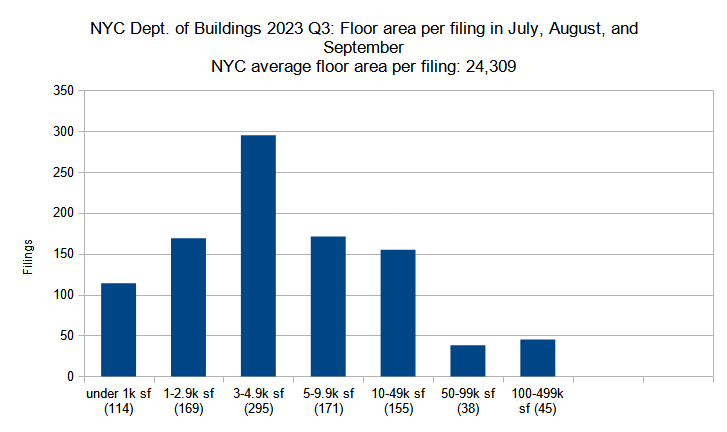
New construction permits filed in New York City in Q3 (July through September) 2023 grouped by total floor area. Data source: the Department of Buildings. Data aggregation and graphics credit: Vitali Ogorodnikov
Compared to the second quarter of 2023, the average floor area per construction filing in the third quarter shrunk from 24,309 to 18,549 square feet, though the category spanning from 3,000 to 5,000 square feet remains by far the largest. Below is a breakdown by floor area category:
- Under 1,000 square feet – 23-percent decrease (148 to 114 permits)
- 1,000 to 2,999 sf – 18-percent increase (143 to 169)
- 3,000 to 4,999 sf – 13-percent increase (260 to 295)
- 5,000 to 9,999 sf – 1-percent decrease (174 to 171)
- 10,000 to 49,999 sf – 12-percent increase (138 to 155)
- 50,000 to 99,999 sf -3-percent increase (37 to 38)
- 100,000 to 499,999 sf – 15-percent decrease (53 to 45)
The greatest decreases were observed in both the smallest category (under 1,000 square feet, generally reserved for garages) and the largest category (100,000 to 500,000 square feet, roughly equivalent to an apartment building with 100 to 500 or more units), dropping by 23 and 15 percent, respectively. The rest of the categories saw growth from between 3 and 18 percent, except for the category covering 5,000- to 10,000-square-foot filings, which registered a 1-percent decrease.
Notably, four of the top five third-quarter construction permit filings with the largest floor area are situated outside of Manhattan and none are located in any of the city’s central business districts. Below are the top five, in order:
- 1709 Surf Avenue in Coney Island, Brooklyn (421,740 square feet)
- 3541 Shore Front Parkway in Rockaway Beach, Queens (379,105 square feet)
- 267 Bond Street in Gowanus, Brooklyn (371,673 square feet)
- 40 Bruckner Boulevard in Mott Haven, Bronx (353,767 square feet)
- 4650 Broadway in Inwood, Manhattan (350,562 square feet)

Photo by Michael Young
Total floor area filed by borough
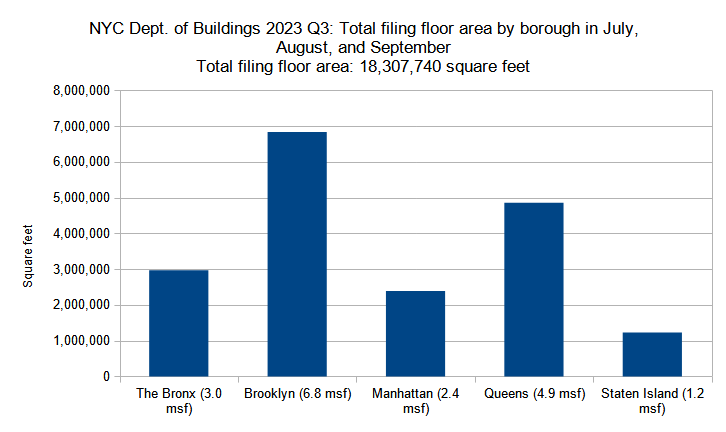
Combined floor area of new construction permits filed per borough in New York City in Q3 (July through September) 2023. Data source: the Department of Buildings. Data aggregation and graphics credit: Vitali Ogorodnikov
In the third quarter of 2023, New York City developers filed permits for a total of just over 18 million square feet. While impressive, the figure is a notable drop from the 23 million square feet filed-for in the second quarter. Below are the square footage totals per borough compared between the two quarters:
- The Bronx – 21-percent decrease (3.8 to 3.0 million square feet)
- Brooklyn – 26-percent decrease (9.2 to 6.8 msf)
- Manhattan – 19-percent decrease (3.1 to 2.5 msf)
- Queens – 17-percent decrease (5.9 to 4.9 msf)
- Staten Island – 8-percent decrease (1.3 to 1.2 msf)
In all, the trend remains nearly identical between the two quarters, with Brooklyn remaining in the lead with 6.8 million square feet, Queens holding on to a solid second place with 4.9 million square feet, The Bronx coming in third with 3 million square feet, Manhattan in fourth place with 2.5 million square feet, and Staten Island with the lowest total of 1.2 million square feet. The trend remained consistent because the total for every borough dropped by a similar margin, ranging from 7 percent in Staten Island to 26 percent in Brooklyn.
The following are the permit filings in each borough with the largest floor area:
- The Bronx – 40 Bruckner Boulevard in Mott Haven (353,767 square feet)
- Brooklyn – 1709 Surf Avenue in Coney Island (421,740 square feet)
- Manhattan – 4650 Broadway in Inwood, Manhattan (350,562 square feet)
- Queens – 3541 Shore Front Parkway in Rockaway Beach (379,105 square feet)
- Staten Island – 1 Nassau Place in Tottenville (332,009 square feet)
Photo by Michael Young
Average floor area per permit filing by borough
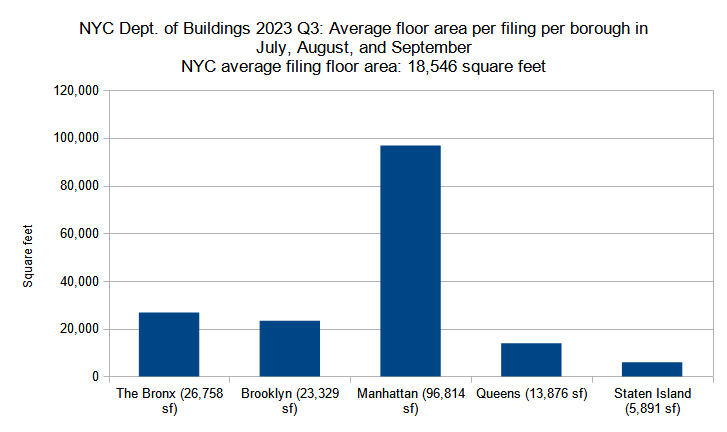
Average floor area per new construction permit per borough filed in New York City in Q3 (July through September) 2023. Data source: the Department of Buildings. Data aggregation and graphics credit: Vitali Ogorodnikov
Just as the total filed-for floor area dropped in every borough between the second and third quarters in 2023, the average square footages per permit per borough decreased concurrently. Below is the quarterly comparison for the boroughs:
- The Bronx – 23-percent decrease (34,941 to 26,758 square feet)
- Brooklyn – 28-percent decrease (32,191 to 23,329)
- Manhattan – 5-percent decrease (102,224 to 96,814)
- Queens – 23-percent decrease (17,966 to 13,876)
- Staten Island – 5-percent decrease (6,234 to 5,891)
Visually, the chart remains nearly identical between the two quarters, with Manhattan boasting by far the largest average of the group. As before, the similarity may be explained by consistency within relative average decreases in each borough, ranging from 5 percent in Manhattan and Staten Island to 28 percent in Brooklyn.
Photo by Michael Young
New York City, the nation’s premier metropolis, continues to churn out new construction at an impressive pace. The 18 million square feet filed for in the third quarter of 2023 will produce a building volume equivalent to an entire downtown area of a mid-sized American city. The fact that the quarter contains the highest monthly permit count of the 2020s further underscores the strength of the city’s construction market.
Unfortunately, even these numbers remain wholly inadequate to satisfy the city’s dire need for a greater housing supply. In order to alleviate the hardships that record-setting housing costs inflict on millions of New Yorkers, we urge the city to further upzone the most development-ready, transit-adjacent areas, continue to expand infrastructure in all forms, and to make significant investments in and expansions to mass transit, including the subway, regional rail, and ferries. New York City continues to hold enormous promise for a brighter, more equitable future for every resident, yet it will take significant work and a strong municipal will to unlock its potential.
Photo by Michael Young
Photo by Michael Young
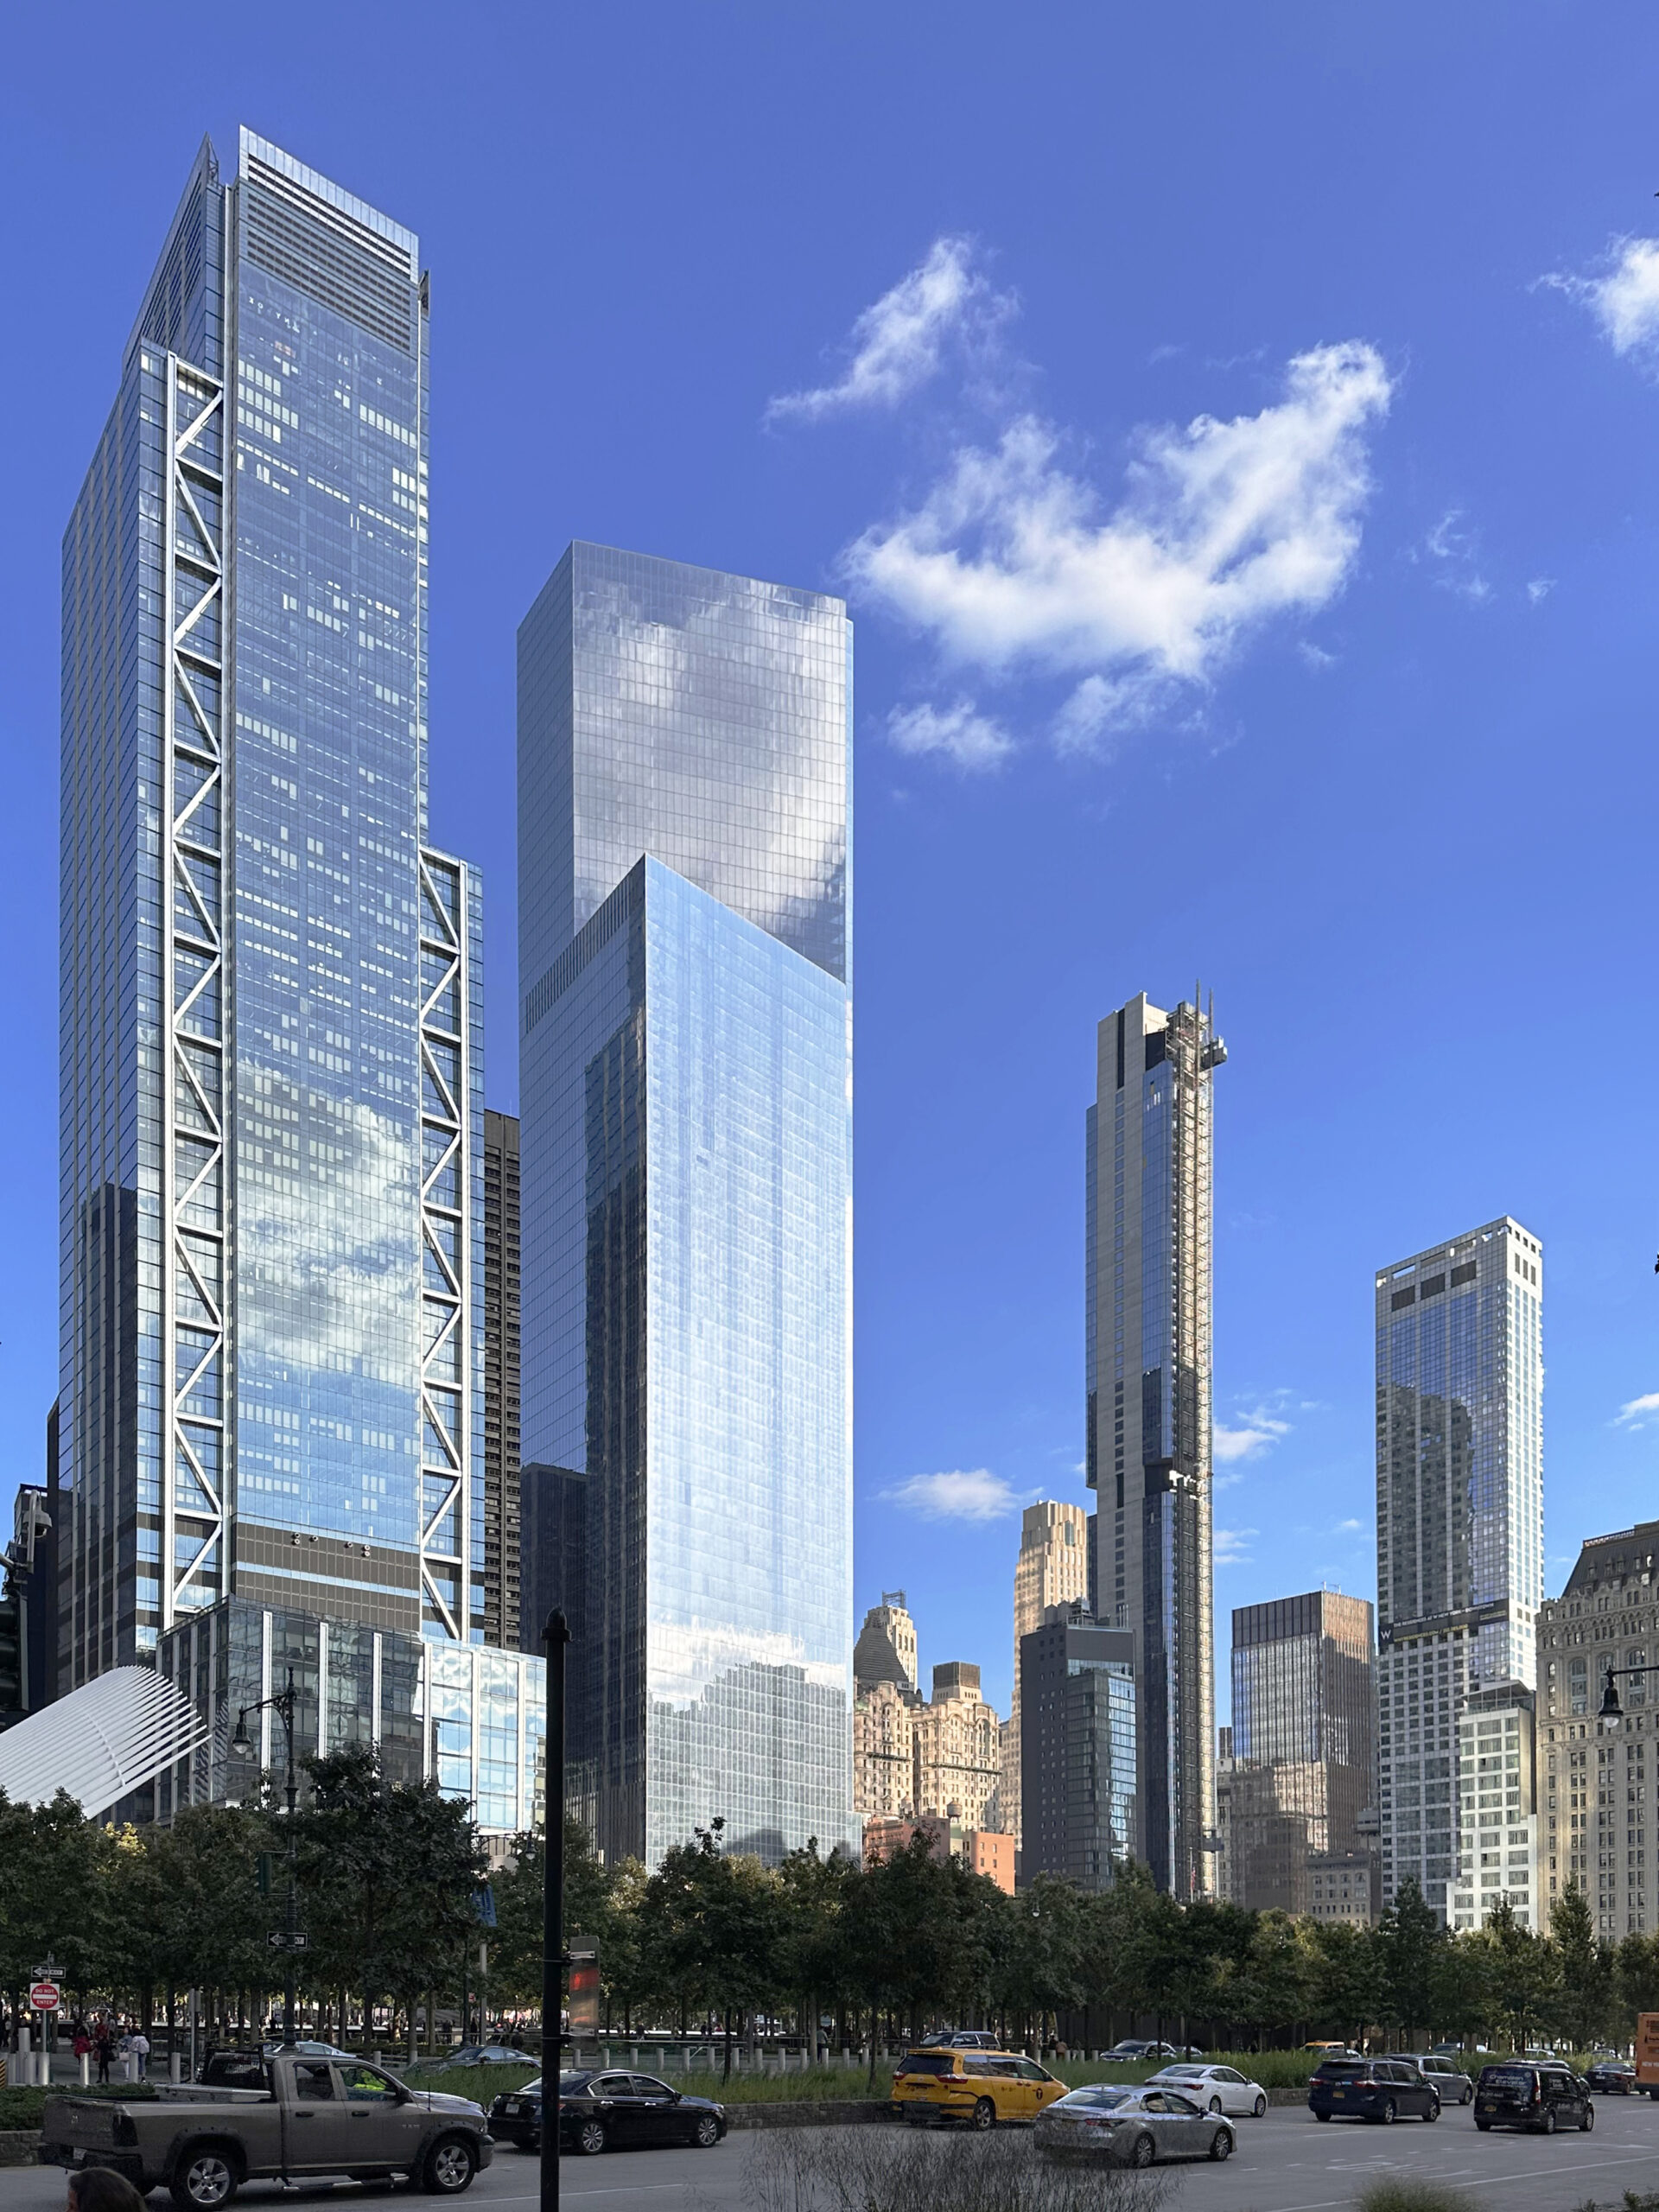
Photo by Michael Young
Photo by Michael Young
Photo by Michael Young

Photo by Michael Young
Photo by Michael Young
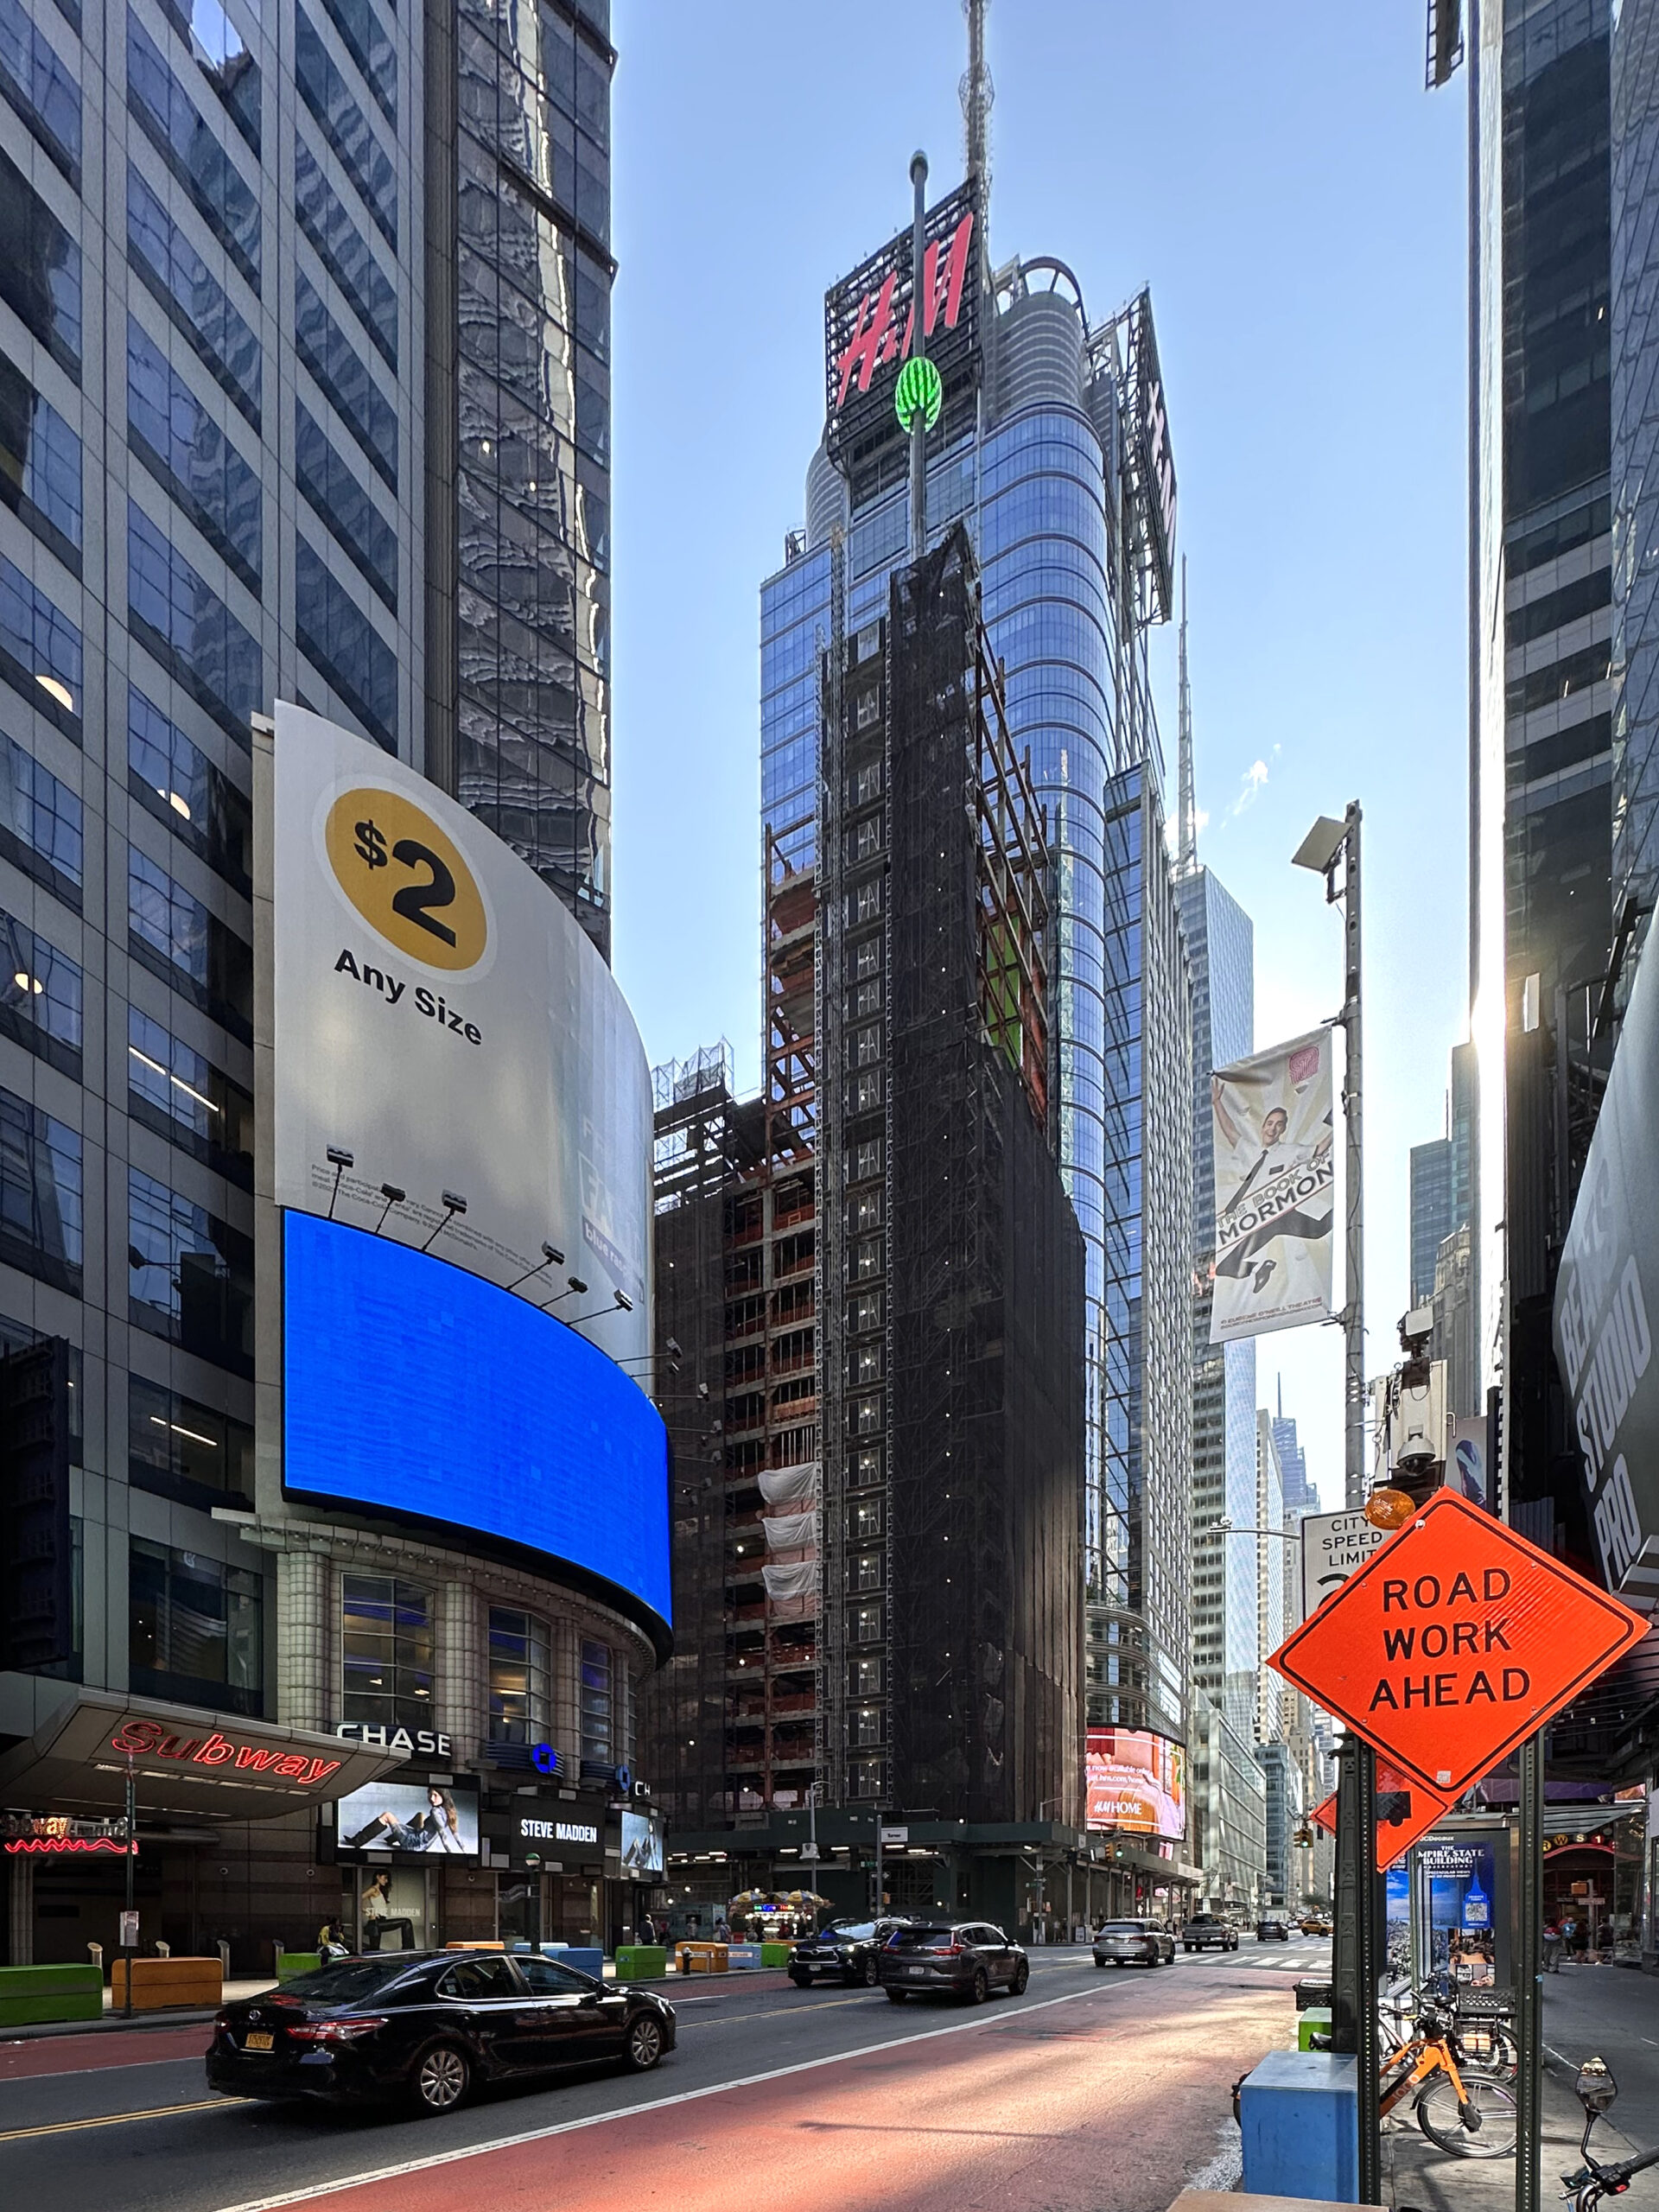
Photo by Michael Young
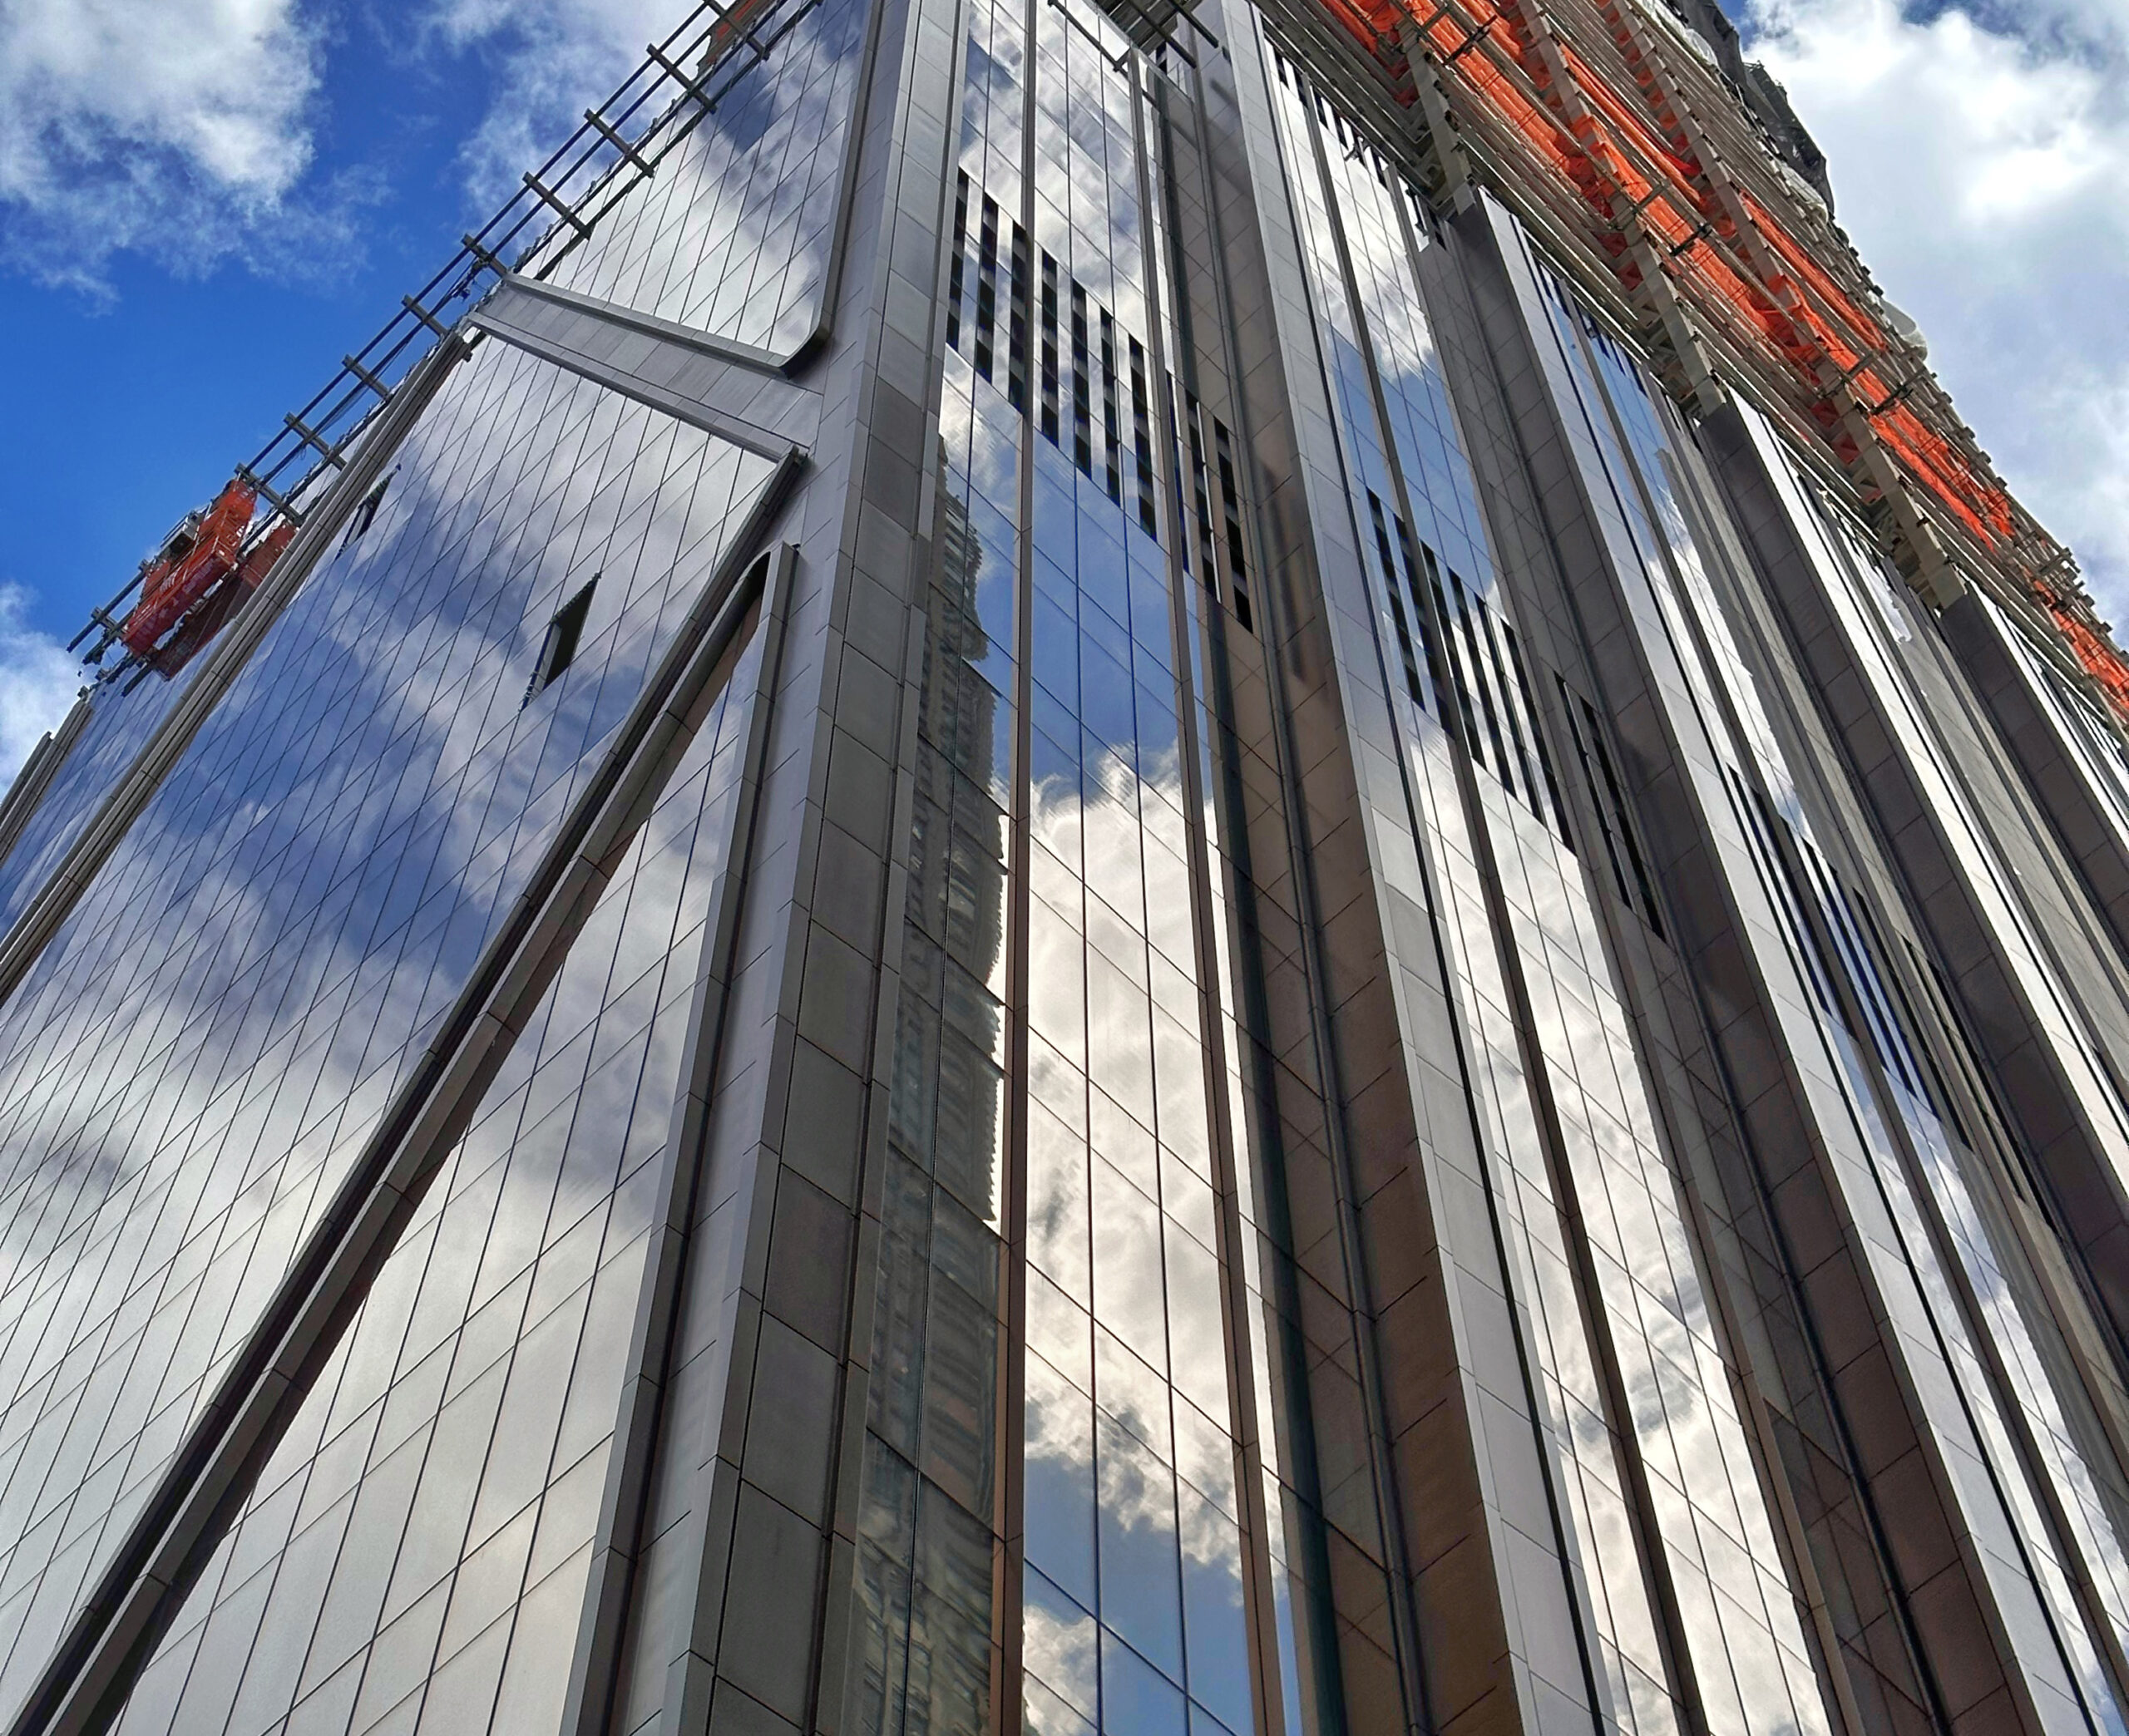
Photo by Michael Young
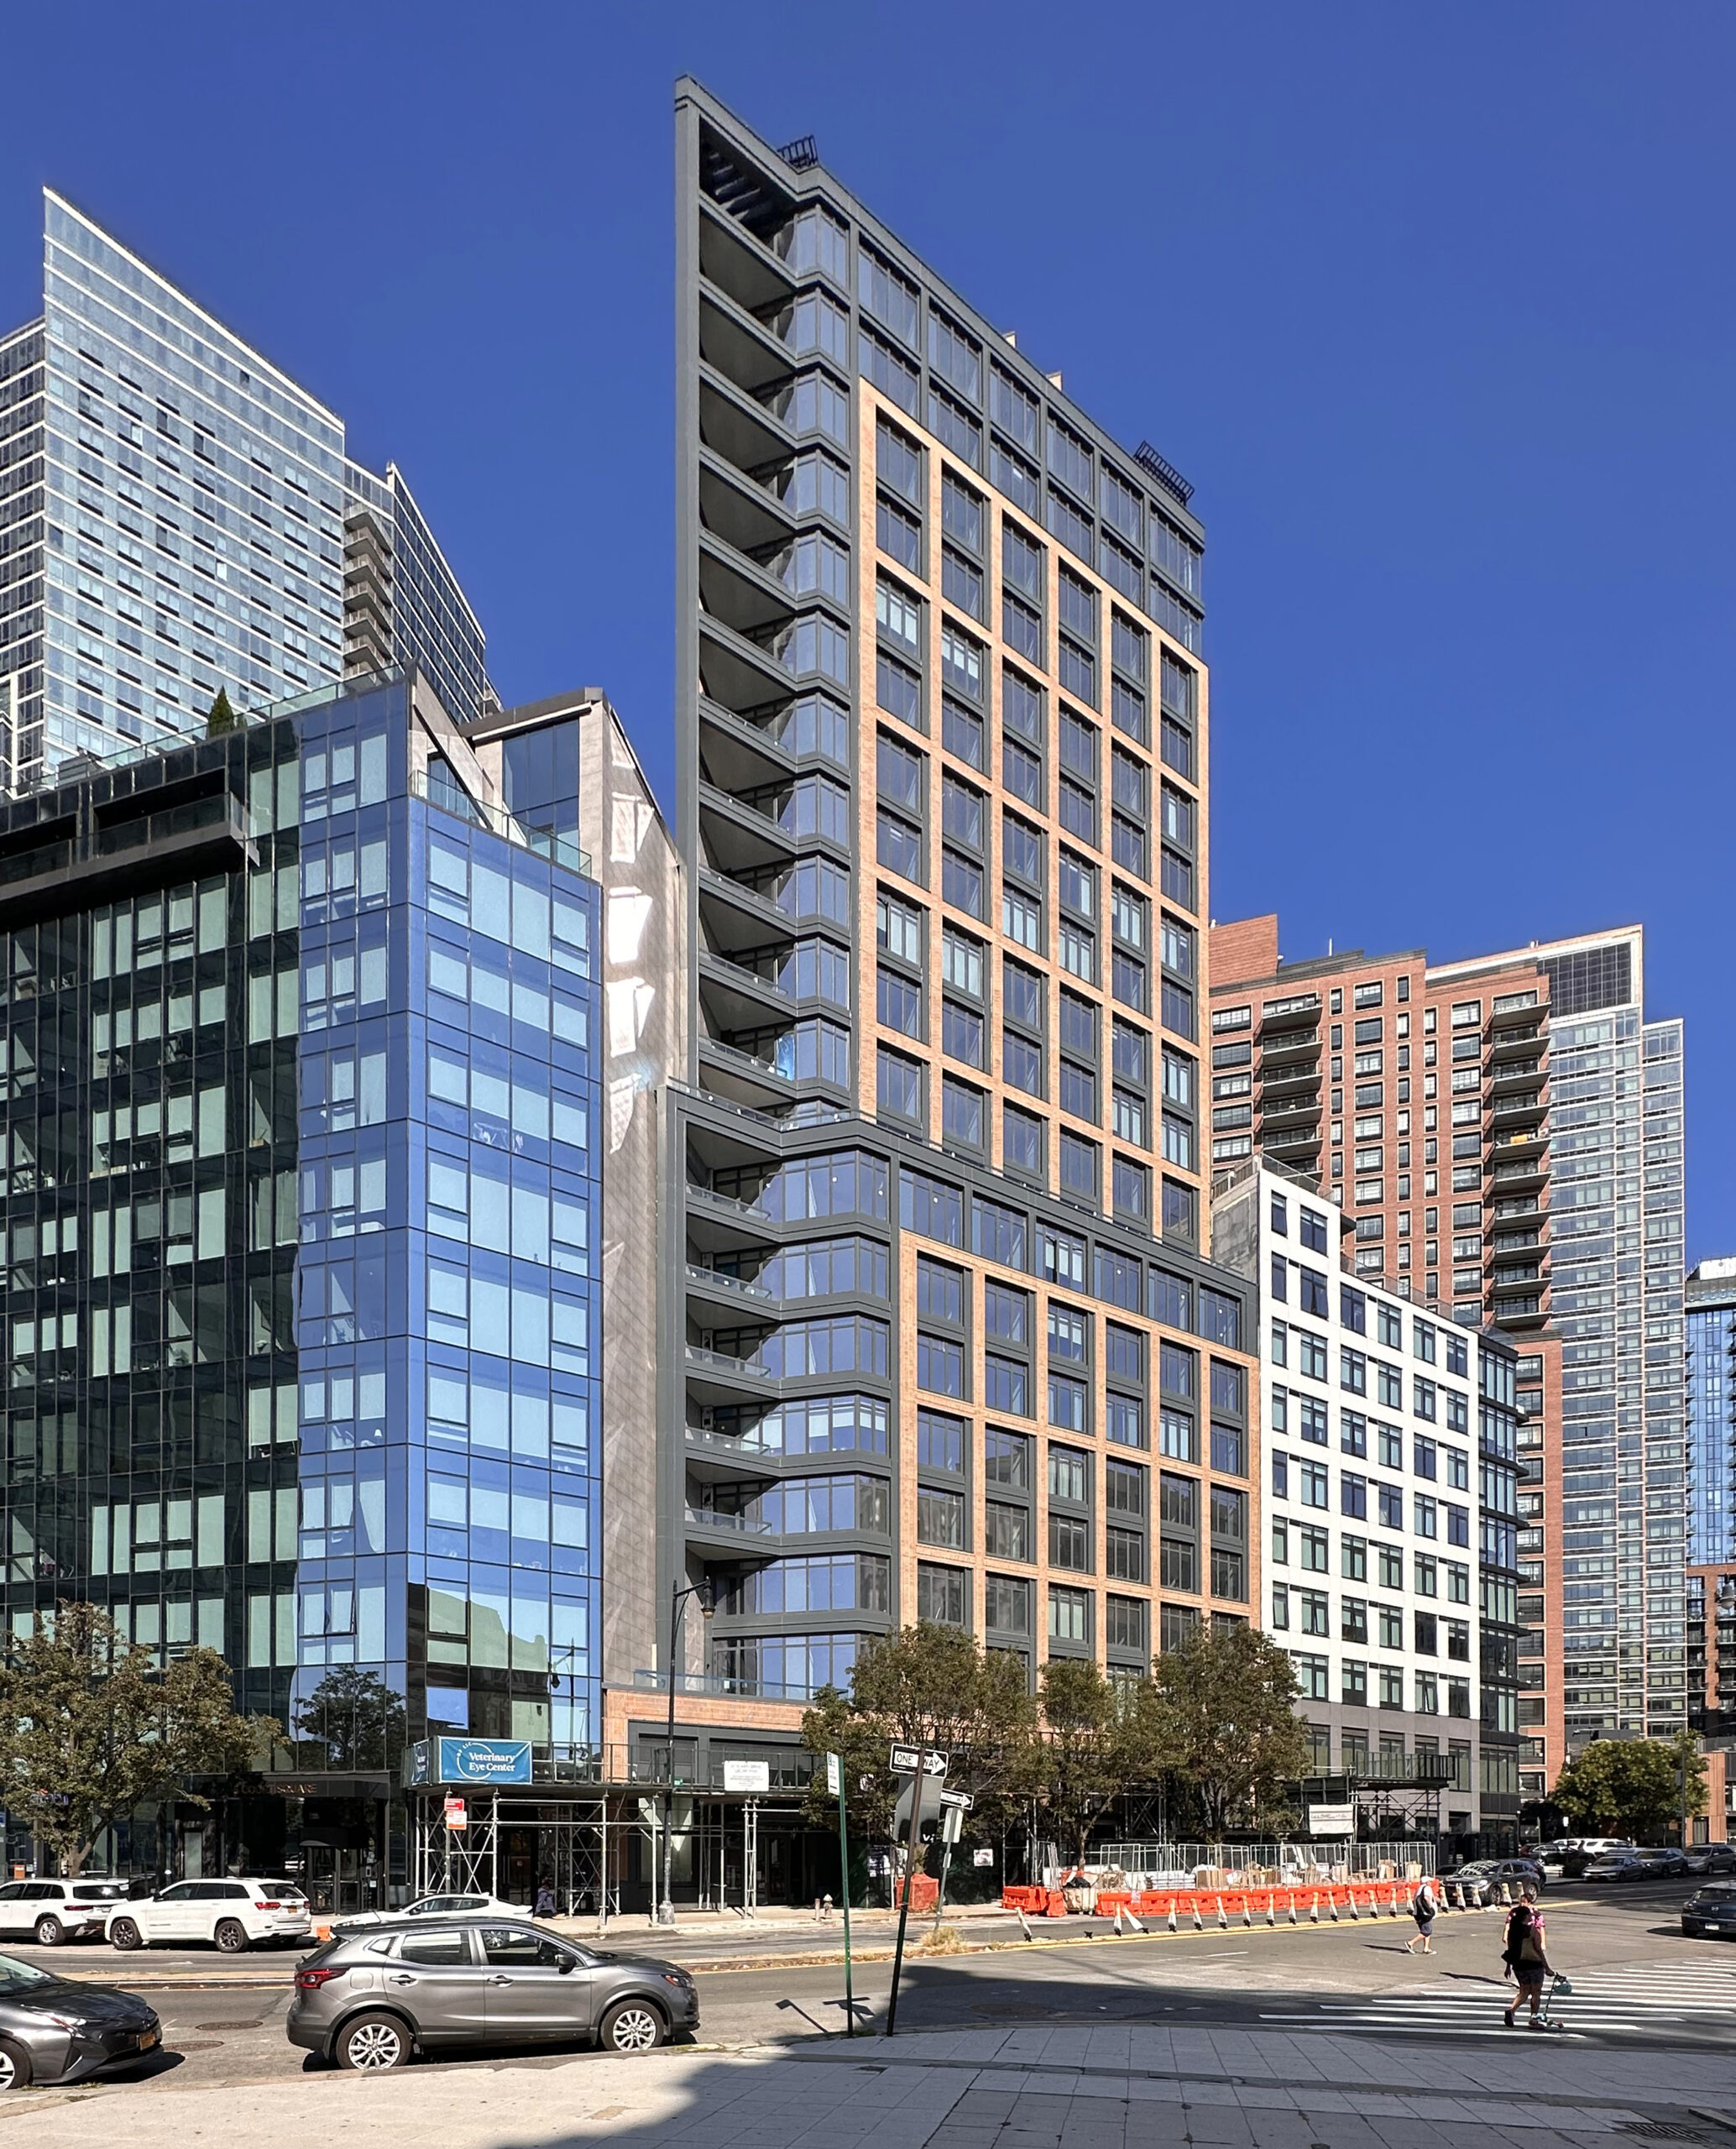
Photo by Michael Young
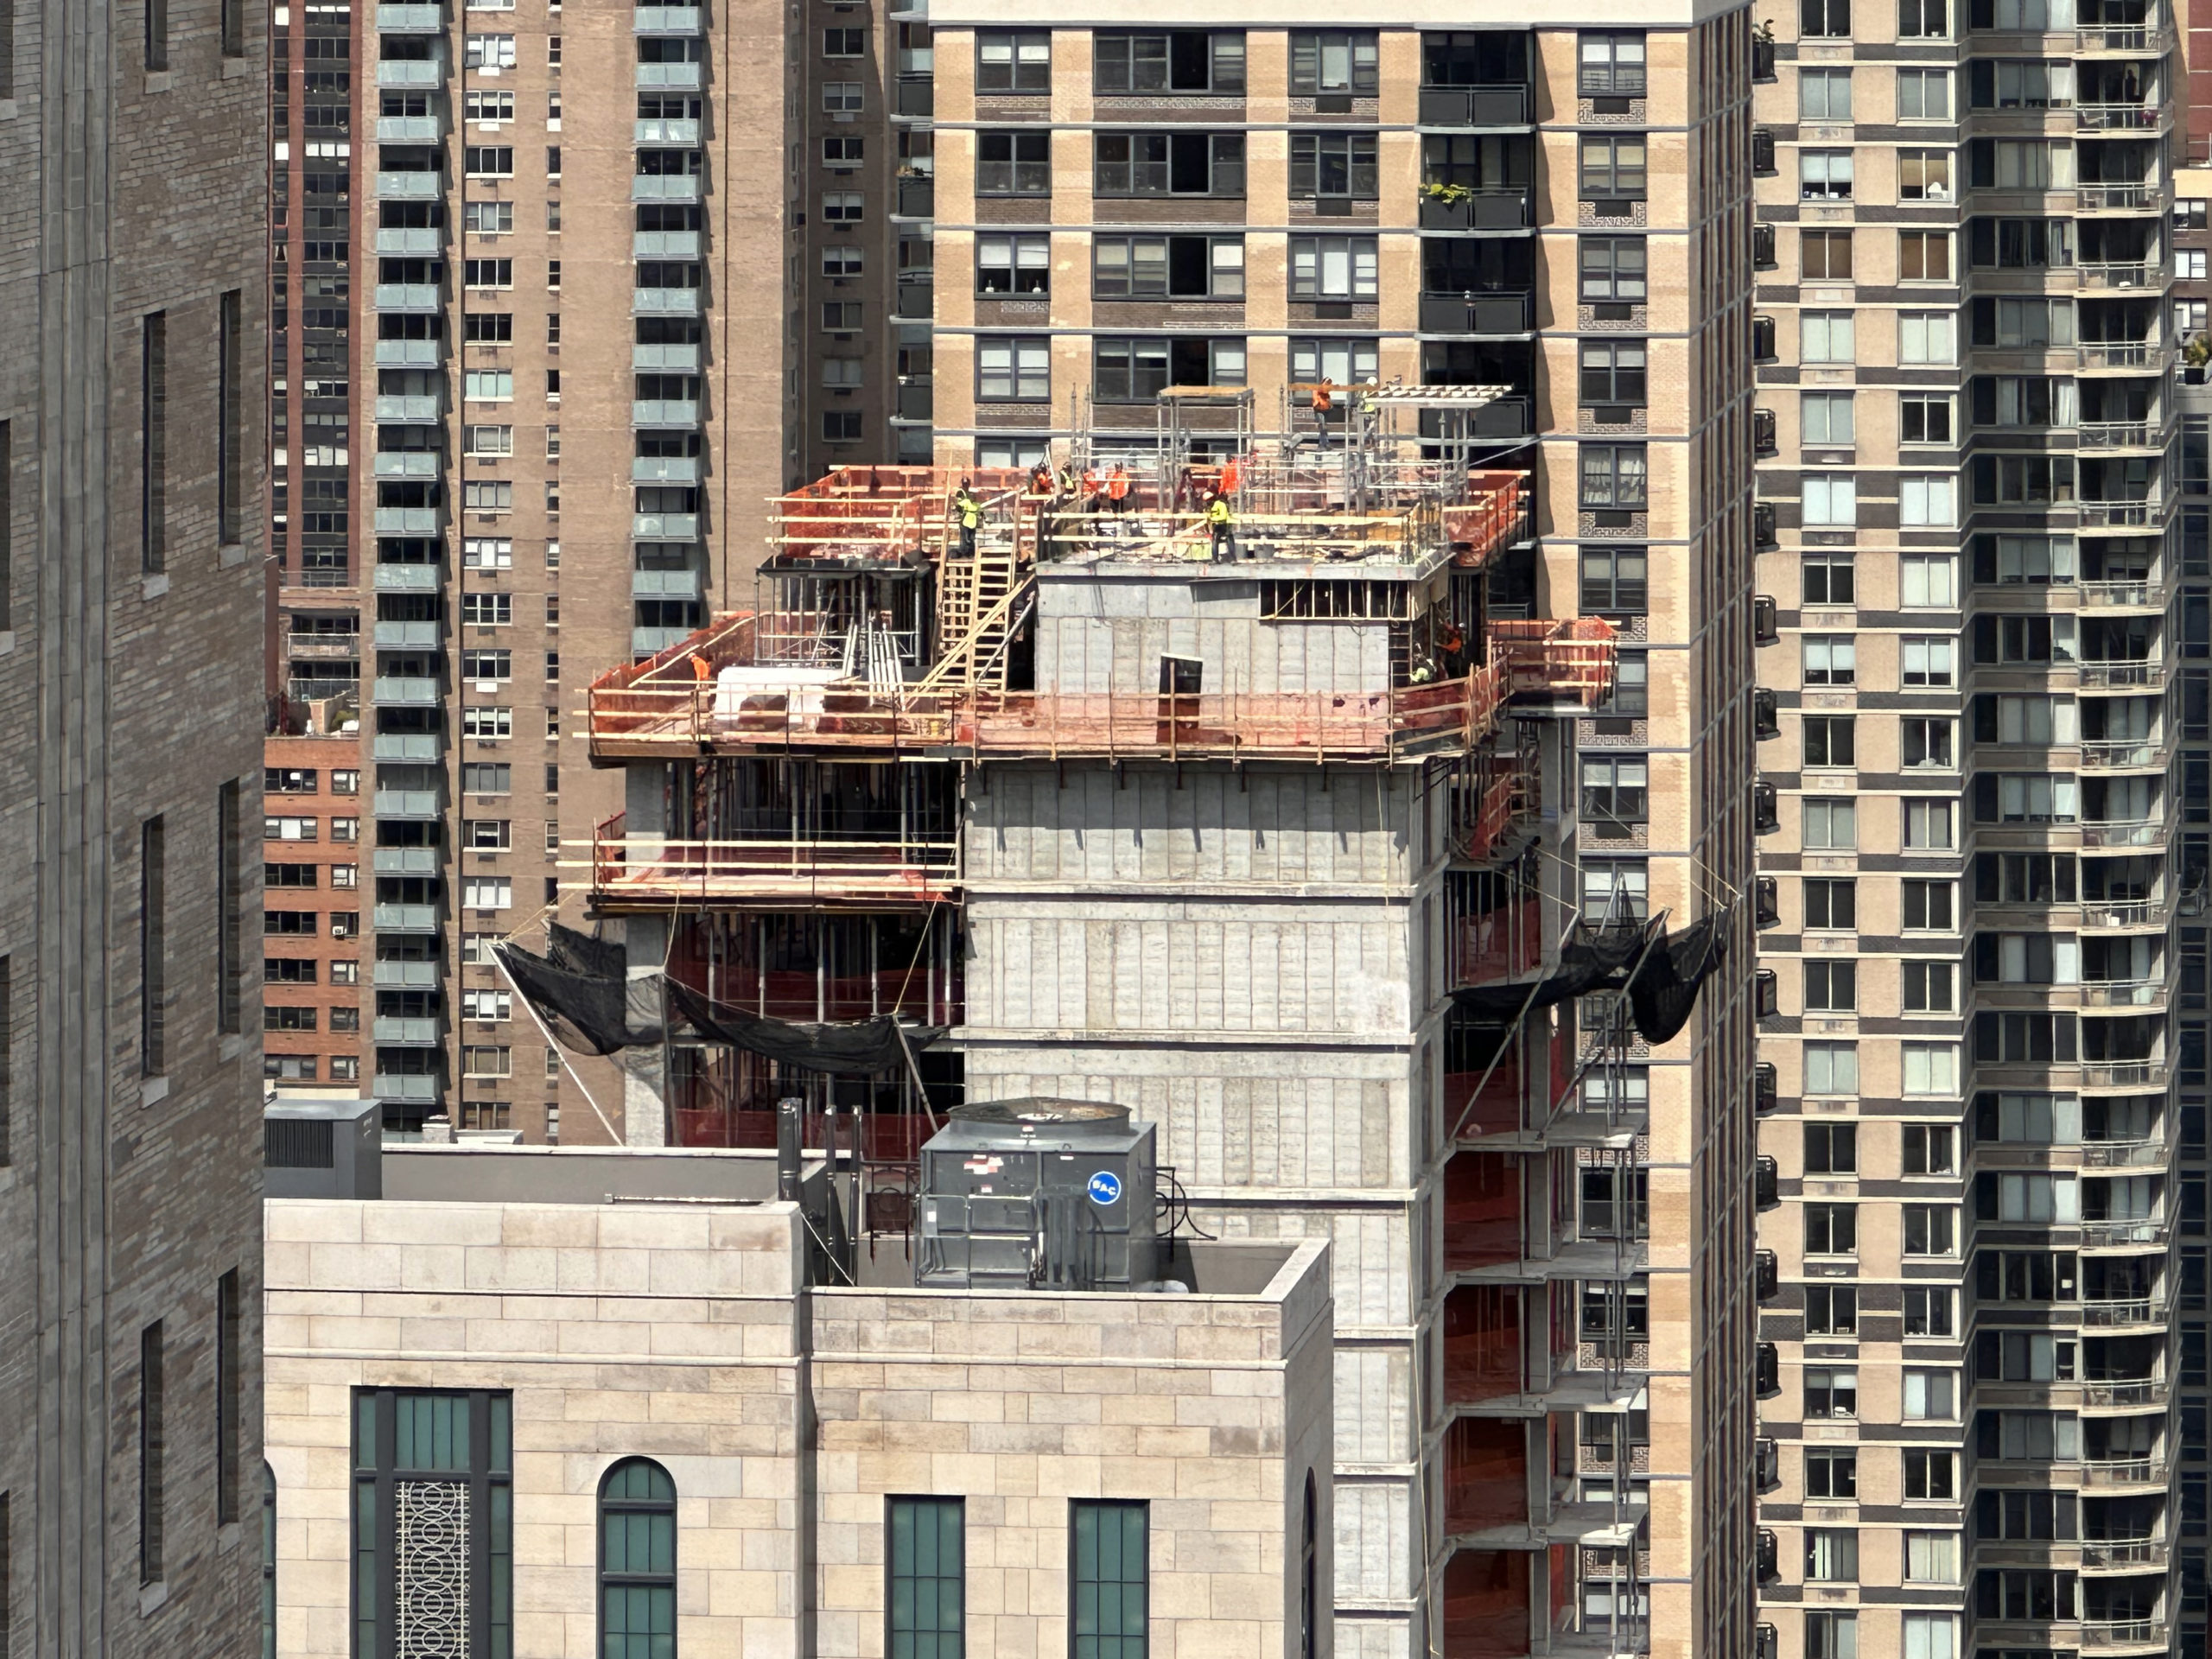
Photo by Michael Young
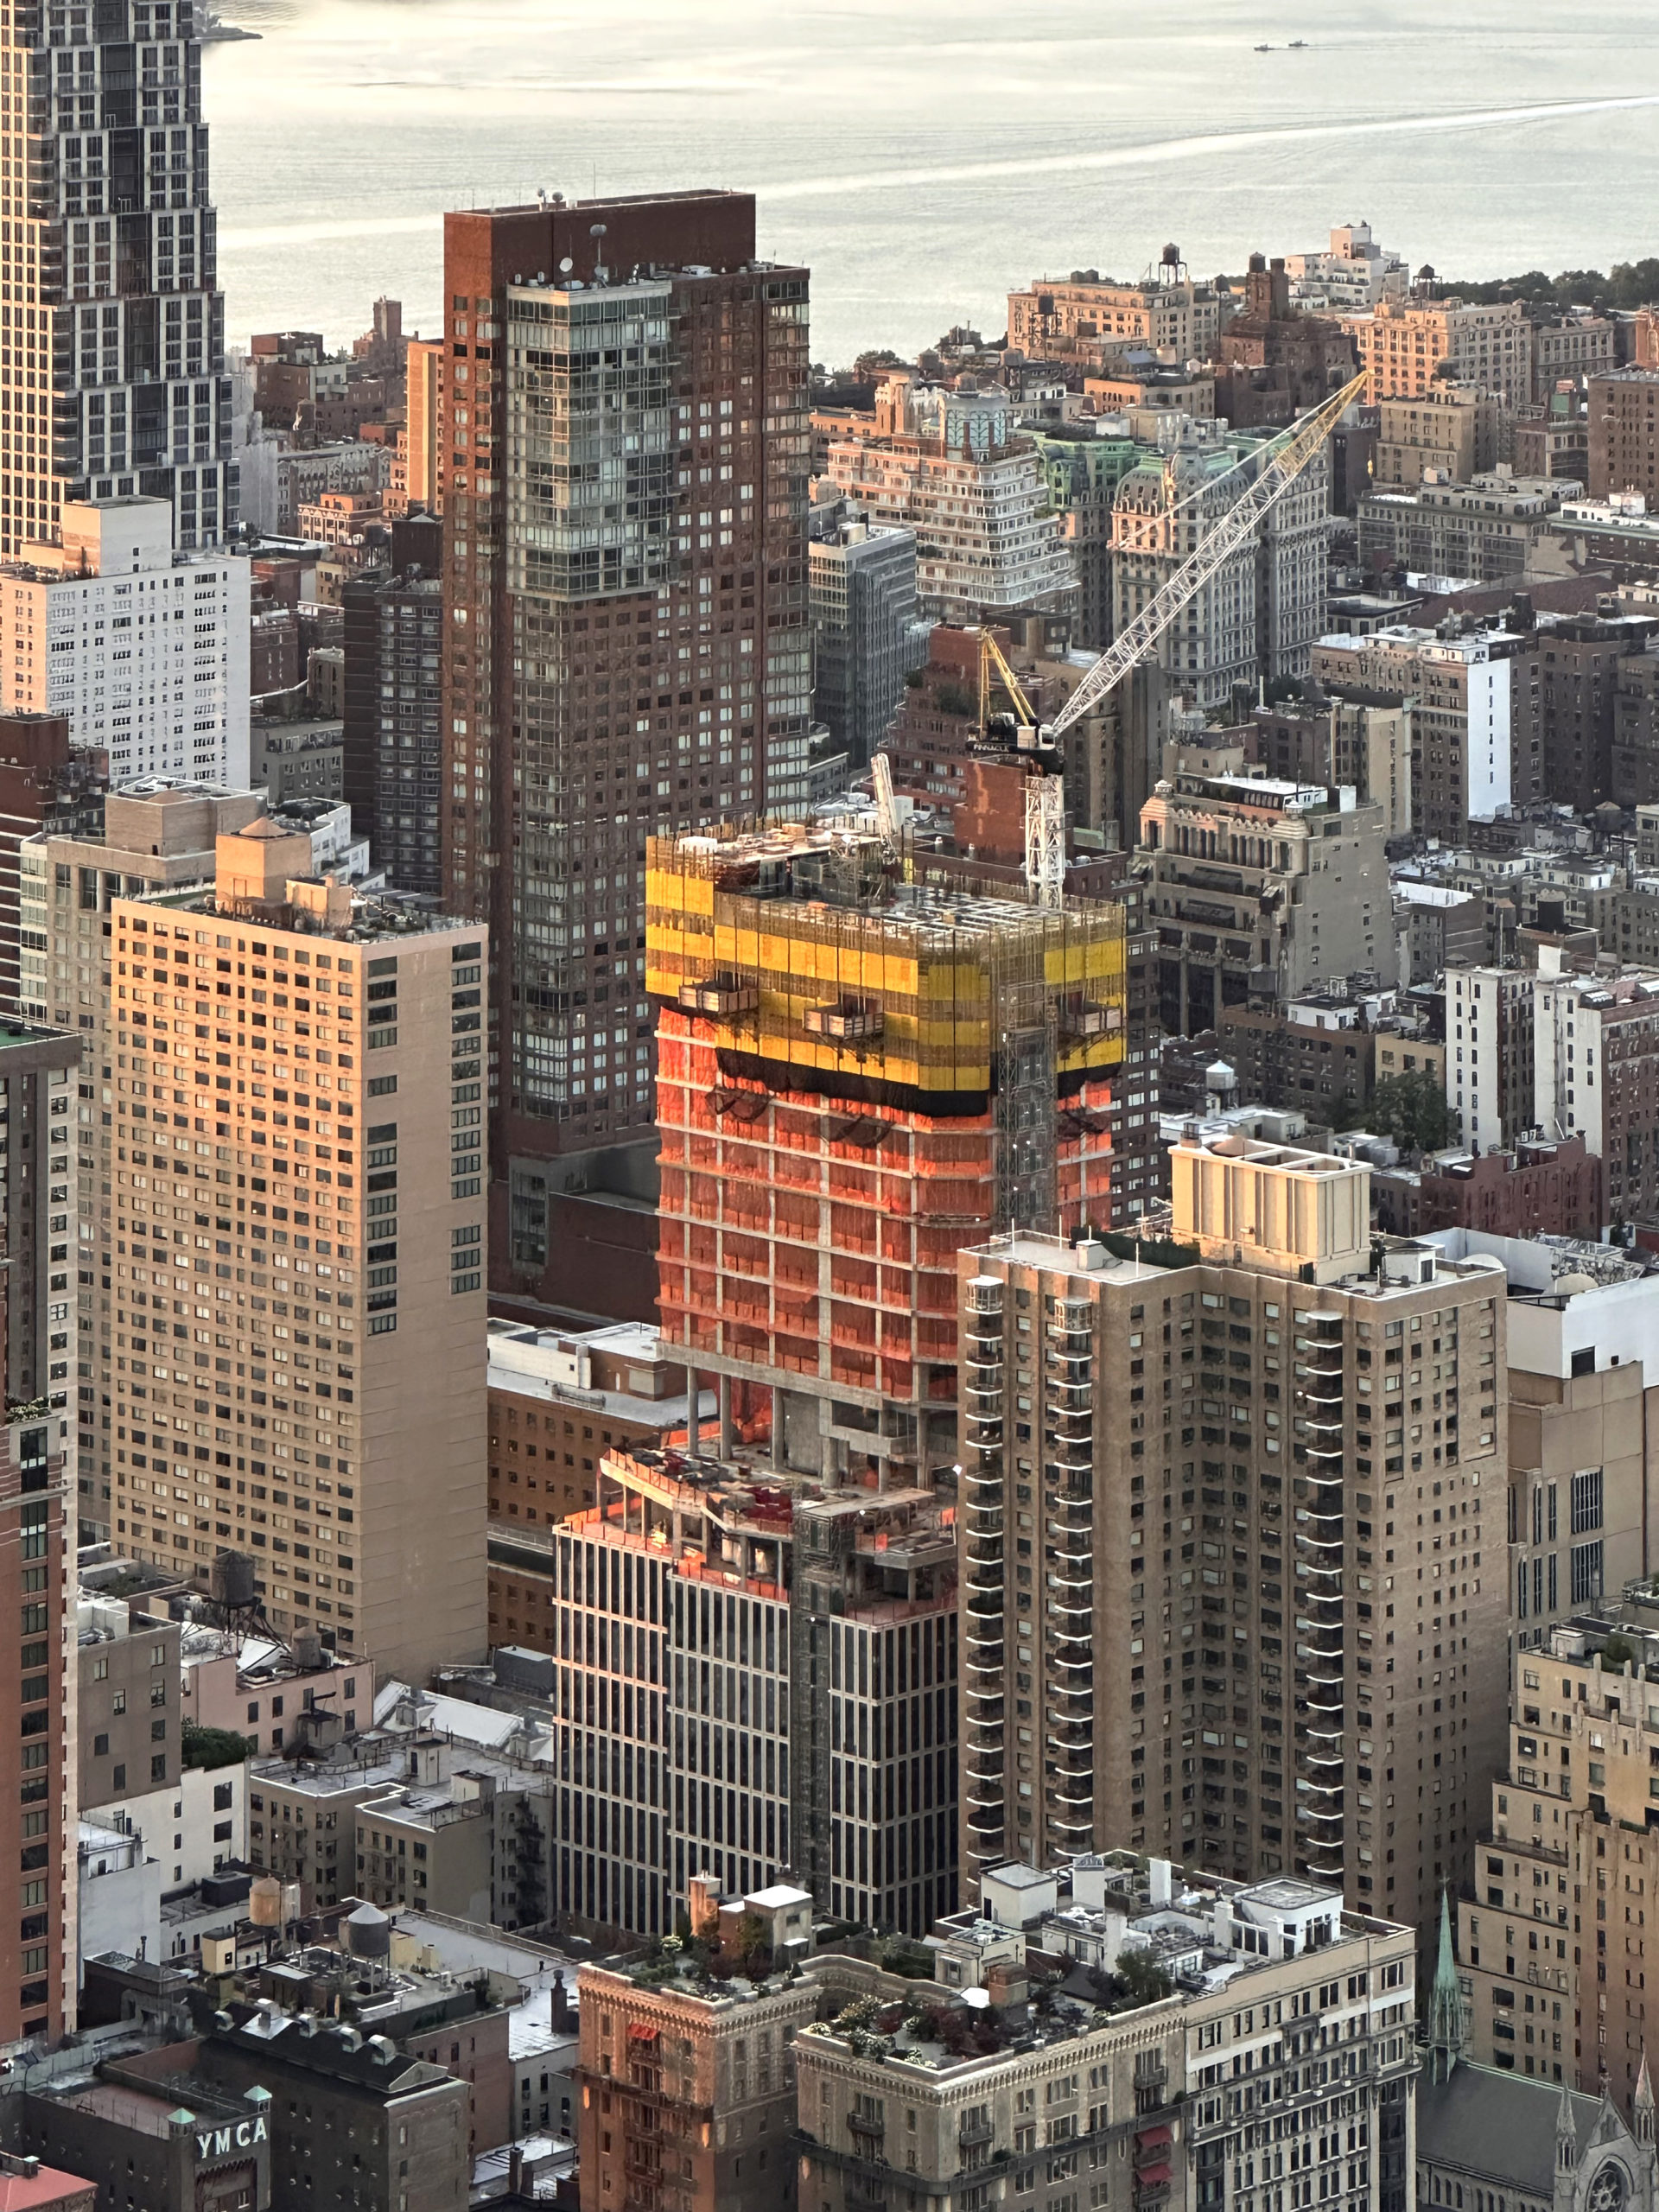
Photo by Michael Young
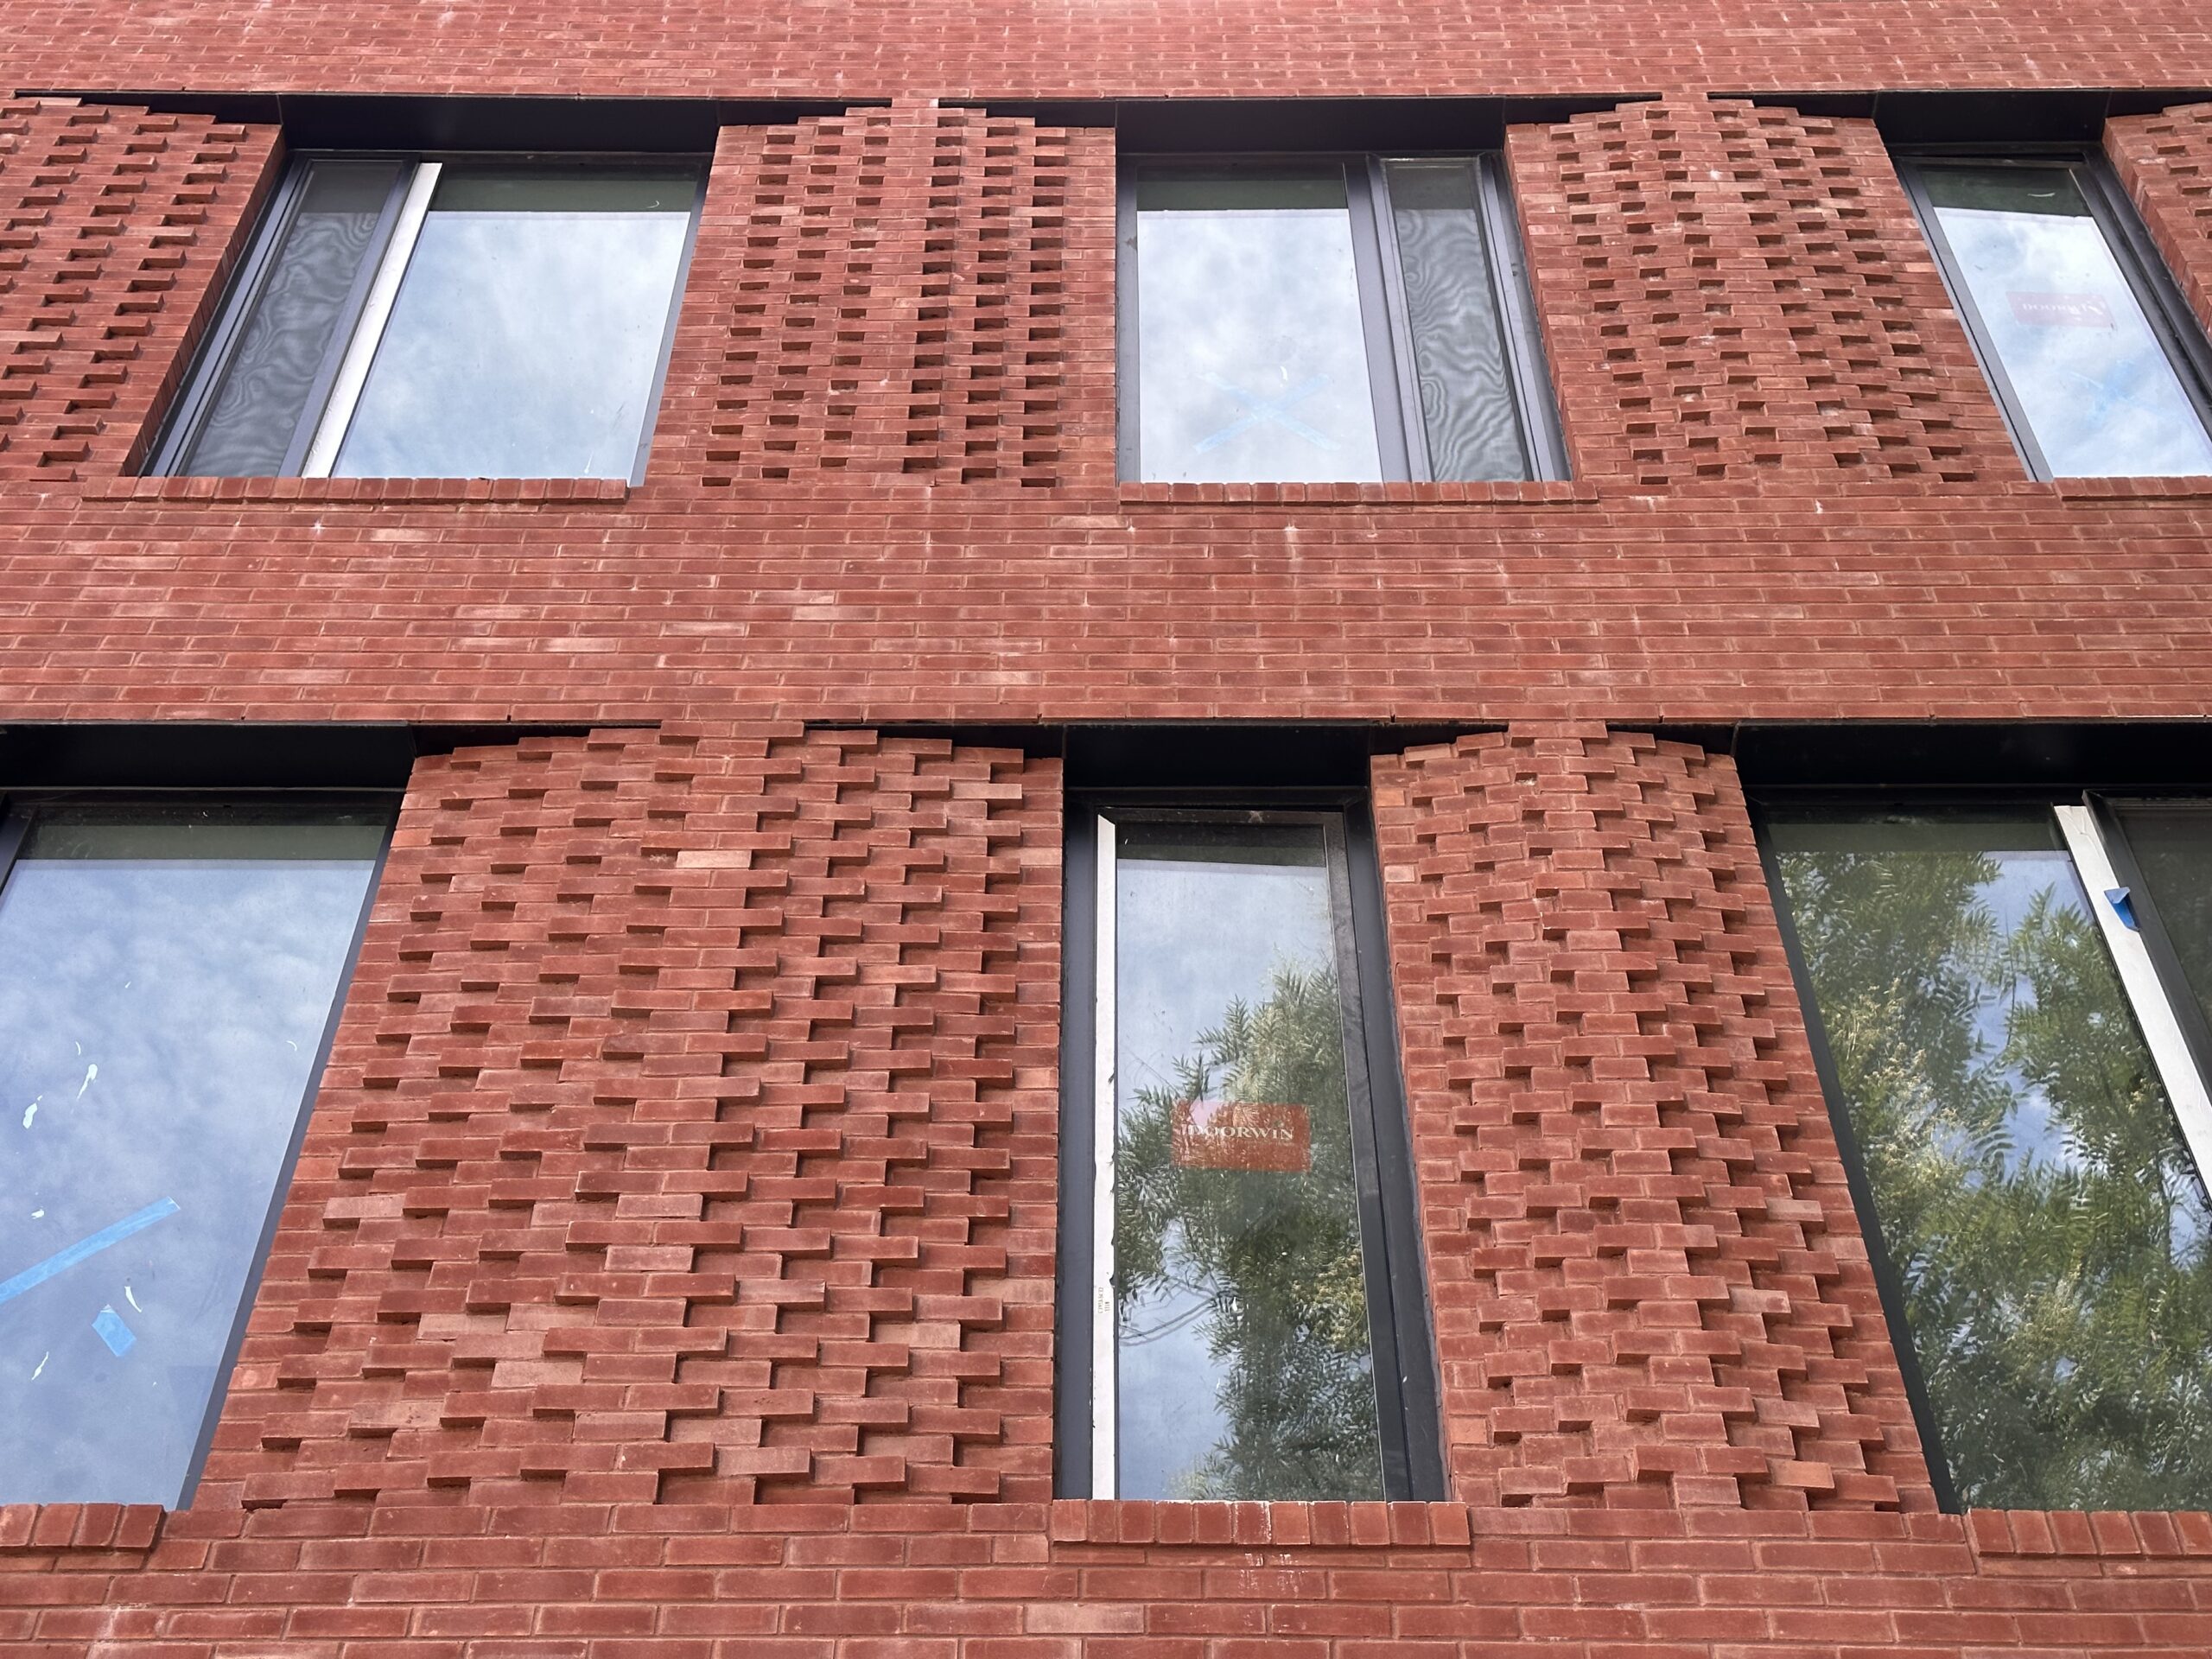
Photo by Michael Young

Photo by Michael Young
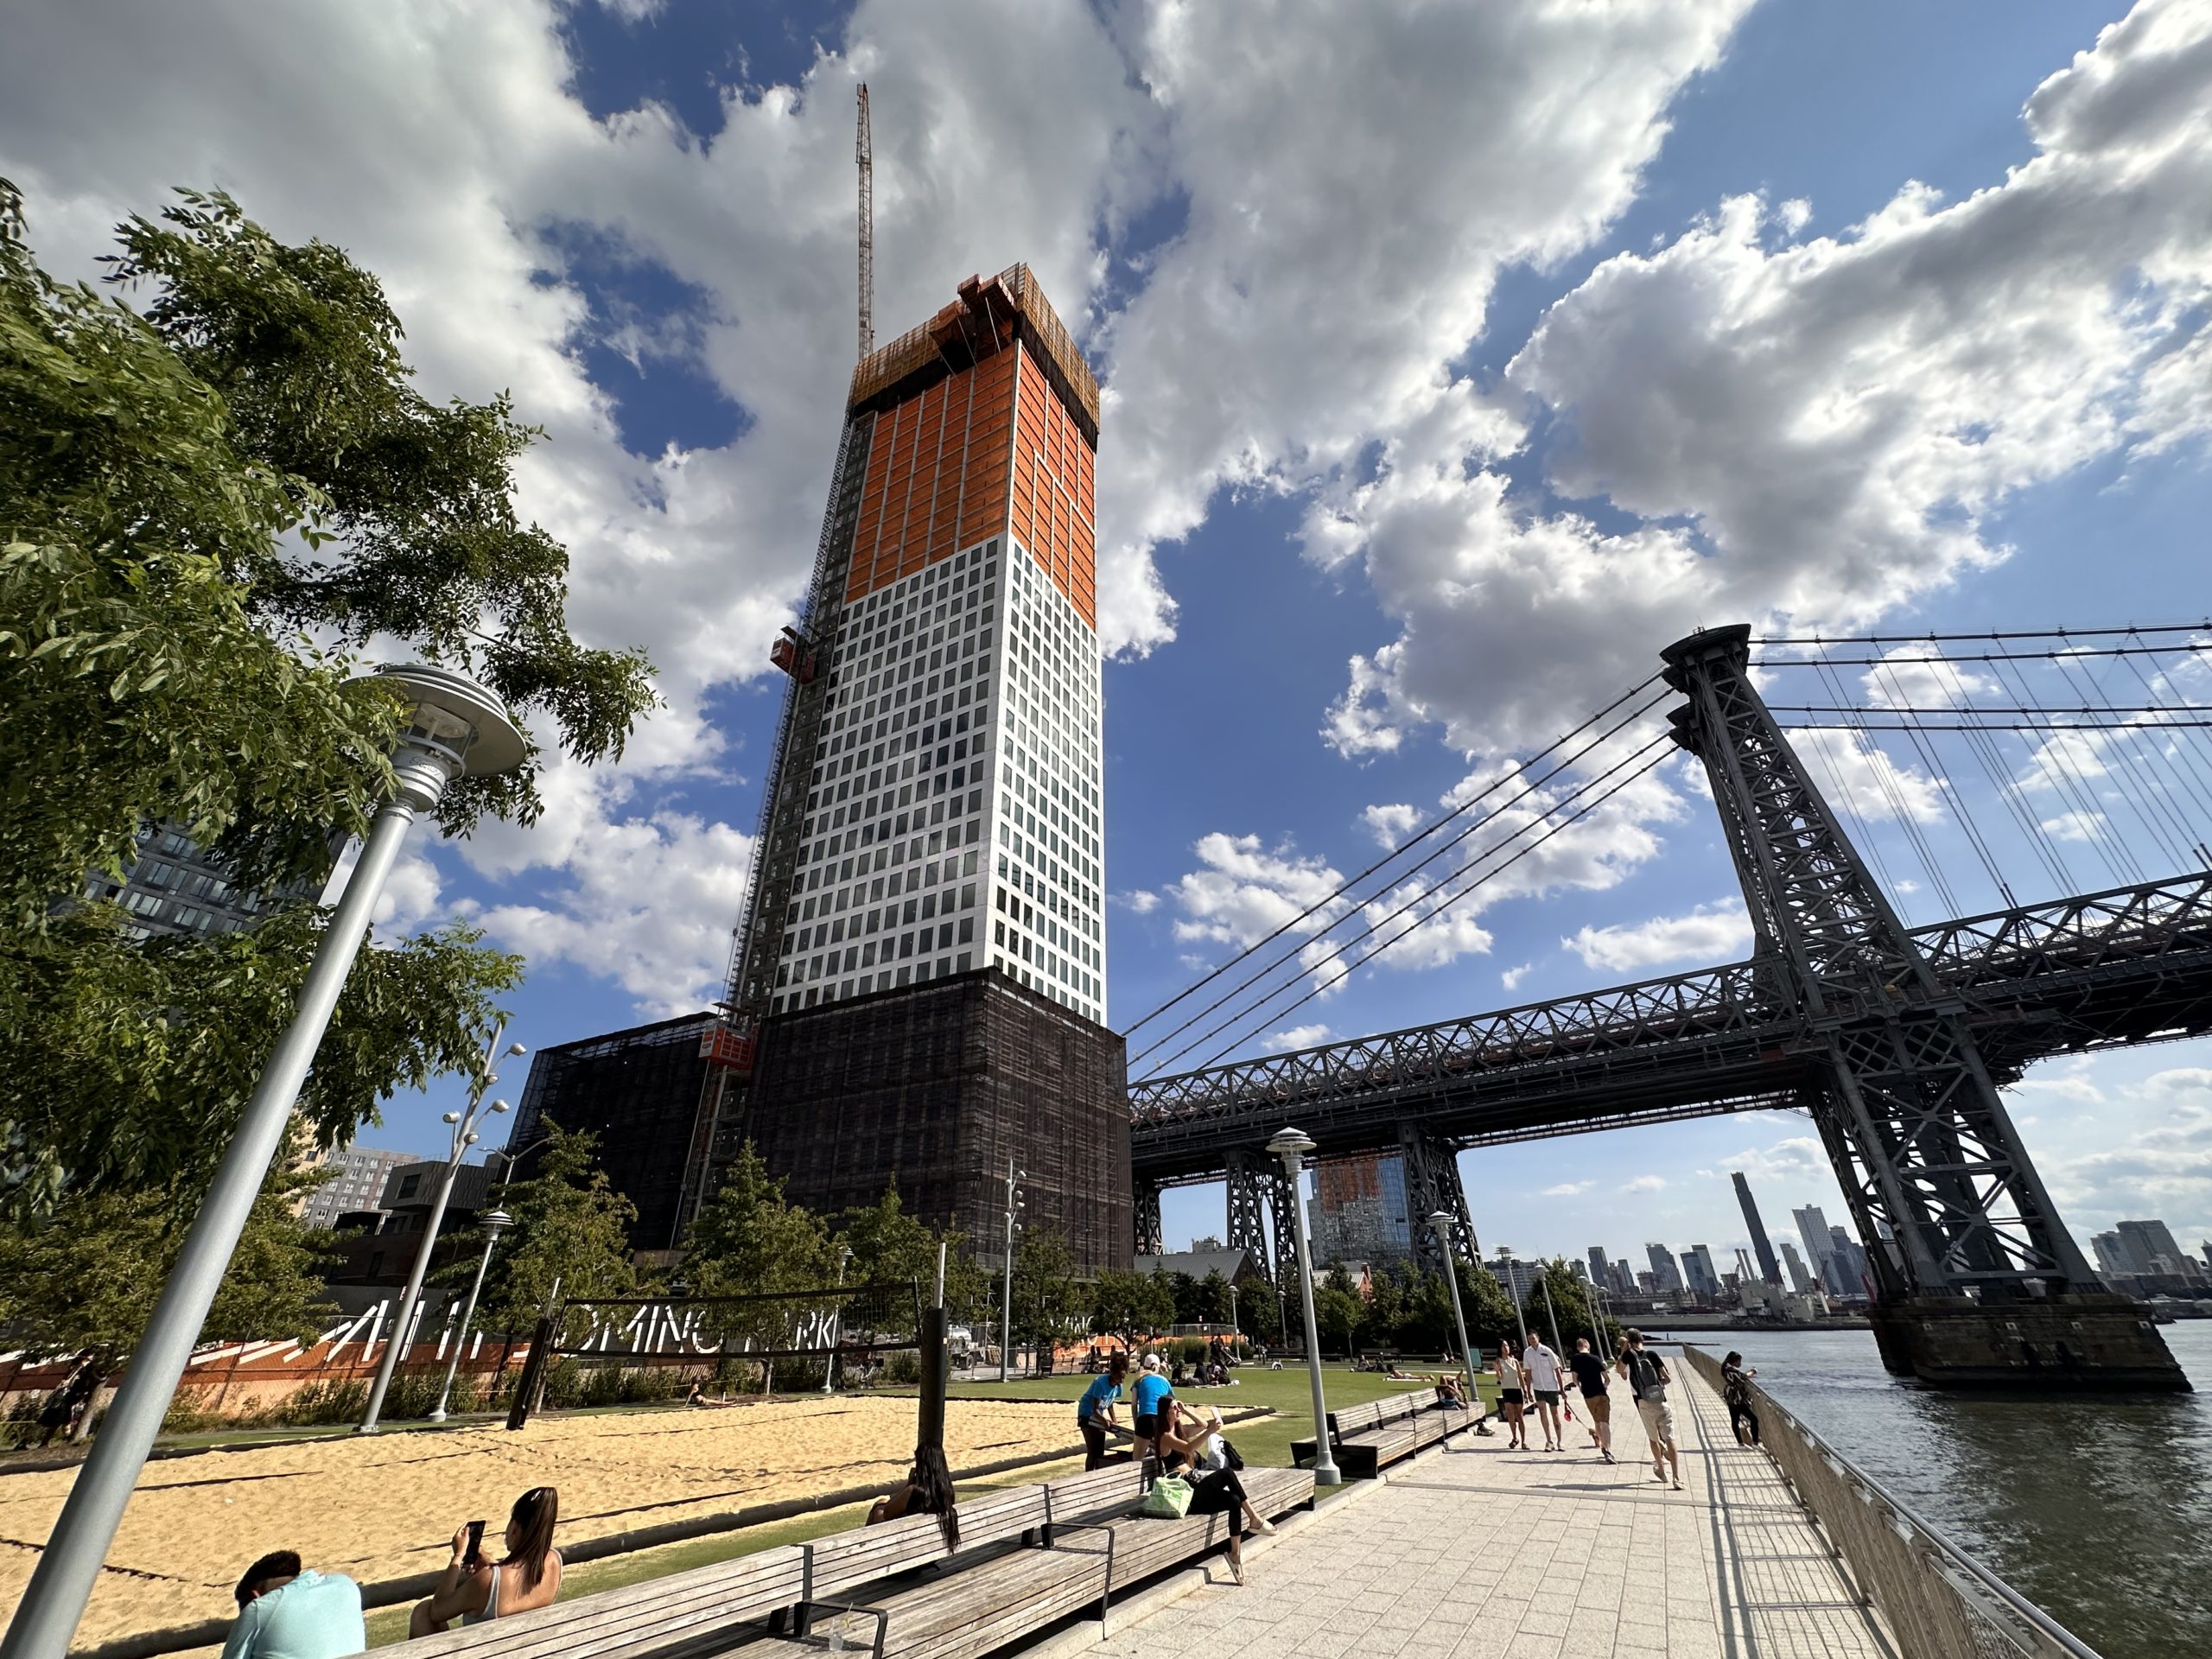
Photo by Michael Young
Subscribe to YIMBY’s daily e-mail
![]()
Follow YIMBYgram for real-time photo updates
Like YIMBY on Facebook
Follow YIMBY’s Twitter for the latest in YIMBYnews
Amazing numbers
The level o activity is astounding
Apparently, the CRE industry has managed to cope with the loss of 421a, and even more-or-less with higher interest rates. That’s good news, but I wish Yimby had delved into how in this article a bit.
Upvoted. This topic would make for an interesting story.
Amazing photography as always!
Remember, kids, Mr. 45’s lawyer has deemed NYC is in a death spiral. By the looks of these numbers, we might as well give up all hope on the city. It’s crazy how there’s anyone left after all the rioting and dismantling of hyperinflated net worths from our “beloved” self-declared billionaires.
With crime at some of its lowest numbers in quite a while, dark times are headed for the city…
Stupidity and racism go hand in hand.
Huh? “Studpidity and racism” do NOT describe whatsovever the person I think you are referring to. Not at all.
The 6 month forecast for new residential/housing projects from what my company is seeing is not positive. Yes the construction index is high, but without 421a or some kind of incentive program, developers are not putting money into the market like they were before. Couple that with the ongoing wars abroad, supply chain/manufacturing delays/issues, etc…every architectural firm dealing with residential development should brace themselves from all I’ve heard.
Interesting. Who are you and who are your sources?
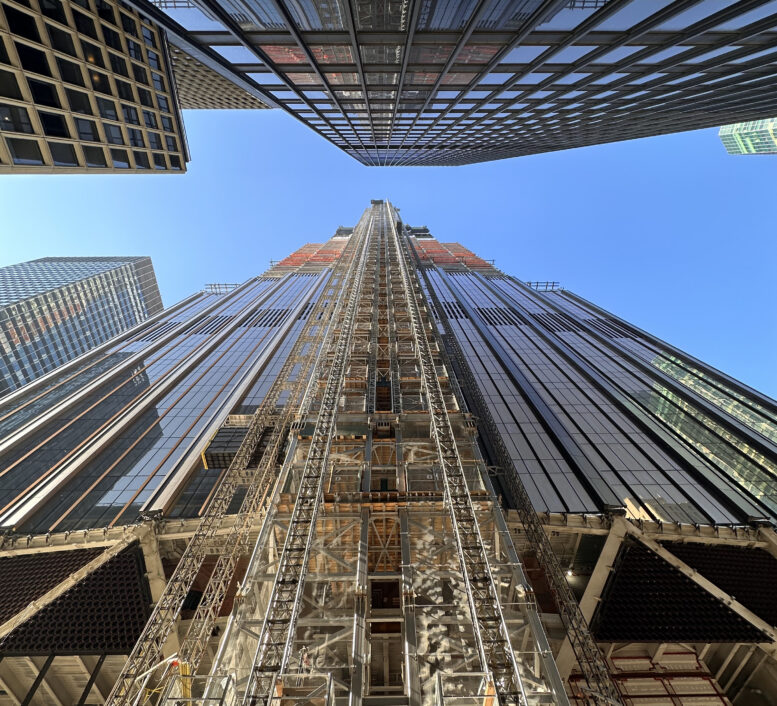
There is construction everywhere you look in New York.
Let’s goooooo! Build, baby, build! Love seeing all the new construction going up
Beautifully photographed, laid out and informative.