
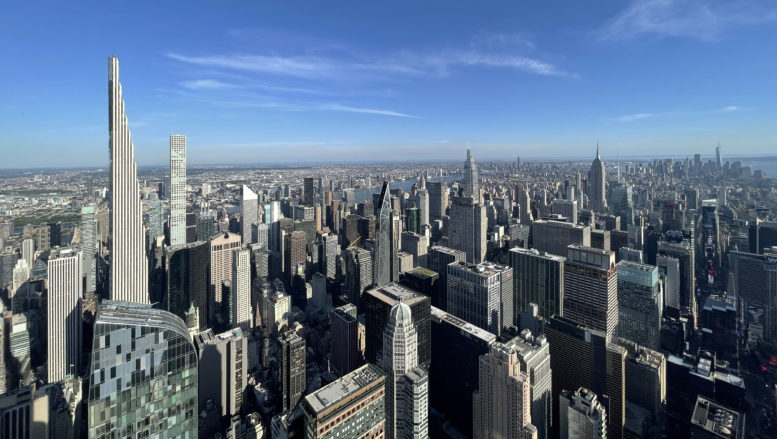
Figures for new construction permit filings for New York City for the second quarter of 2022 are in, and YIMBY’s latest analysis reveals that a number of positive trends emergent in the year’s first quarter have continued at a sustained pace. During the period spanning April, May, and June, the Department of Buildings registered permit filings for a combined total of around 13.1 million square feet, which, among other uses, includes 9,997 residential and hotel rooms. Although the square footage of the average filing is slightly smaller compared to the first quarter, the 857 new permits filed in the second quarter almost exactly match the total of 862 filings in the previous quarter, with both figures substantially exceeding quarterly averages from the previous year. Below we share a detailed analysis of the aggregated permit data. The full data set on which we based our research is available with a subscription to YIMBY’s Building Wire service.
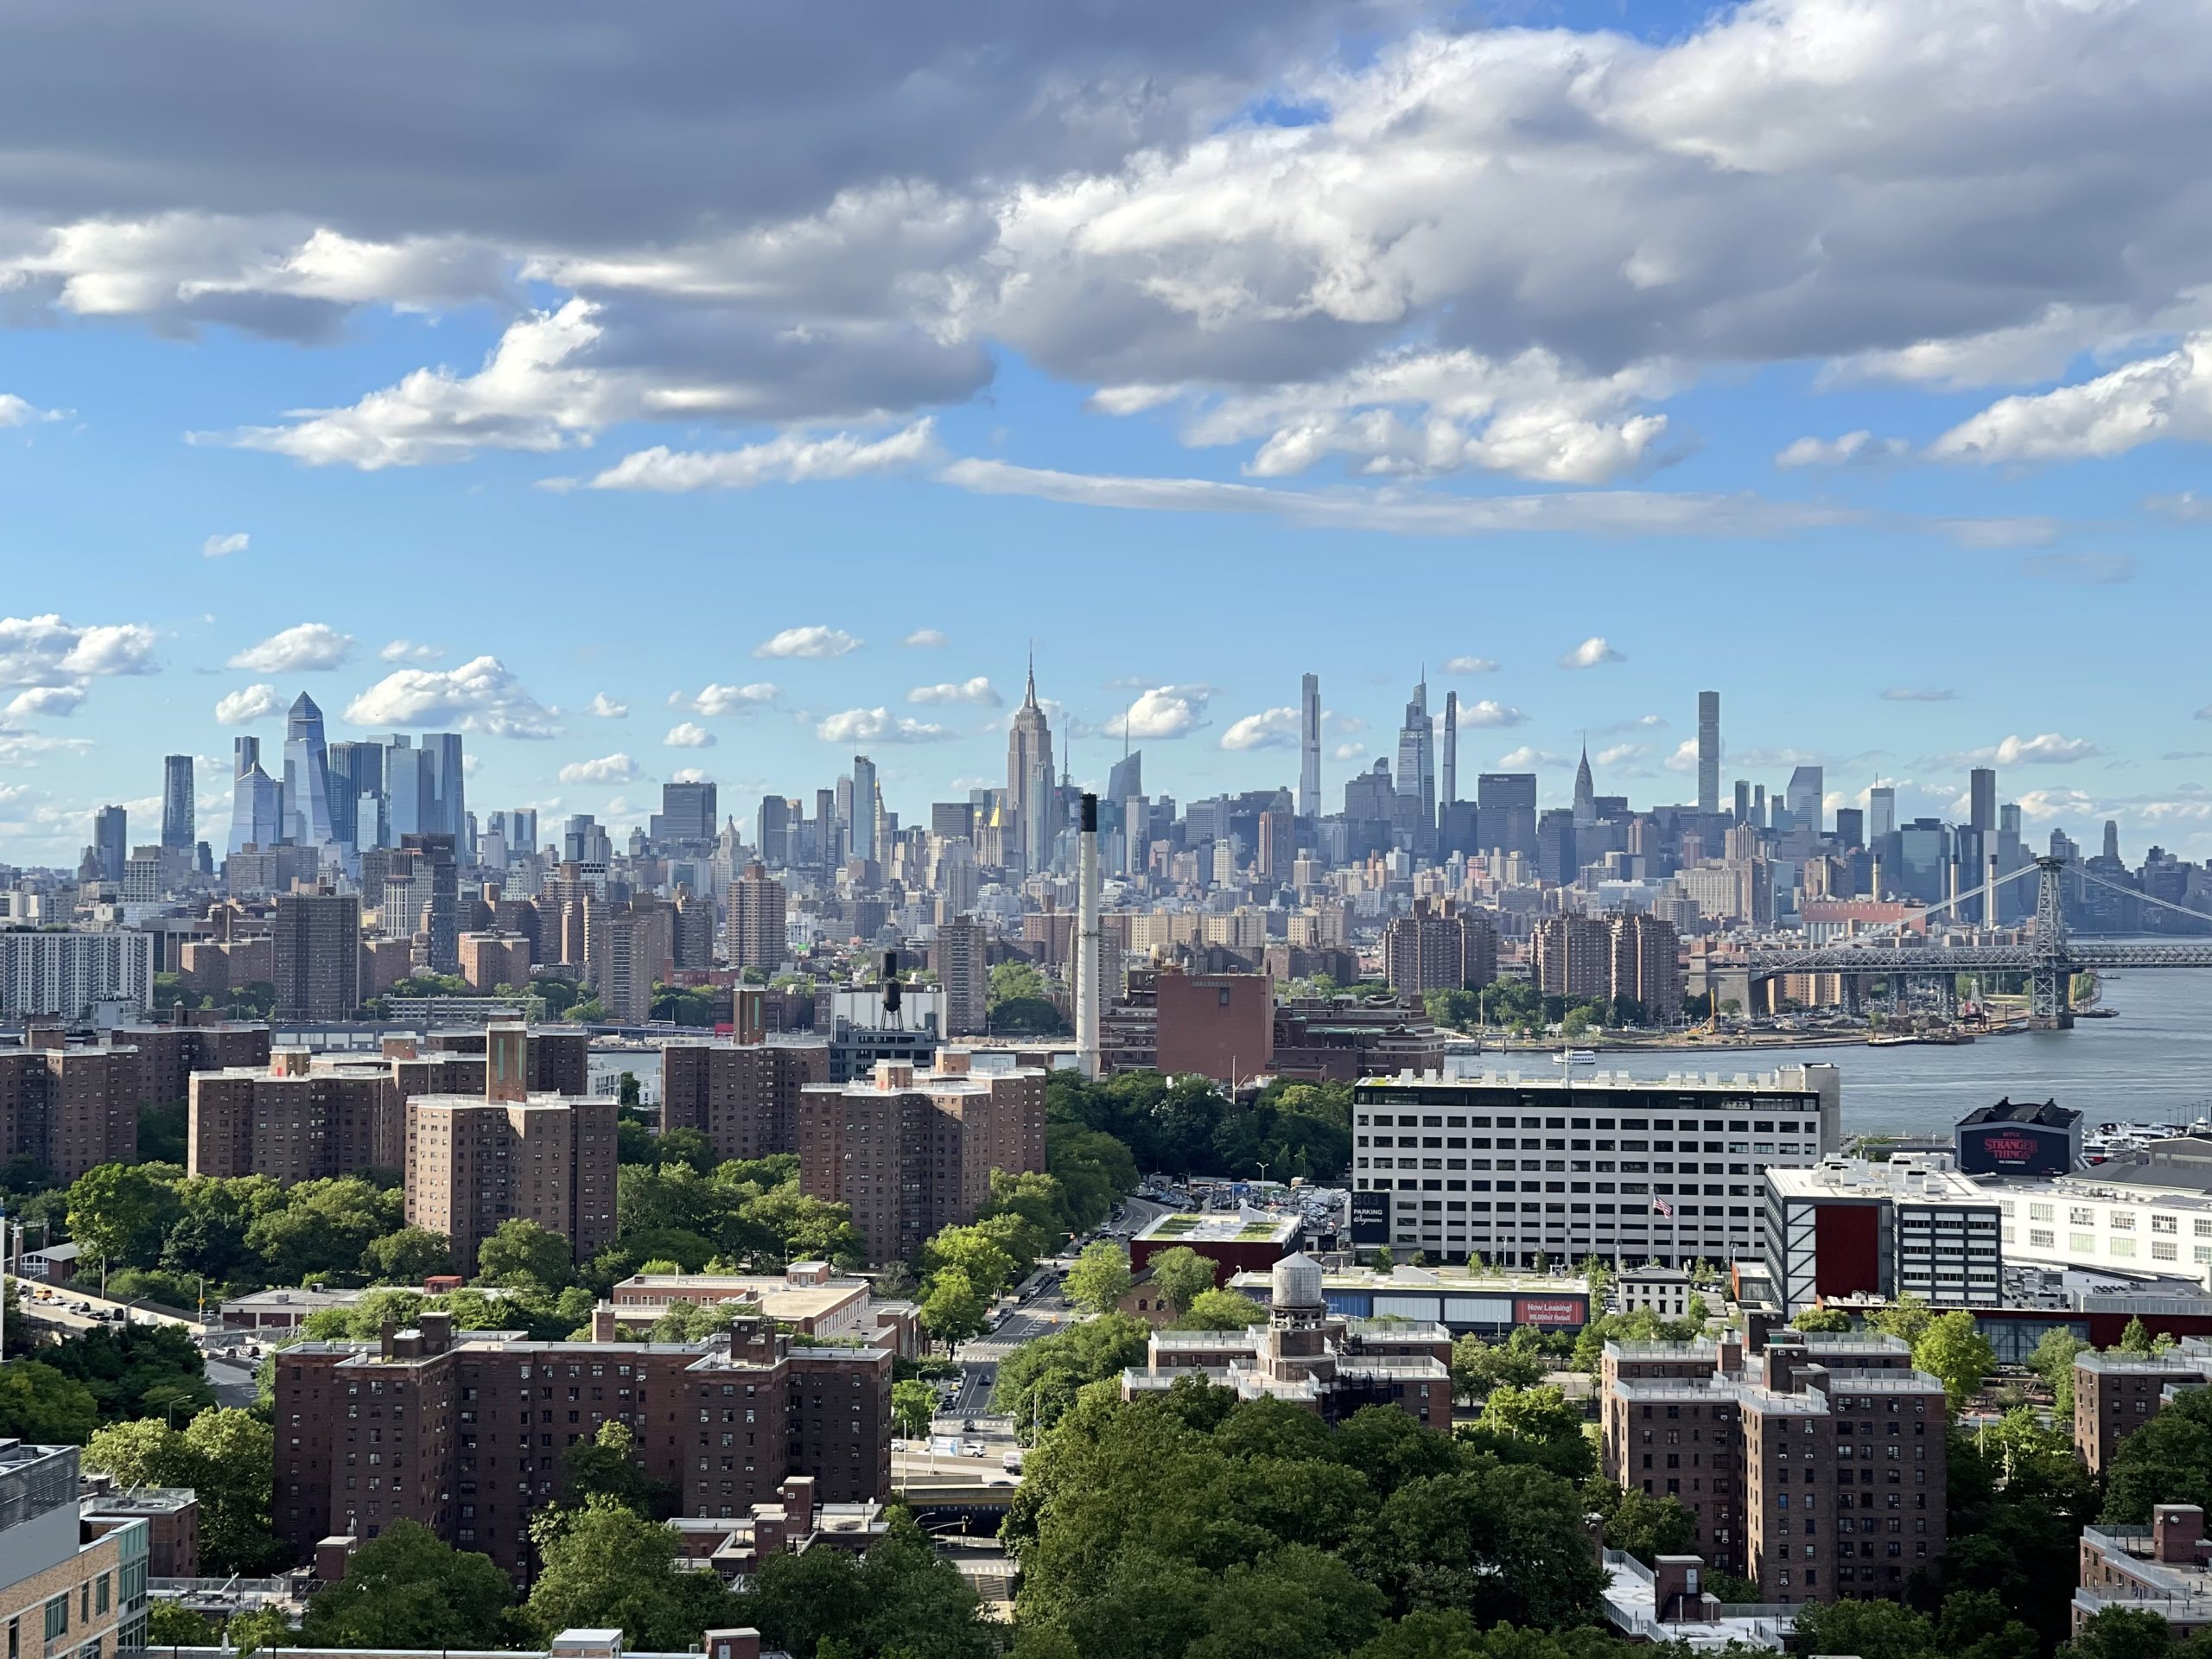
Photo by Michael Young
Number of permit filings per month
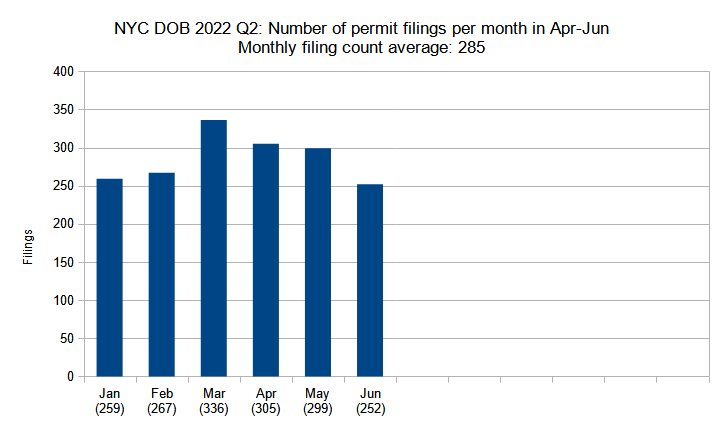
Number of new construction permits filed per month in New York City in Q1-Q2 (January through June) 2022. Data source: the Department of Buildings. Data aggregation and graphics credit: Vitali Ogorodnikov
Over the second quarter of the year, the monthly average number of new construction filings has remained remarkably consistent with that of the first quarter. The average monthly permit count for April, May, and June of 285 is almost identical to that of January, February, and May, which averaged at 287.
This finding is great news for the city’s construction industry. The first quarter’s figure nearly doubled last year’s monthly filing average of 168; even its lowest monthly total (January, with 259 filings) significantly outpaces last year’s best-performing month (December, with 219 filings). In turn, the quarter’s best performing month, March with 336 filings, more than tripled last March’s total of 103 filings.
Since the second quarter’s average matches that of the first, it means that the permit surge observed in Q1 was not an aberration that would be followed by a drastic dip, but instead is indicative of a consistent trend that has so far held strong for at least half a year.
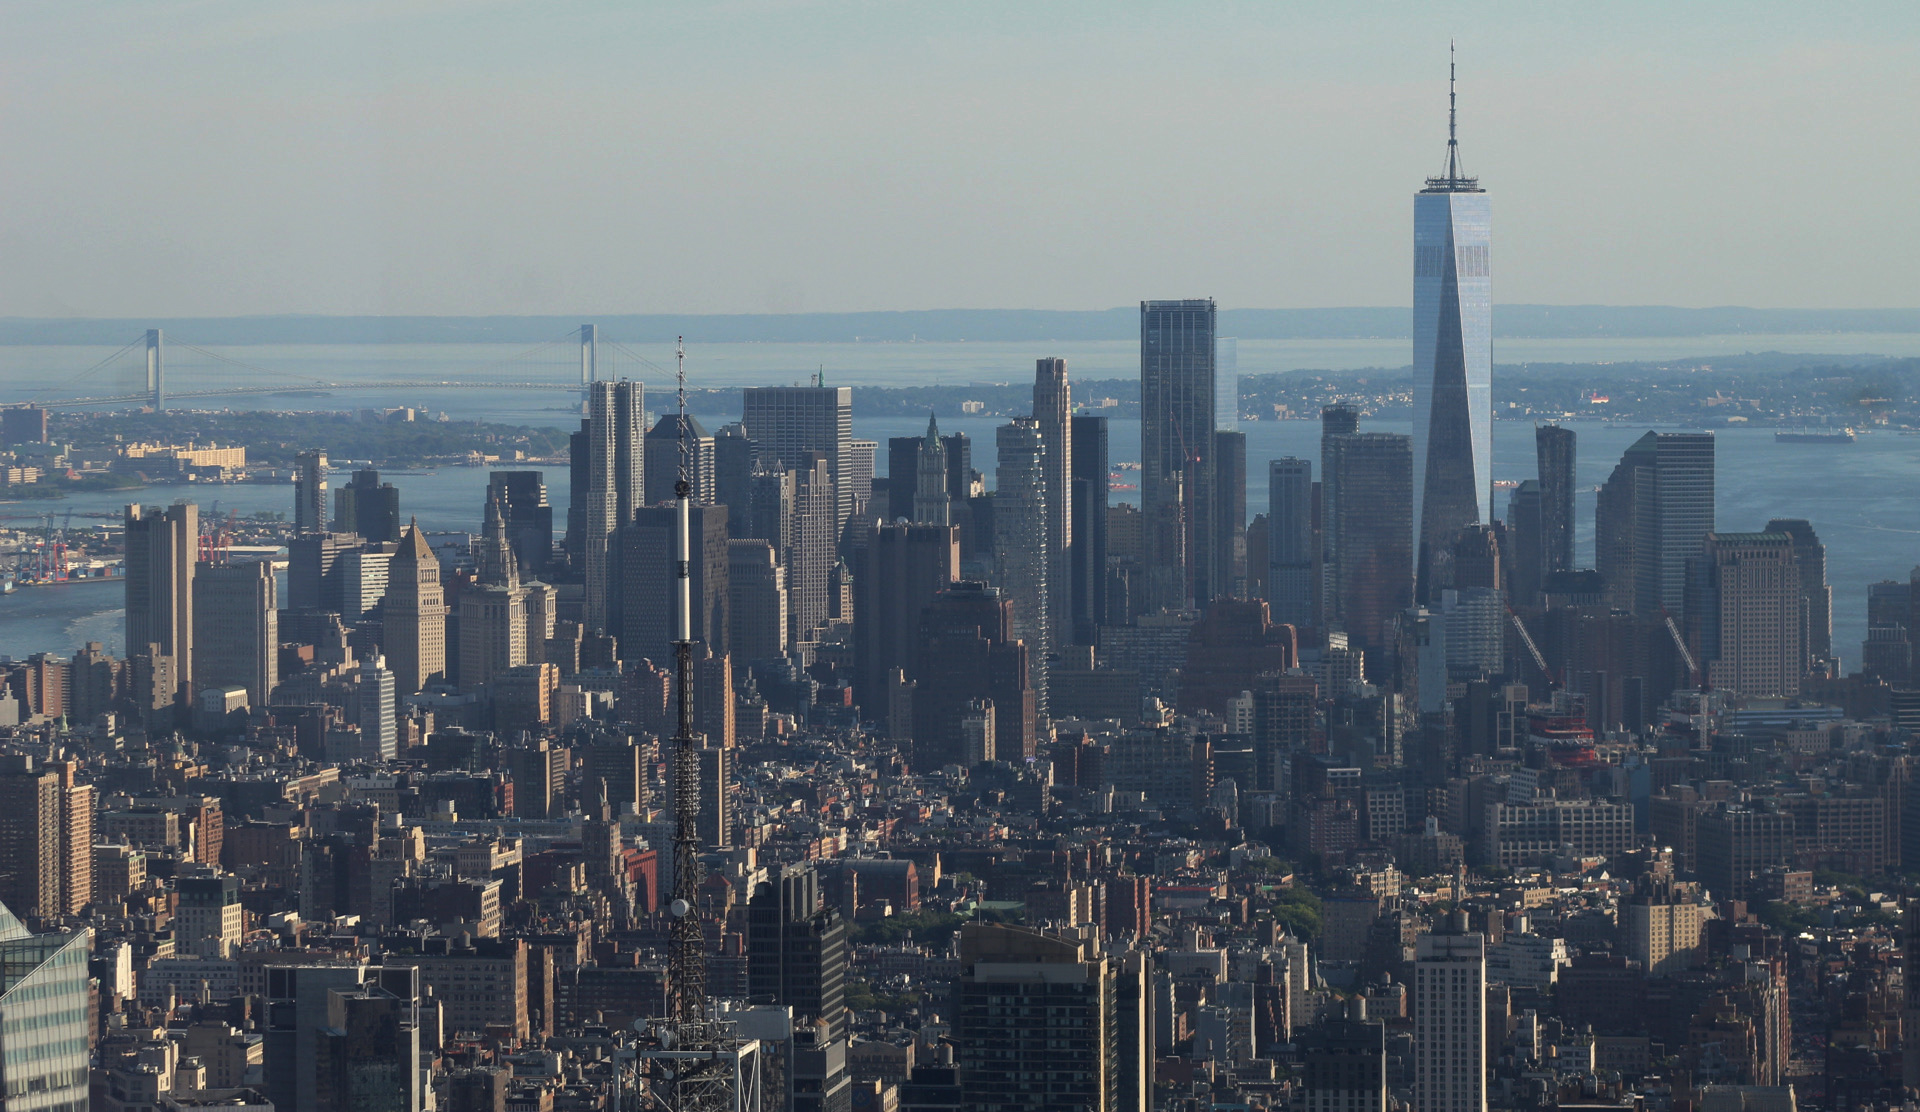
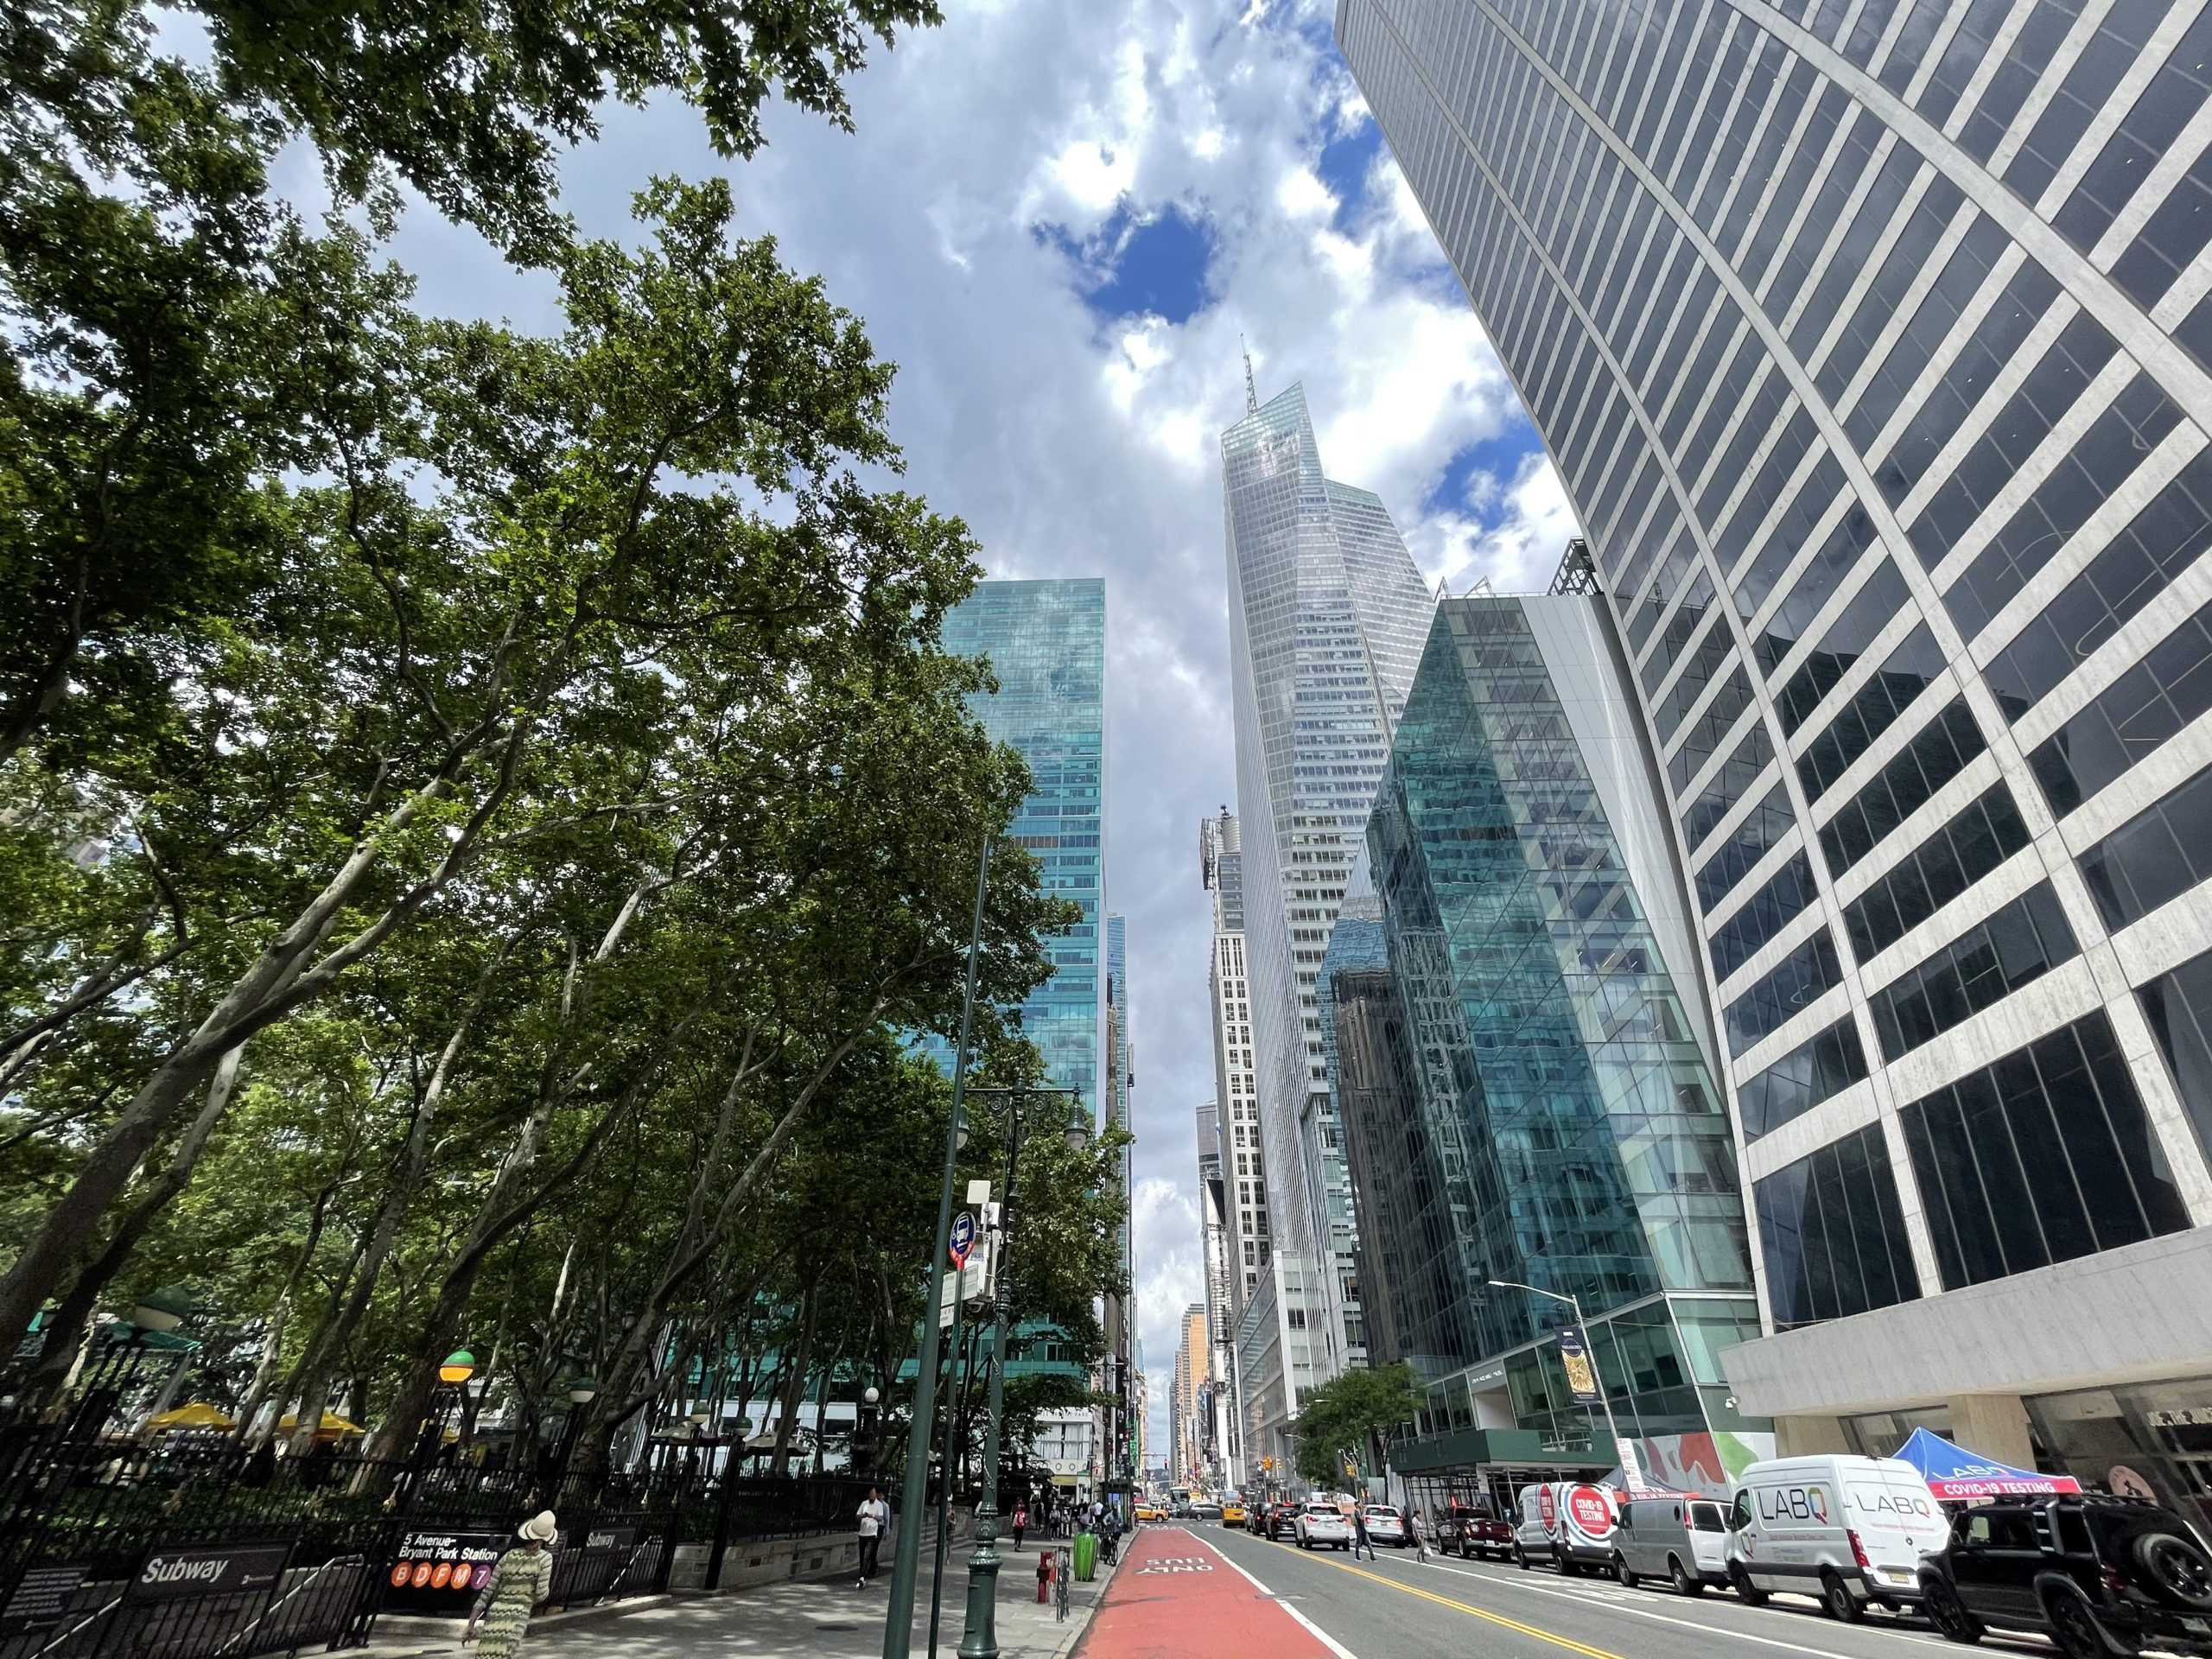
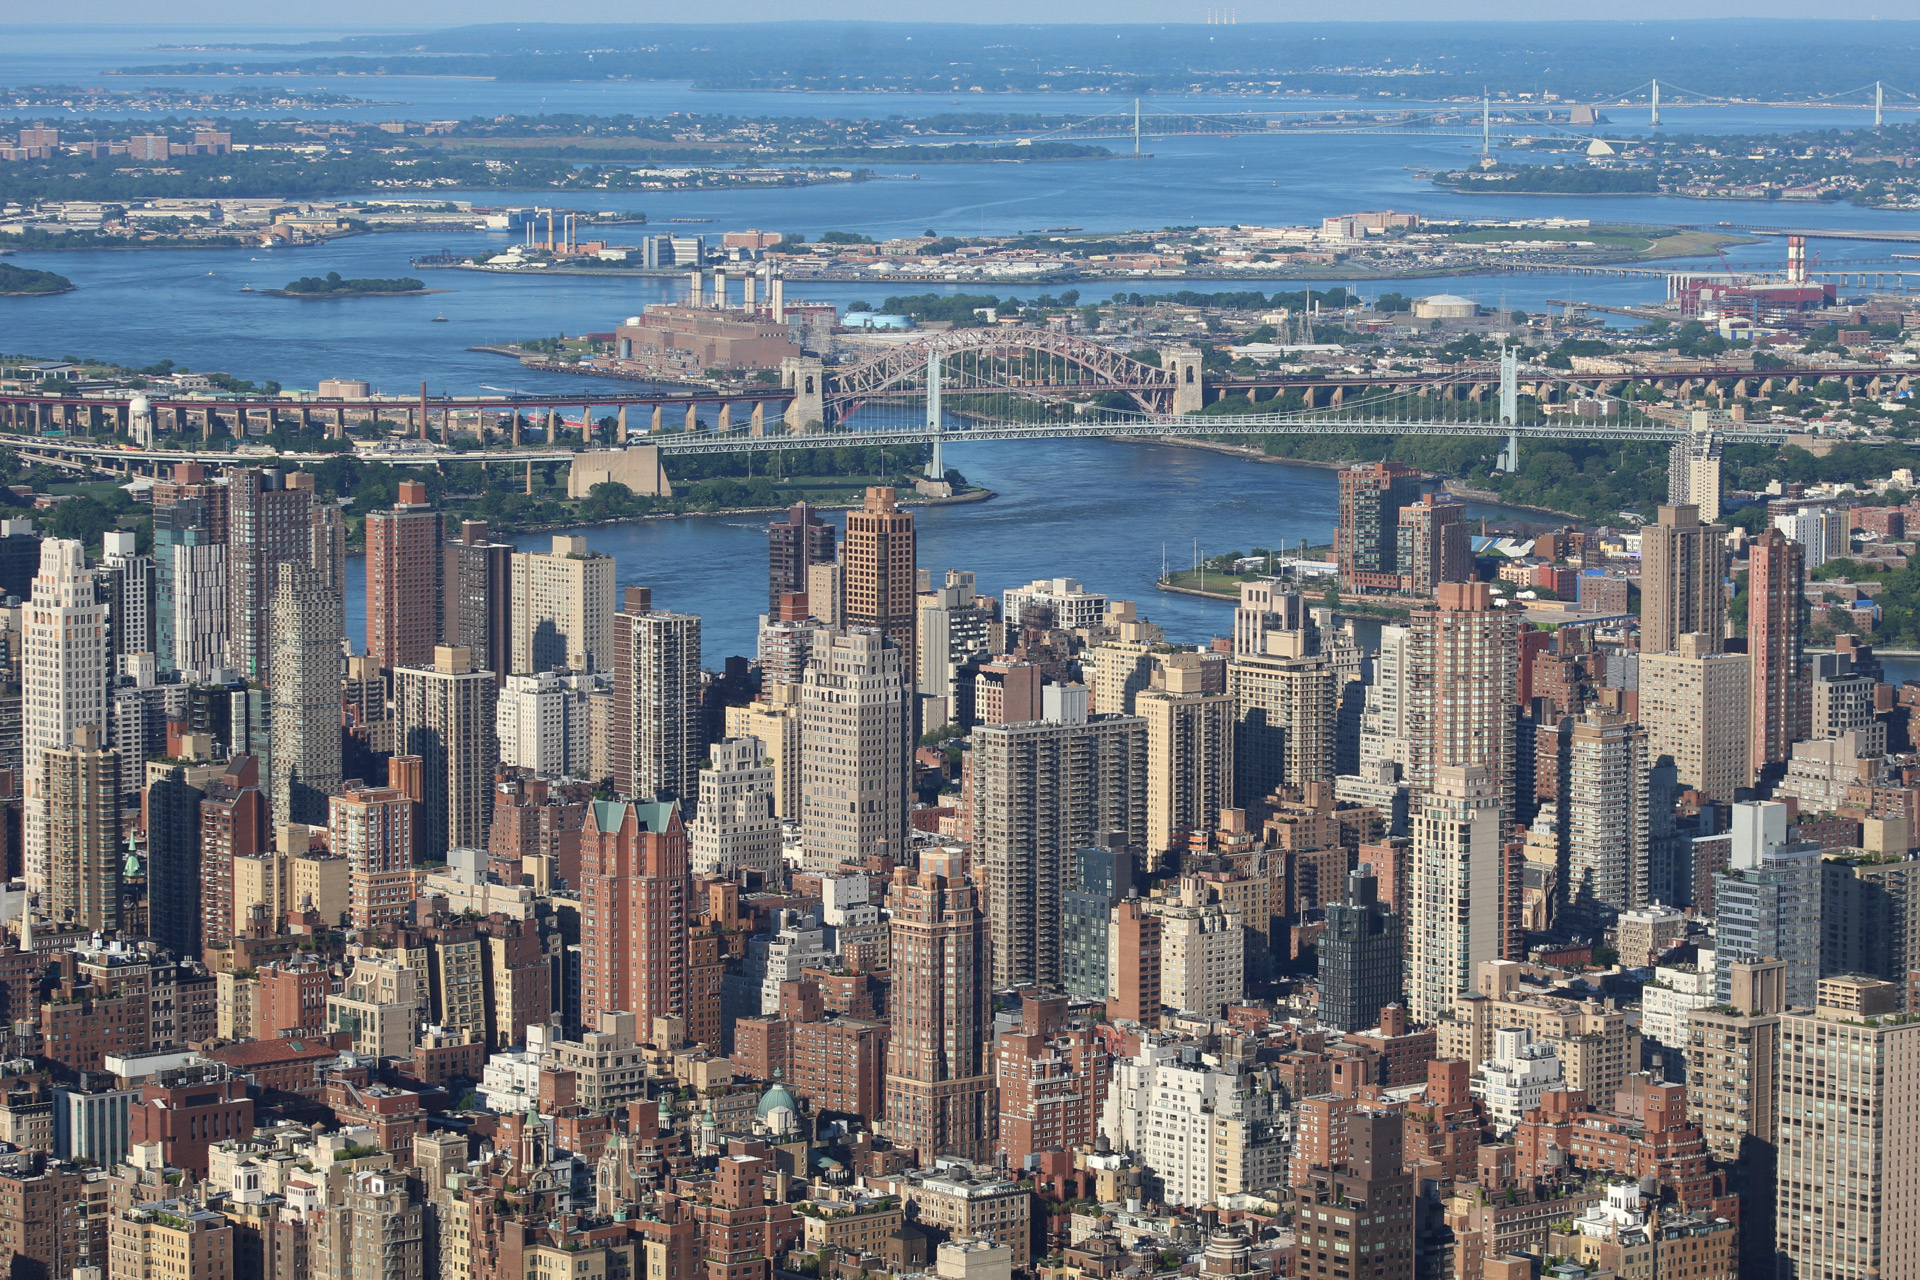
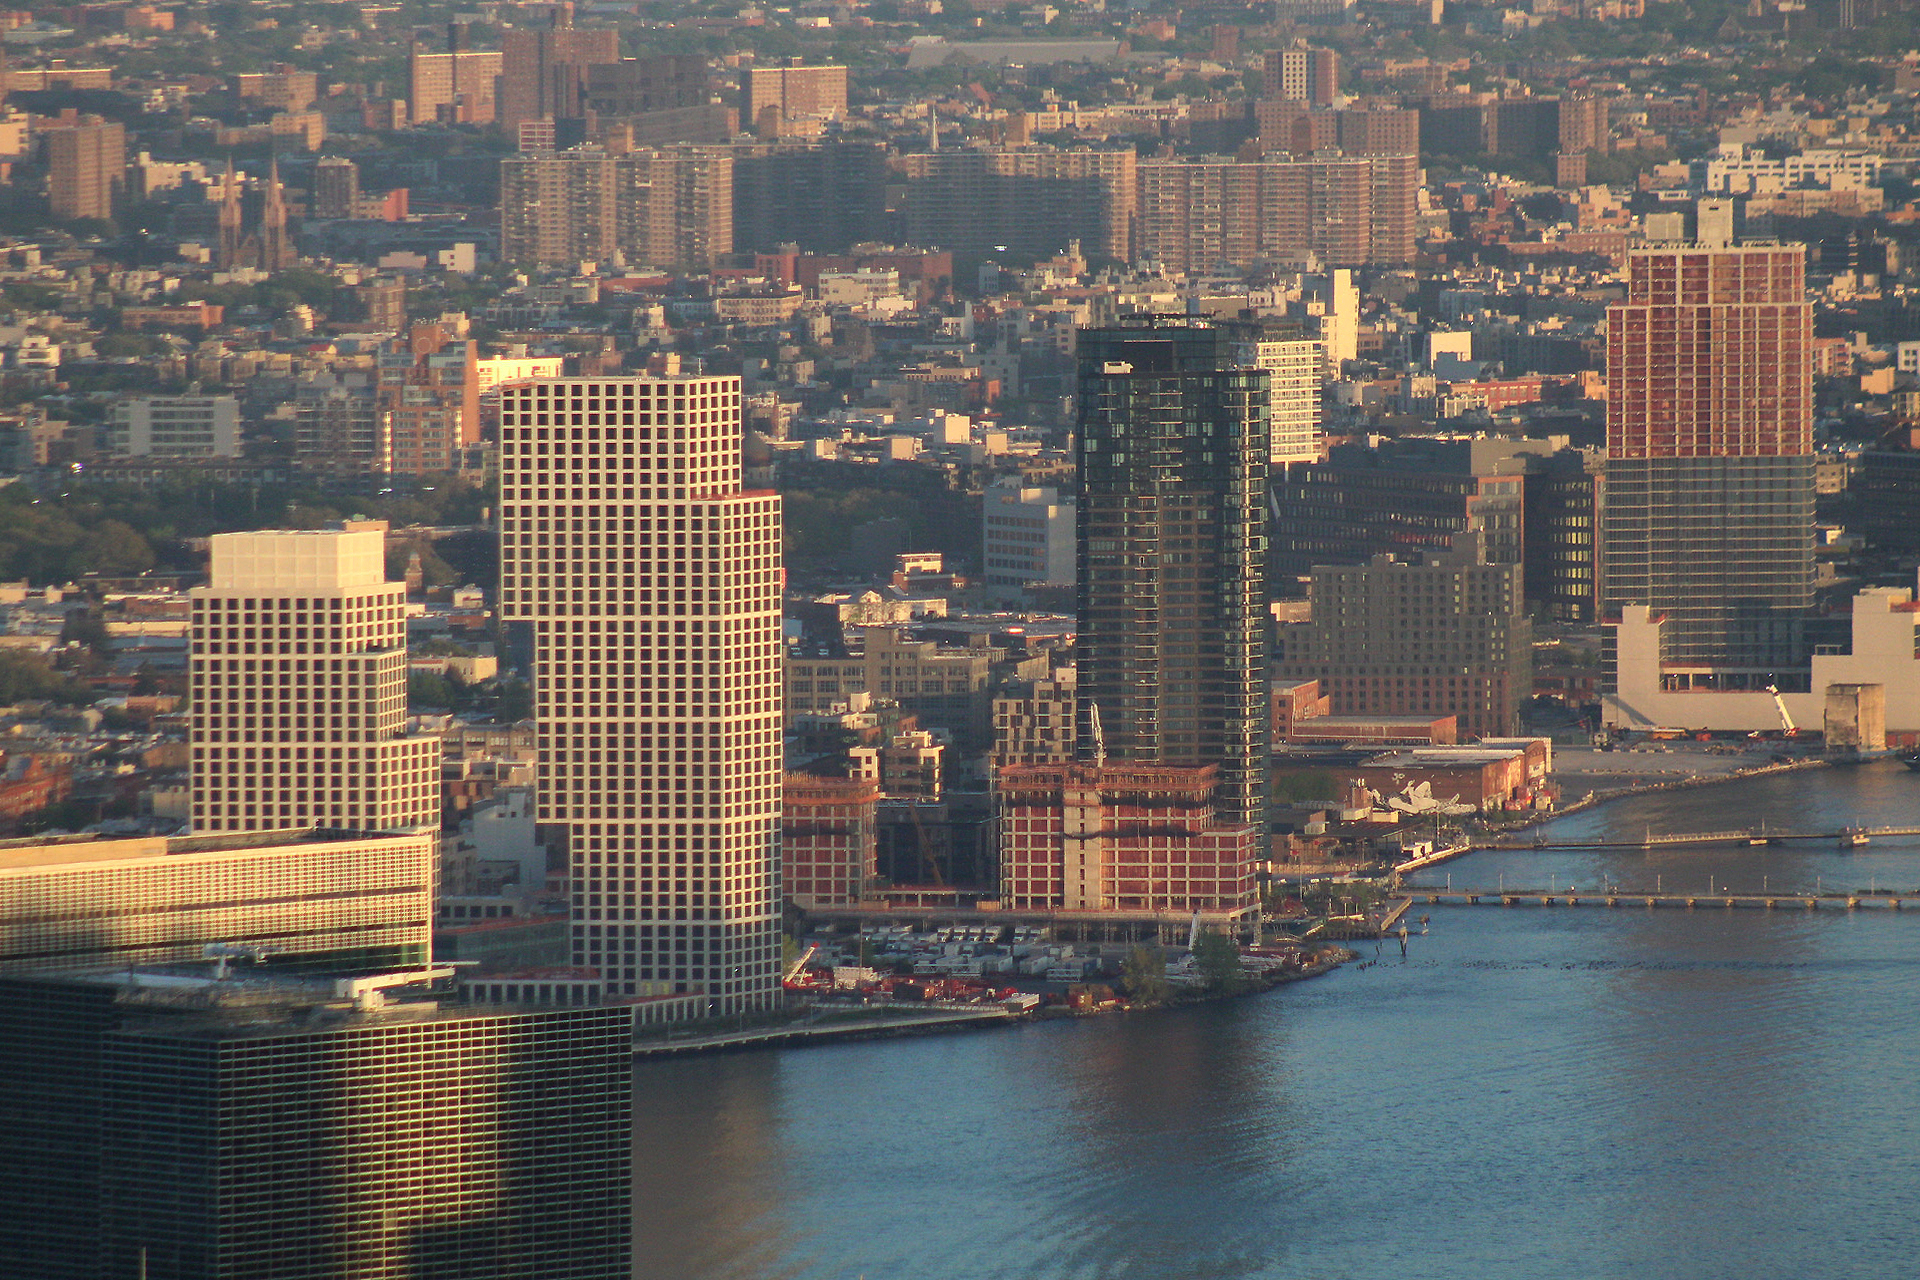
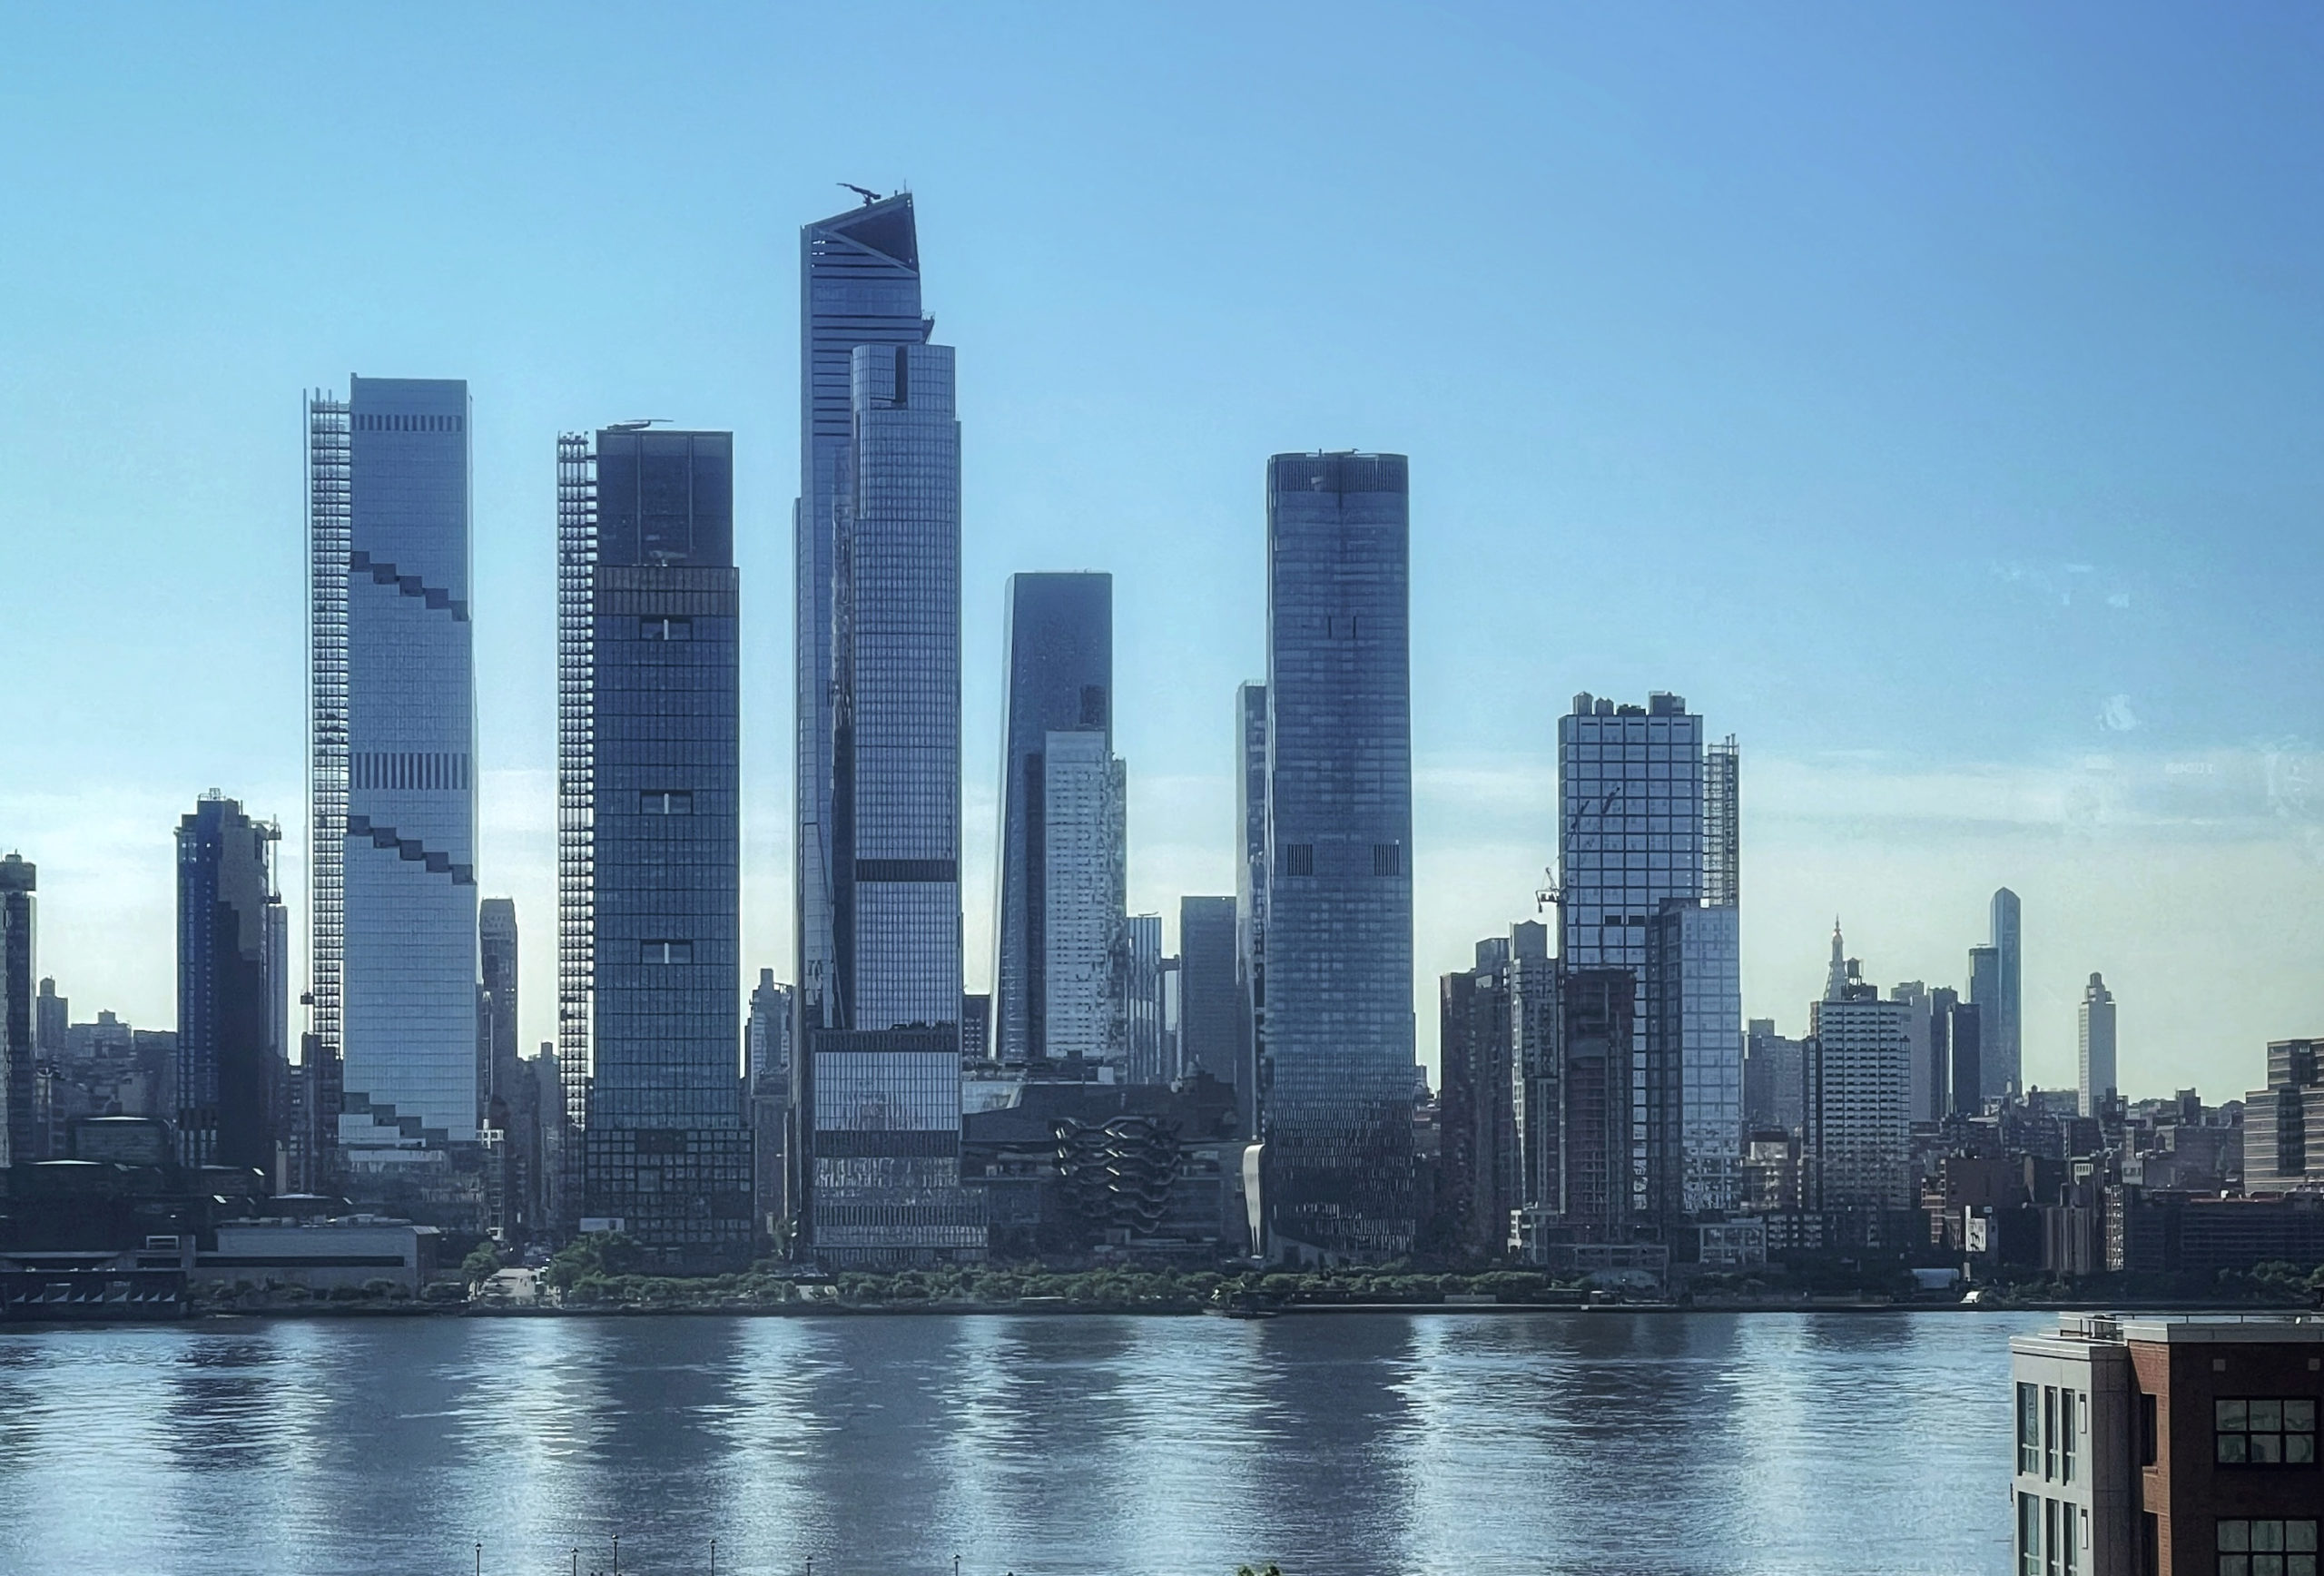
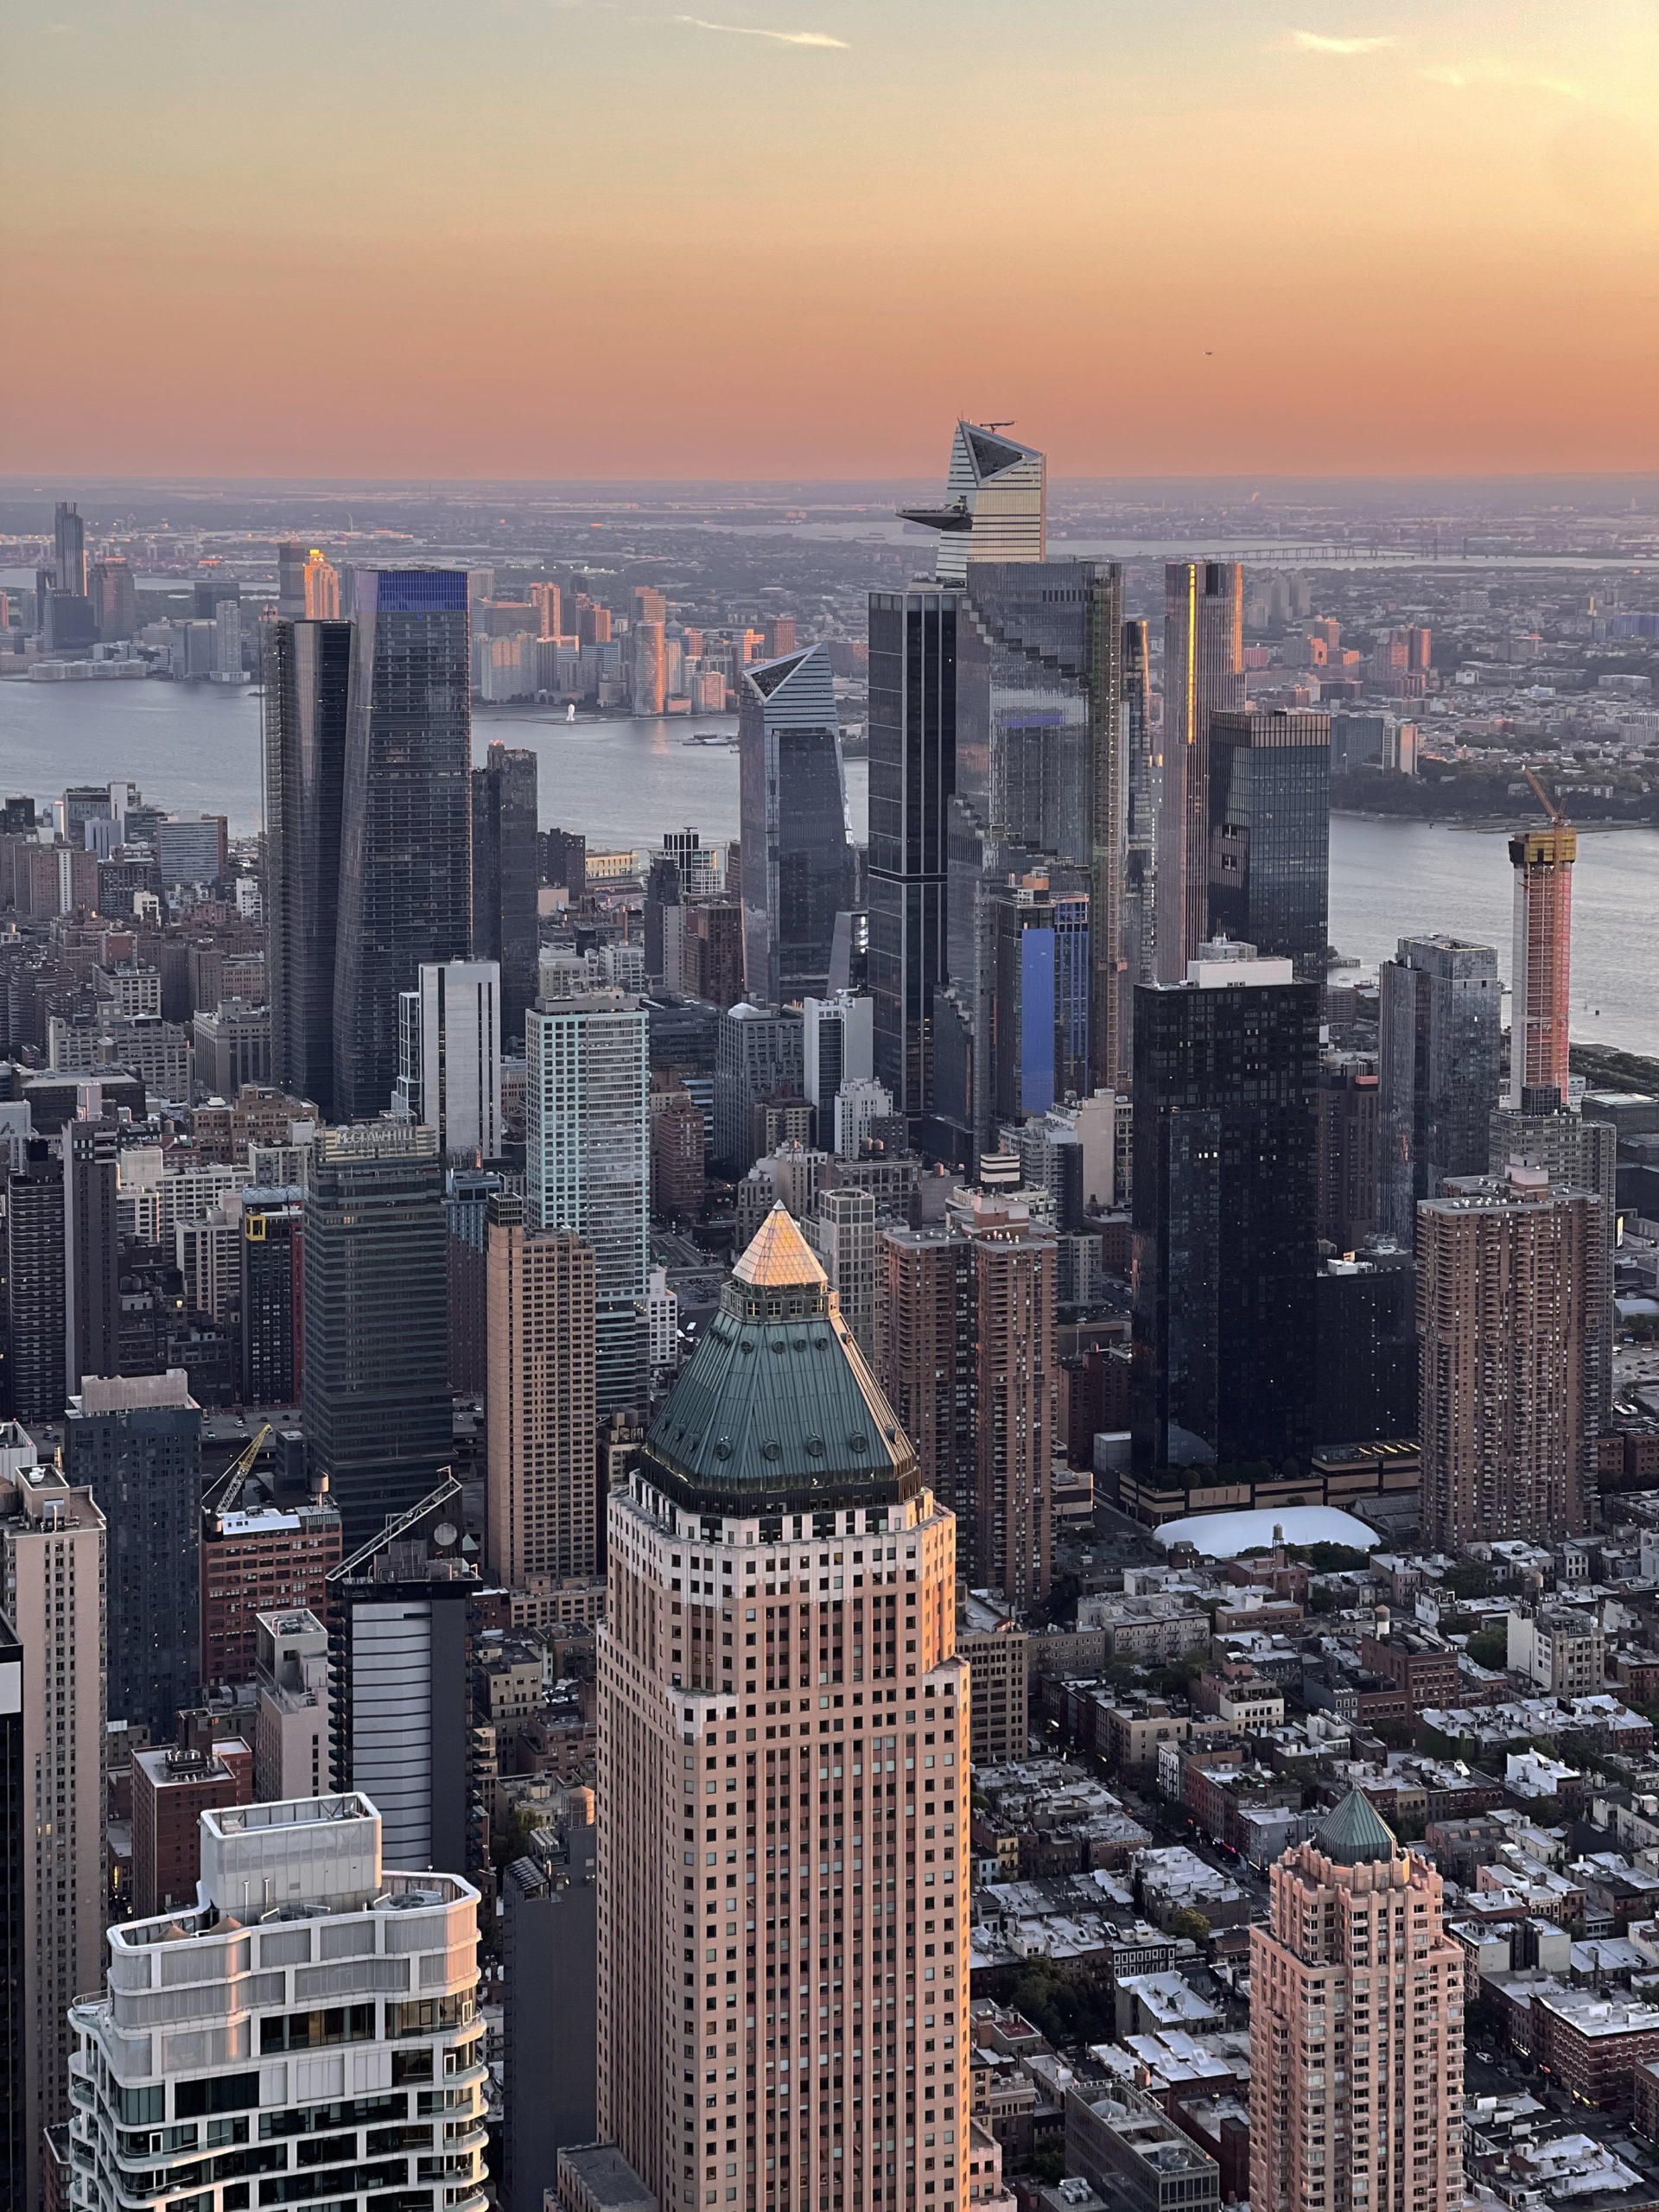
Lower Manhattan. Photo by Michael Young
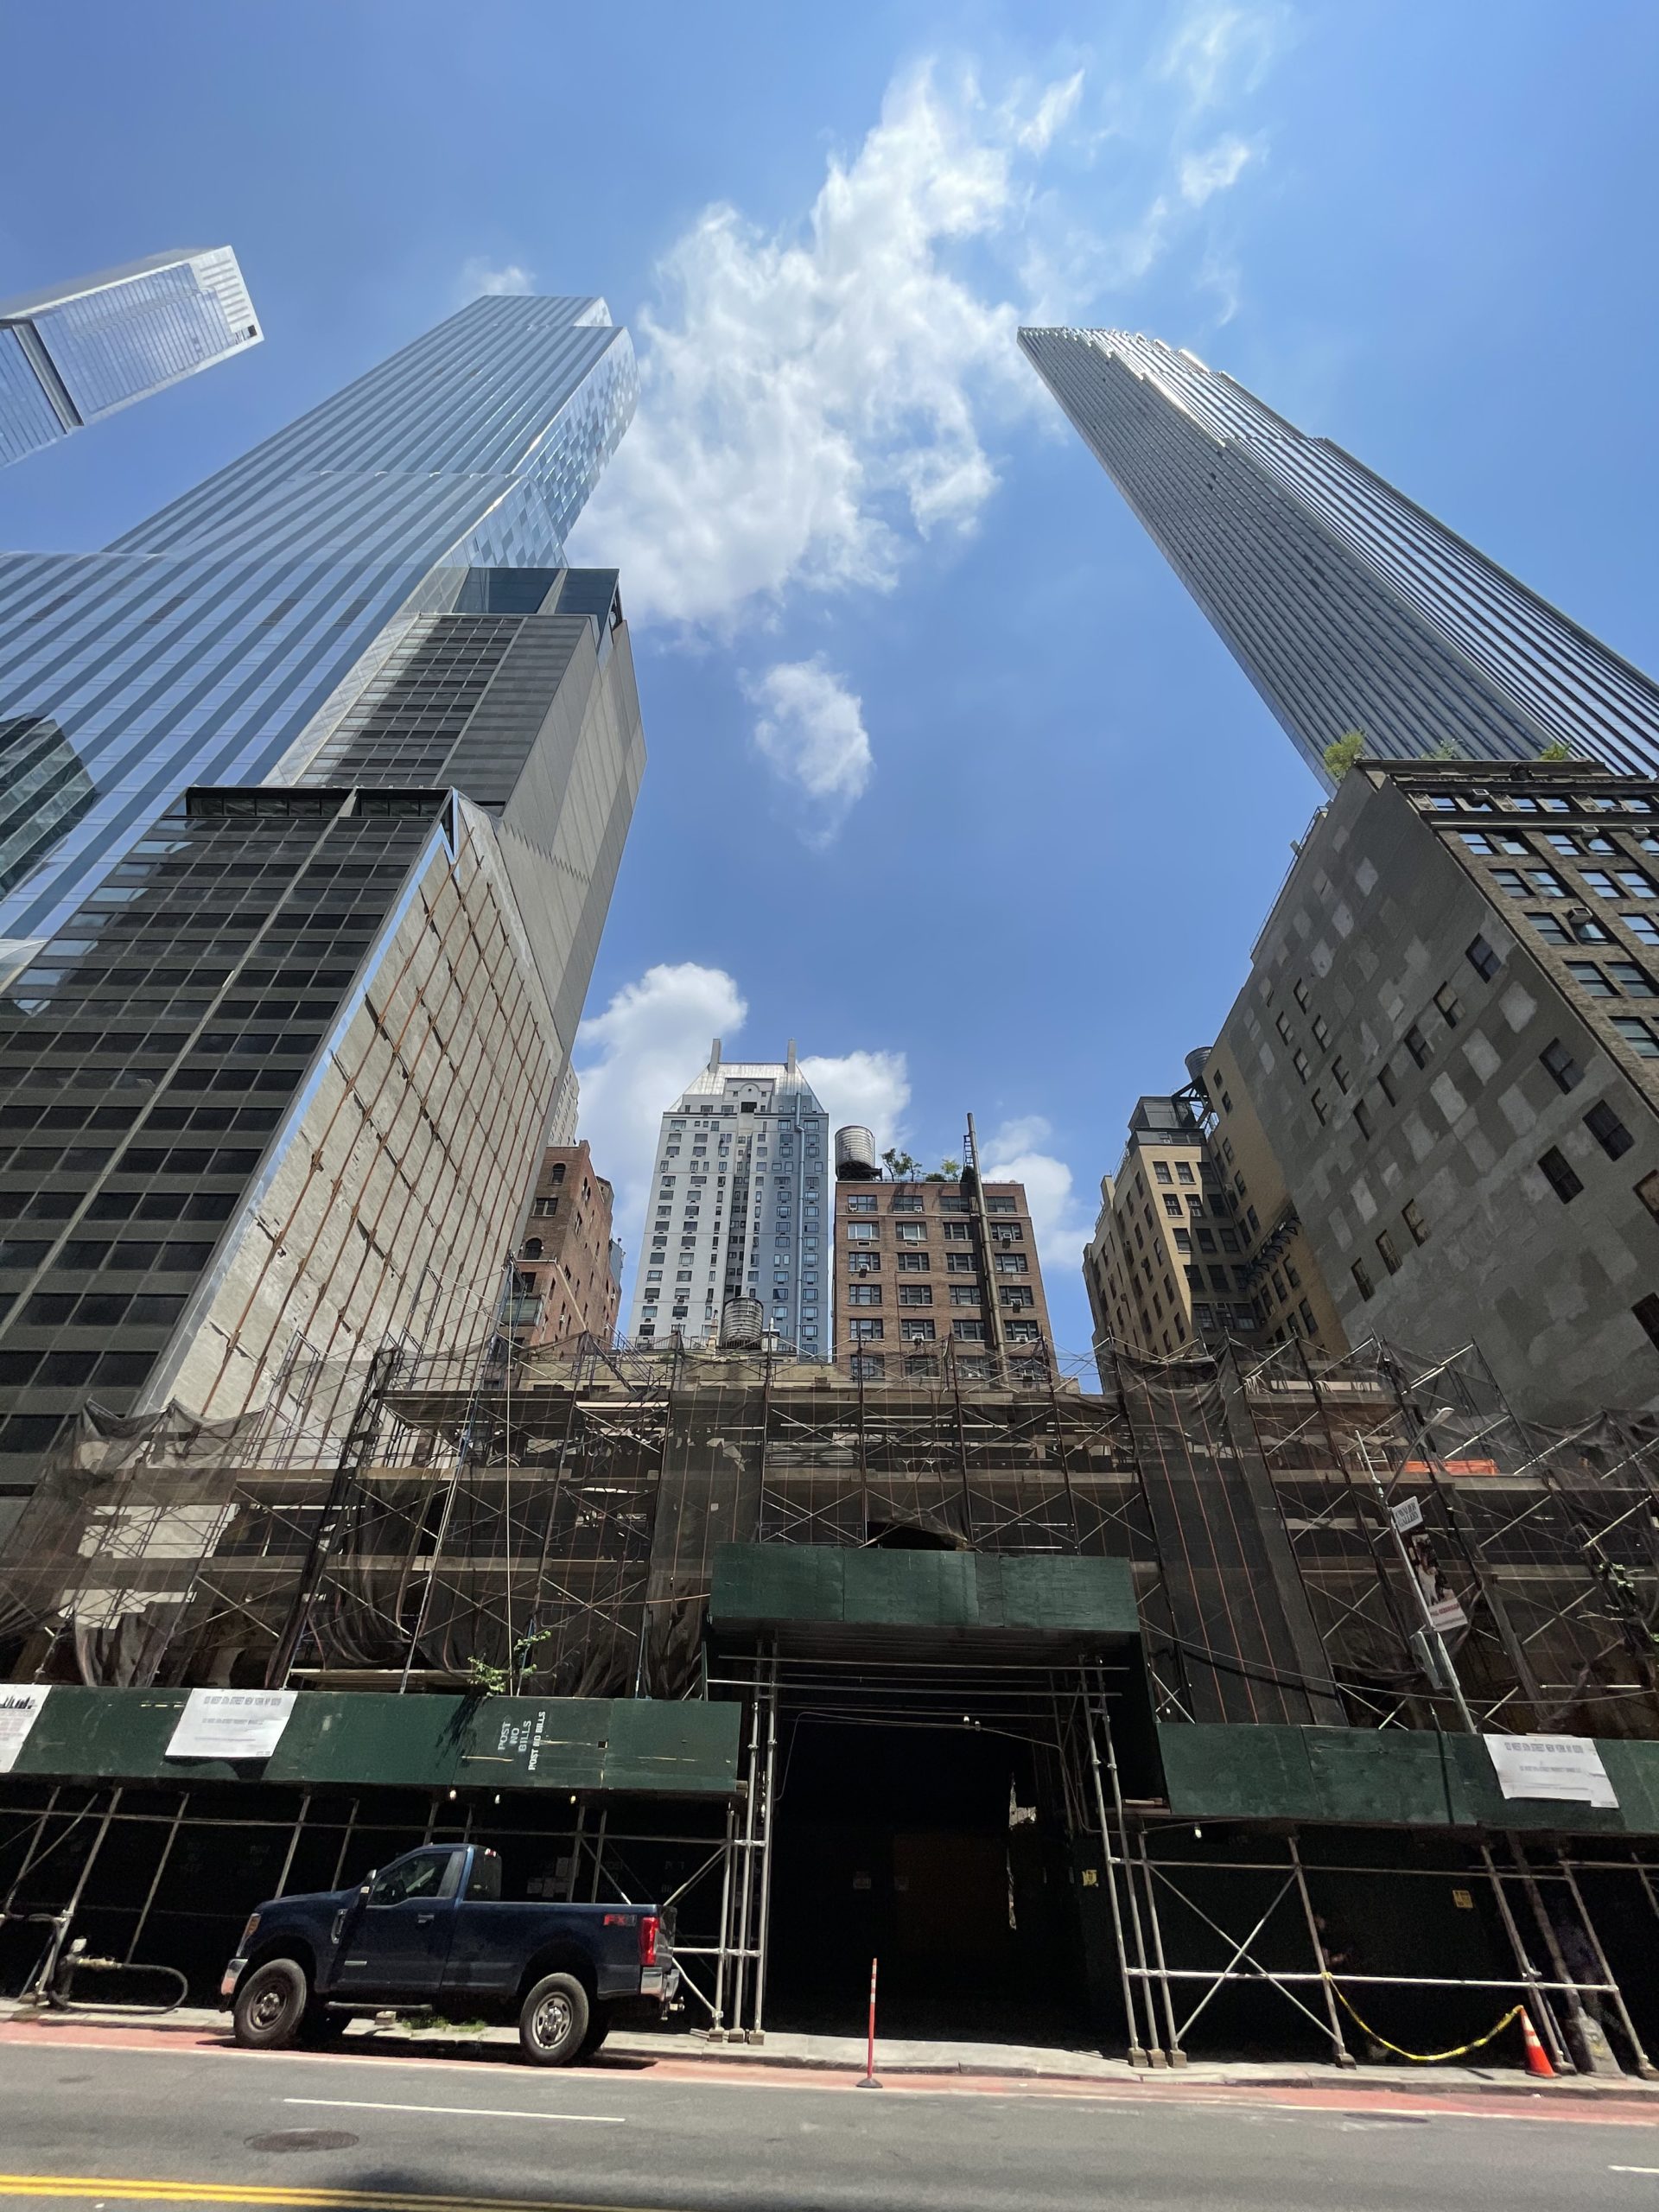
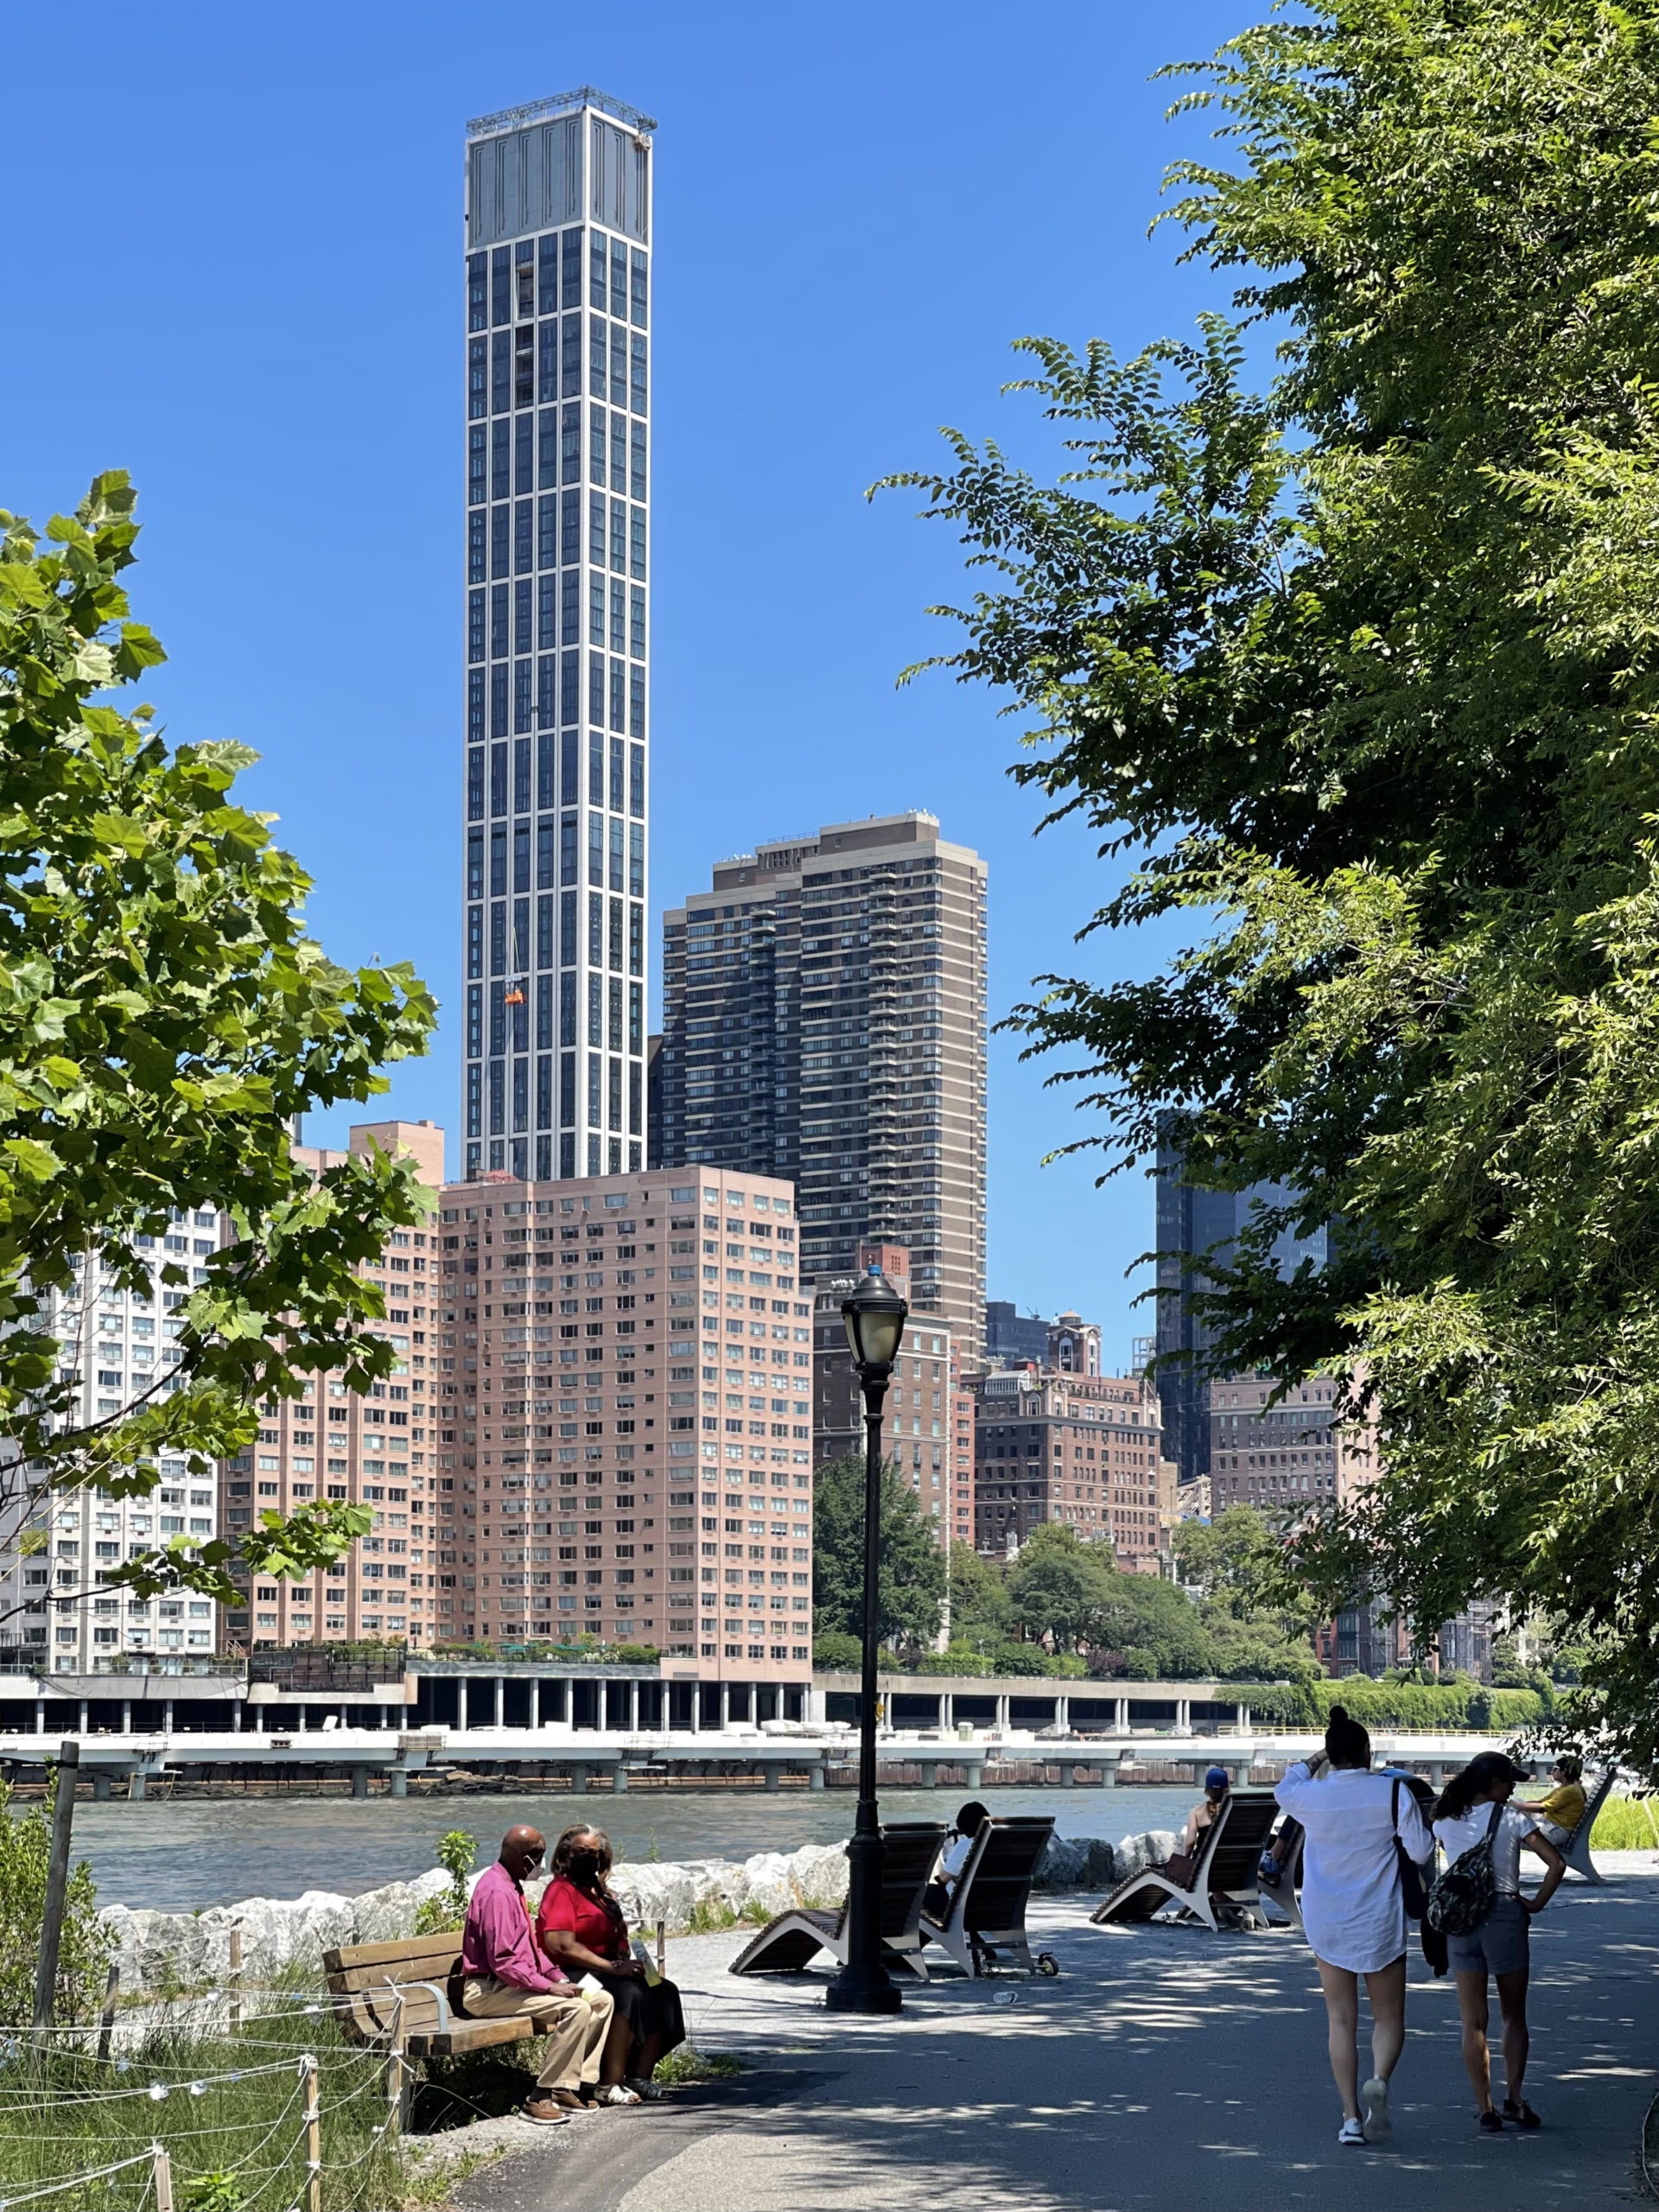
123 West 57th Street. Photo by Michael Young
Number of permit filings by borough
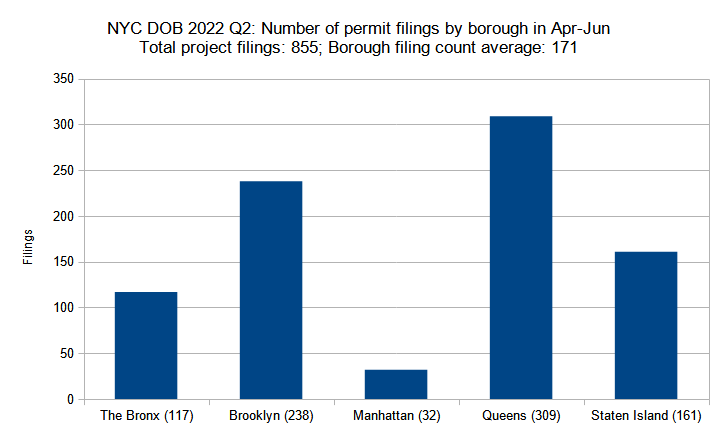
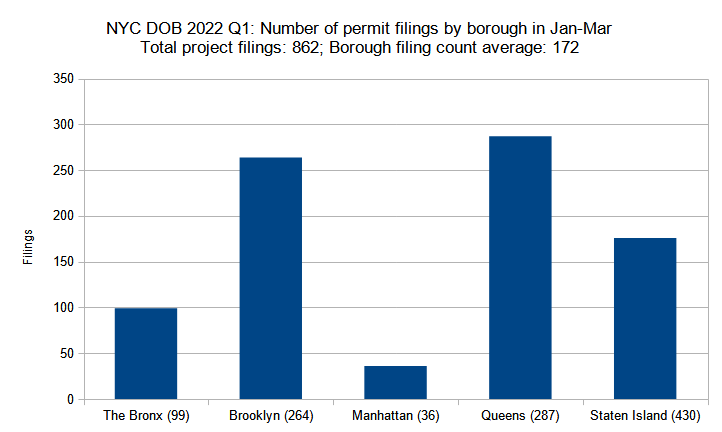
Number of new construction permits filed per borough in New York City in Q2 (April through June) 2022. Data source: the Department of Buildings. Data aggregation and graphics credit: Vitali Ogorodnikov
When comparing the bar graphs for the by-borough breakdown of permit filings for the first versus the second quarter, the similarity of the figures is striking, particularly in their by-share relation between the boroughs.
As before, Queens is well ahead of the pack with a total of 309 permits, slightly above the first quarter’s total of 287. Brooklyn has dipped slightly but still comes in second with 238 permits (versus Q1’s 264). Staten Island remains in third with 161 permits, slightly below Q1’s total of 176. The Bronx again comes in at number four, this time with 117 permits, a slight gain on Q1’s total of 99. Manhattan’s permit count is again by far the lowest, at 32 permits (versus last year’s 36).
The numbers may be explained by the same logic as in the last quarter: The larger boroughs have lower density and thus amass high counts with the majority of their filings for single- and two-family houses and garages. Denser boroughs on the other hand trend toward volume over quantity, with larger projects that are fewer in number.
Two Bryant Park. Photo by Michael Young
The Upper East Side. Photo by Michael Young
Residential and hotel units filed per borough
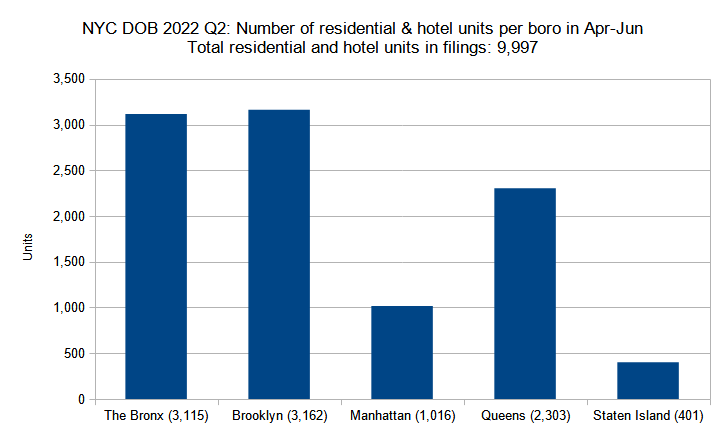
Number of residential and hotel units in new construction permits filed per borough in New York City in Q2 (April through June) 2022. Data source: the Department of Buildings. Data aggregation and graphics credit: Vitali Ogorodnikov
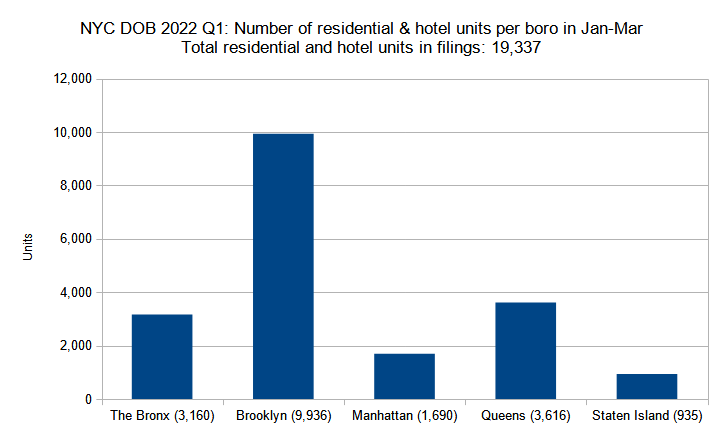
In contrast to the stasis of the previous chart, the dynamic shift between the total number of residential units (in a combined count) is much more intriguing. Of course, the primary difference is that the second quarter’s total unit count is nearly half last quarter’s figure, with 9,997 for Q1 versus 19,337 for Q2.
Just as interesting is the shift within the per-borough unit counts. The Bronx held very steady, with 3,115 units in Q2 versus 3,160 units in Q1, with roughly one-sixth of the total belonging to the 562-unit proposal at 1580 Story Avenue, the project with the highest unit count in the city in Q2. By contrast, the figure for Brooklyn has plummeted from 9,936 in Q1 (almost equal to Q2’s five-borough total) nearly three times, to 3,162 in Q2 (which, curiously, still keeps it in the citywide lead).
Manhattan’s count fell by about a third, from 1,690 units in Q1 down to 1,016 units in Q2. The count for Queens dropped by a similar share, from 3,616 in Q1 down to 2,303 in Q2, with one-fifth of the units coming from the 500-unit development planned at 43-02 Ditmars Boulevard. Staten Island’s count fell by more than 200 percent, from 935 in Q1 to 401 in Q2, with half of the units attributable to the 201-unit development planned at 364 Bay Street, which holds the fourth-highest unit count for any permit in the city in Q2.
The Spiral. Photo by Michael Young
The Huron (center). Photo by Michael Young
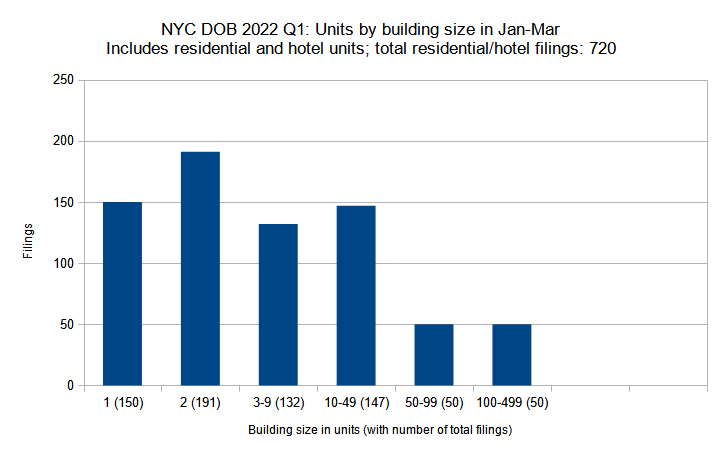
Permits listed by unit count per filing
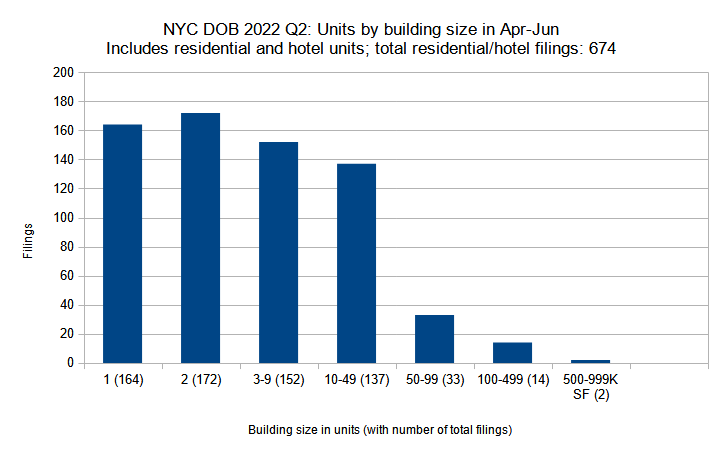
New residential and hotel construction permits filed in New York City in Q2 (April through June) 2022 grouped by unit count per filling. Data source: the Department of Buildings. Data aggregation and graphics credit: Vitali Ogorodnikov
So what is behind such a drastic drop-off for the total unit count between the first and the second quarters? Although the following analysis, which groups permits by size via unit counts, may not explain the full picture, it at least reveals one particular trend: a notable decrease in filings for high-density buildings.
Between the first and second quarter, filing counts remained rather consistent for categories ranging from single-family houses to medium-sized apartment buildings (up to 49 units). The single-family house filings went from 150 in Q1 to 164 in Q2. Two-family house filings dipped slightly from 191 filings and a total of 382 units in Q1 to 172 filings and a total of 344 units in Q2.
The stats for the small apartment buildings and hotels (three to nine units) rose from 132 filings with a total of 382 units in Q1 to 152 filings and 848 units in Q2. The medium apartment building and hotel category (ten to 49 units) slid from 147 filings with a total of 3,392 units in Q1 to 137 filings with a total of 3,105 units in Q2.
The next two categories, which account for large apartment buildings, are responsible for the significant drop in the total unit count between the two quarters. The group with filings with 50 to 99 units dropped from 50 filings with 3,614 units in Q1 to 33 filings with 2,263 units in Q2, although this figure is still well above last year’s quarterly average of 23. More notably, the group with planned buildings with 100 to 499 units plunged from 50 filings and 11,075 units in Q1 down to 14 filings and just 2,212 units in Q2, falling below last year’s quarterly average of 24 filings.
Curiously, the largest filings observed in the second quarter, the 562-unit development at 1580 Story Avenue in The Bronx and the 500-unit development proposed at 43-02 Ditmars Boulevard in Queens, are larger than any filing observed in the first quarter, none of which surpassed the 500-unit mark.
The Spiral. Photo by Michael Young
Sutton Tower. Photo by Michael Young
Permit filings by floor count categories
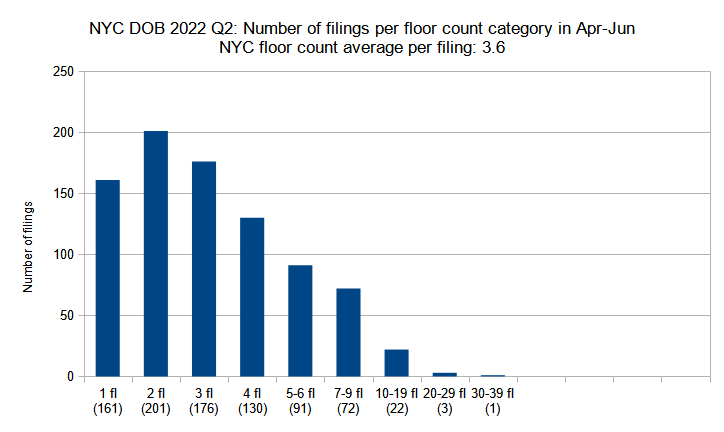
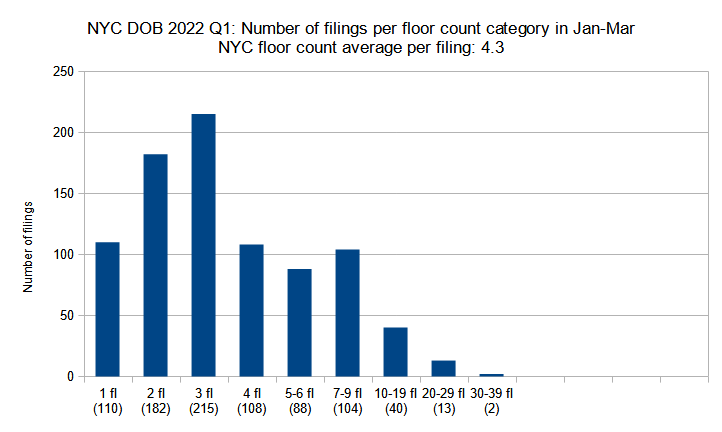
New construction permits filed in New York City in Q2 (April through June) 2022 grouped by floor count. Data source: the Department of Buildings. Data aggregation and graphics credit: Vitali Ogorodnikov
In the previous analysis, we discovered that the second quarter of 2022 shows a significantly decreased number of filings for large apartment buildings and hotels compared to the first quarter of the year. Since larger unit counts generally translate to greater height (aside from rare exceptions such as slender luxury supertall towers), we may also expect a lower filing count for buildings with more floors.
Regrettably for skyline watchers, the numbers reciprocate the expectation. While low- and mid-rise filings (six floors and under) have remained generally consistent since the previous quarter, filings for taller buildings have dipped significantly. This results in a lowering in average floor count per filing from 4.3 in Q1 down to 3.6 in Q2, a startling decrease from a figure that has stayed remarkably consistent for some time, averaging 4.1 floors per filing in 2020 and 4.3 in 2021.
Single-story buildings saw the greatest increase between Q1 and Q2, increasing by around half from 110 to 161. Two-story filings saw a slightly lower growth, rising from 182 to 201. Significant growth in these two low-rise categories, rather than just a sheer drop-off in high-rise filings, also makes a significant impact on the lower quarterly floor count average.
In turn, three-story filings dipped slightly, from 215 in Q1 down to 176 in Q2. Four-story filings rose from 108 in Q1 to 130 in Q2. Five- and six-story filings also rose slightly, from 88 in Q1 to 91 in Q2.
From here on, the figures trend steadily downward. Filings for mid-high-rise buildings (seven to nine floors) dipped by just over a quarter, from 104 in Q1 down to 72 in Q2. Filings in the ten- to 19-story category lowered nearly by half, from 40 in Q1 to 22 in Q2. Filings in the 20-29-story category plummeted from 13 in Q1 to just three in Q2. Finally, filings in the 30-39-floor category have decreased from two to one.
The five buildings with the highest floor counts that arrived on the permit lists in the second quarter were 567 Third Avenue (34 stories) and 76 Varick Street (27 stories) in Manhattan, 6128 8th Avenue (21 stories) and 88 Schermerhorn Street (20 stories) in Brooklyn, and 24-03 Queens Plaza North and 1580 Story Avenue (19 stories each) in Queens and The Bronx, respectively.
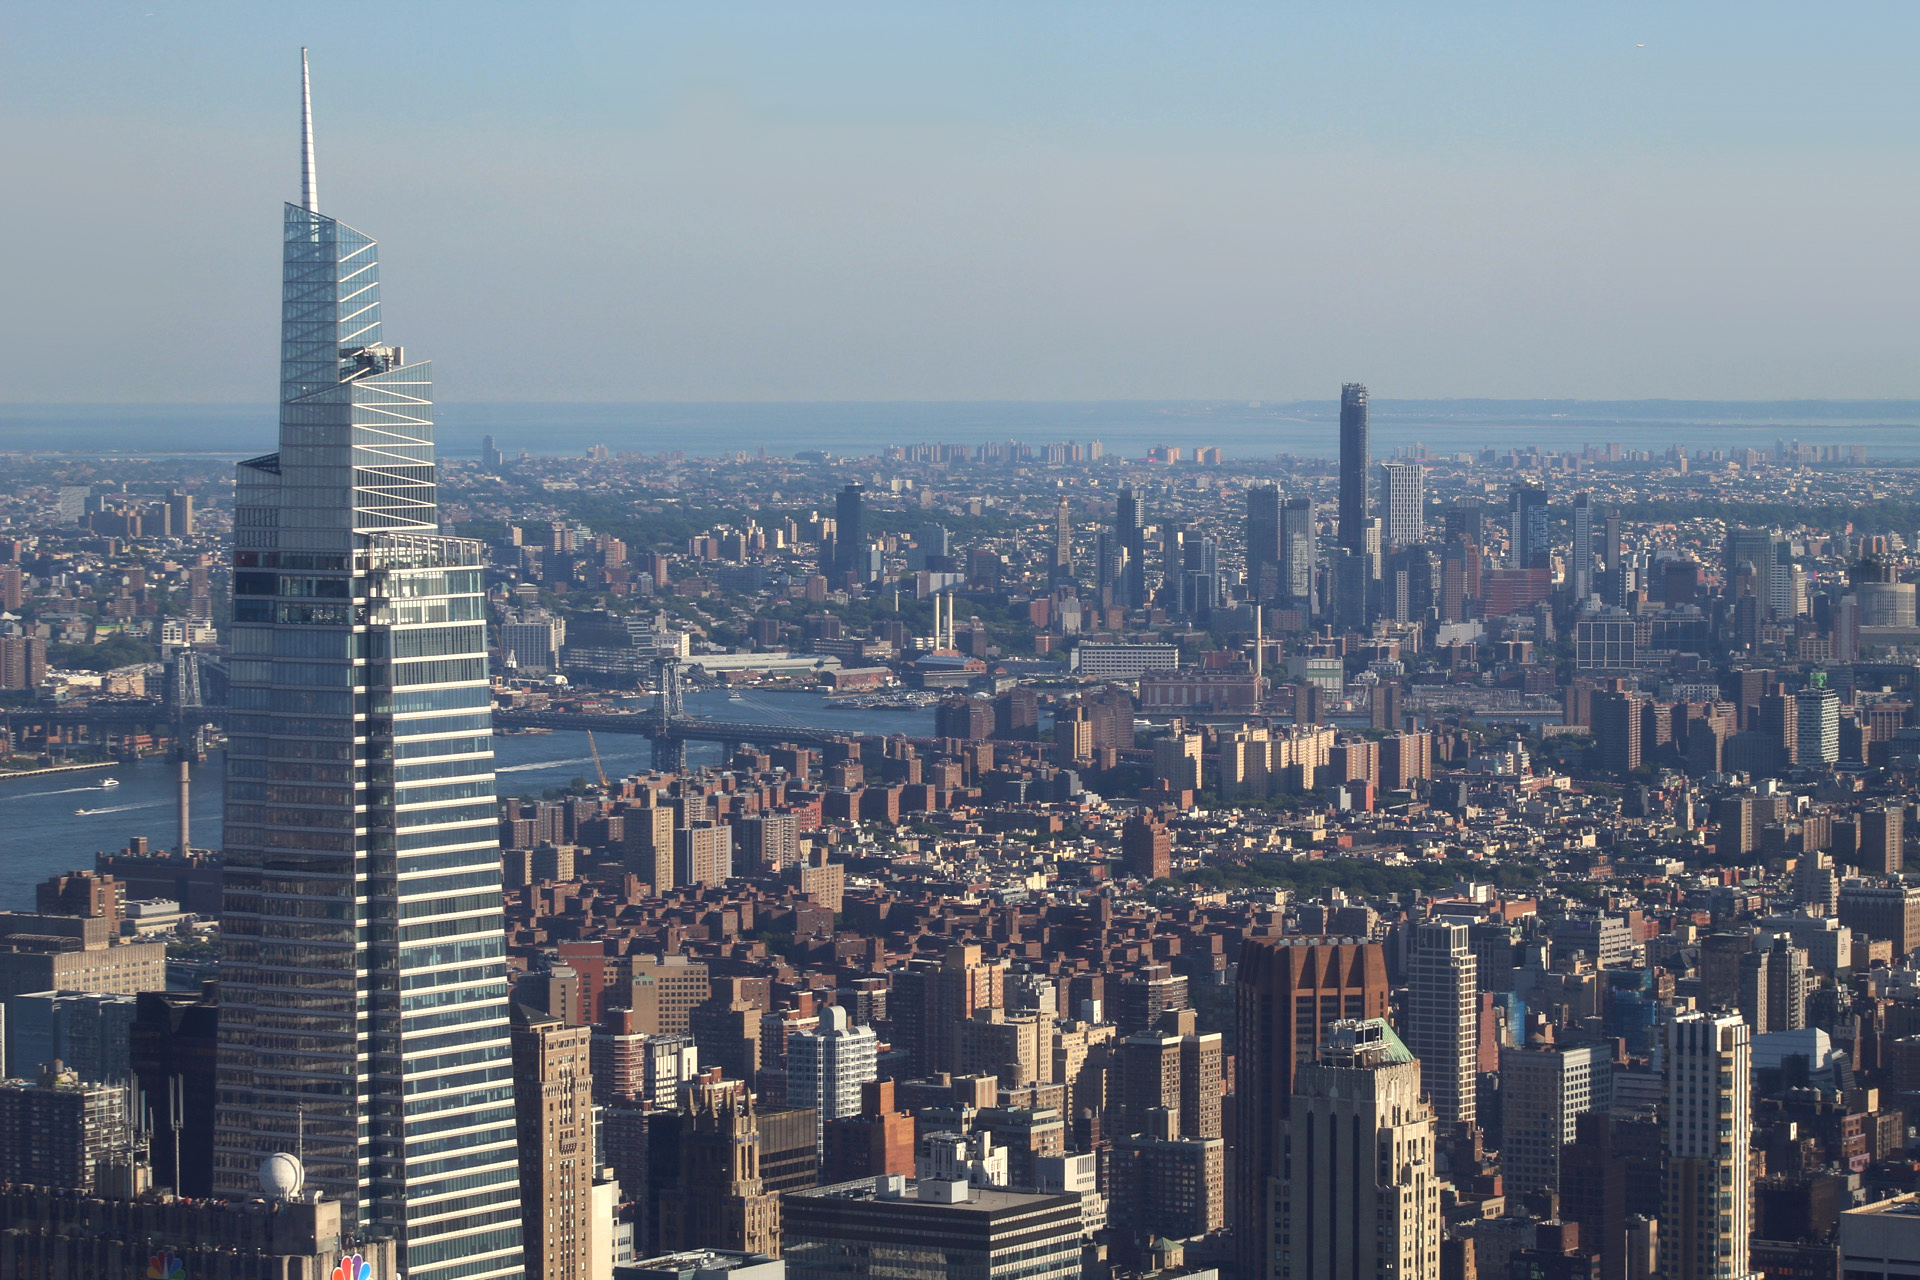
One Vanderbilt, the East River, and Downtown Brooklyn skyline. Photo by Michael Young
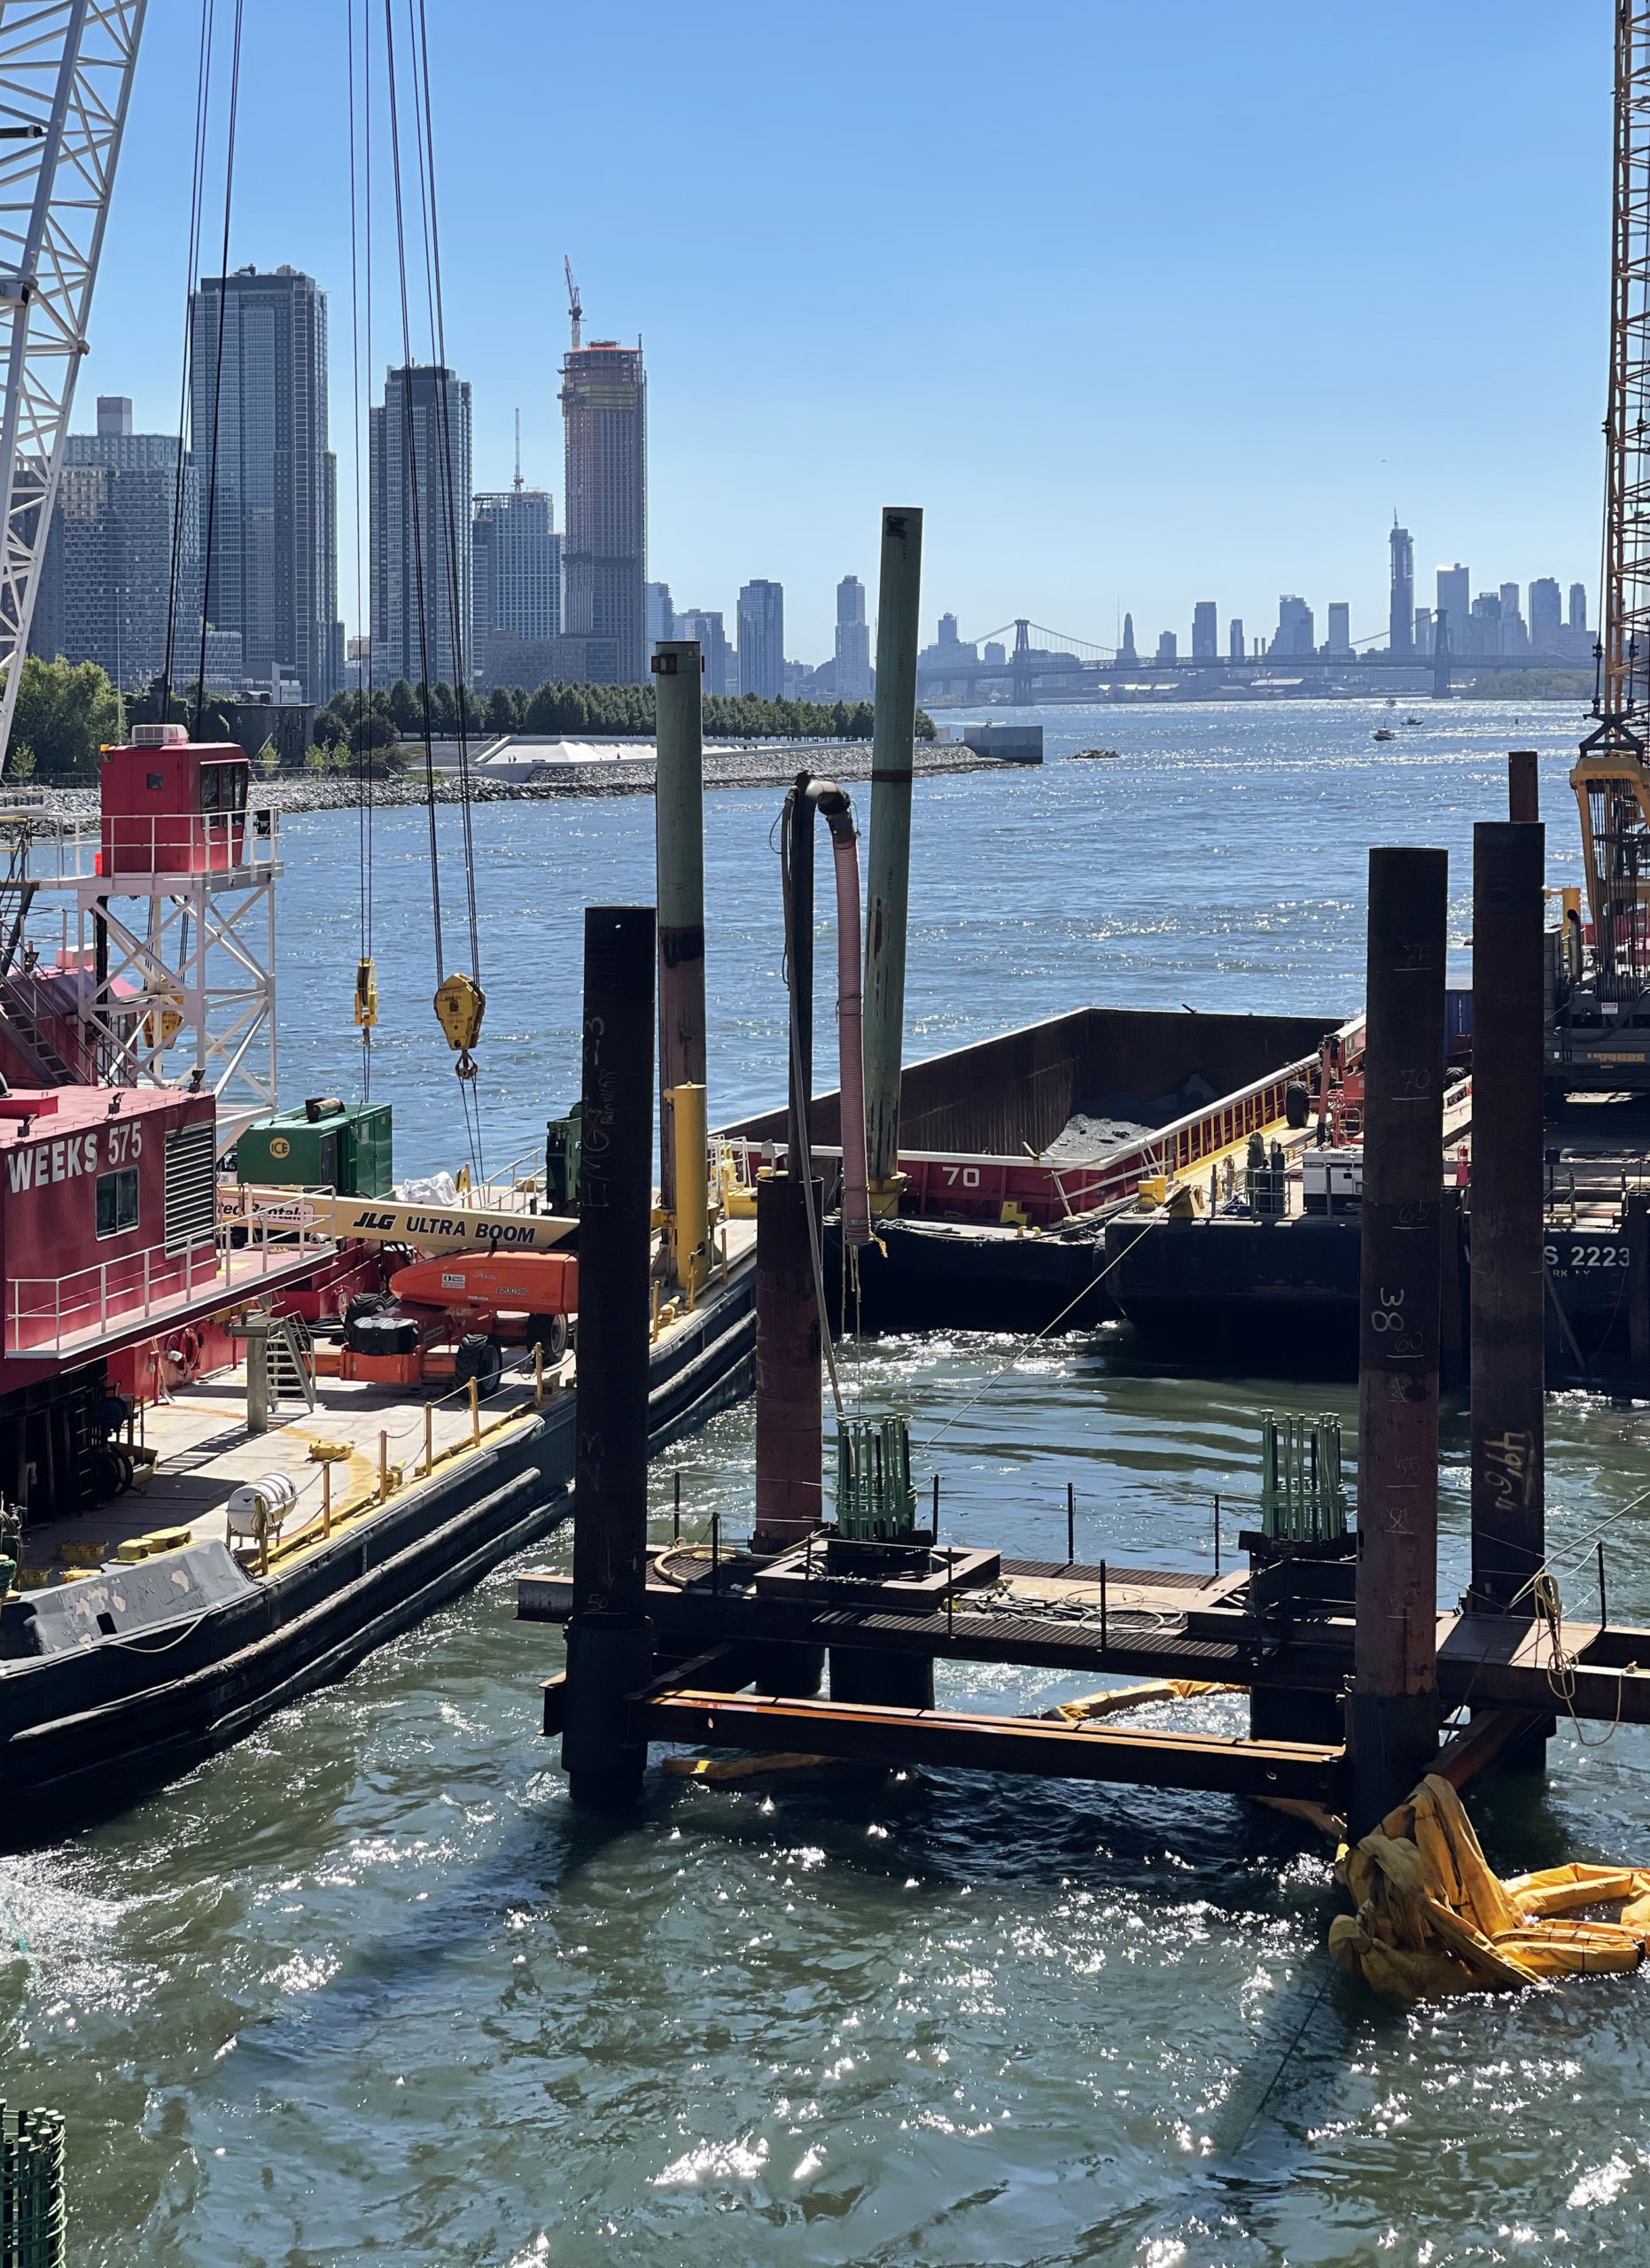
Photo by Michael Young
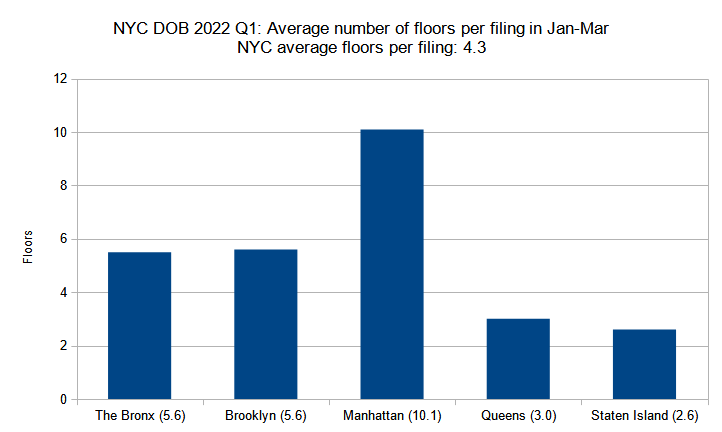
Average number of floors per filing per borough
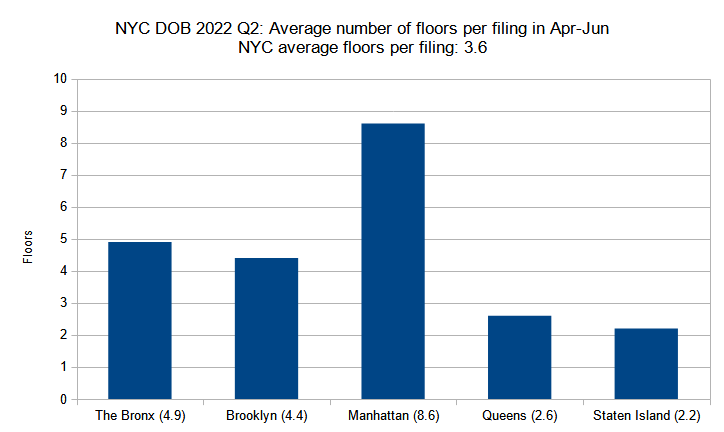
Average number of floors per new construction permit per borough filed in New York City in Q2 (April through June) 2022. Data source: the Department of Buildings. Data aggregation and graphics credit: Vitali Ogorodnikov
When tallied by average floor count per filing by borough, the pattern for the second quarter of 2022 continues to reflect the established trend. Predominantly mid- and high-rise Manhattan has by far the highest average floor count; the still-dense but flatter Brooklyn and The Bronx are notably lower; Queens and Staten Island, with their wide swathes of lower-density housing (particularly Staten Island), register lower still.
However, responding to the above-mentioned trend of fewer high-rise filings, floor count averages for each borough lowered rather proportionally. Manhattan dipped from 10.1 floors per average filing in the first quarter down to 8.8 in the second quarter; The Bronx lowered from 5.6 in Q1 to 4.9 in Q2; Brooklyn decreased from 5.6 in Q1 to 4.4 in Q2; Queens slipped from 3.0 in Q1 to 2.6 in Q2; and Staten Island decreased from an average of 2.6 in Q1 down to 2.2 in Q2.
For those keeping track, last year’s averages were 15.1 floors for Manhattan, 5.3 for Brooklyn, 5.2 for The Bronx, 3.0 for Queens, and 2.3 in Staten Island.
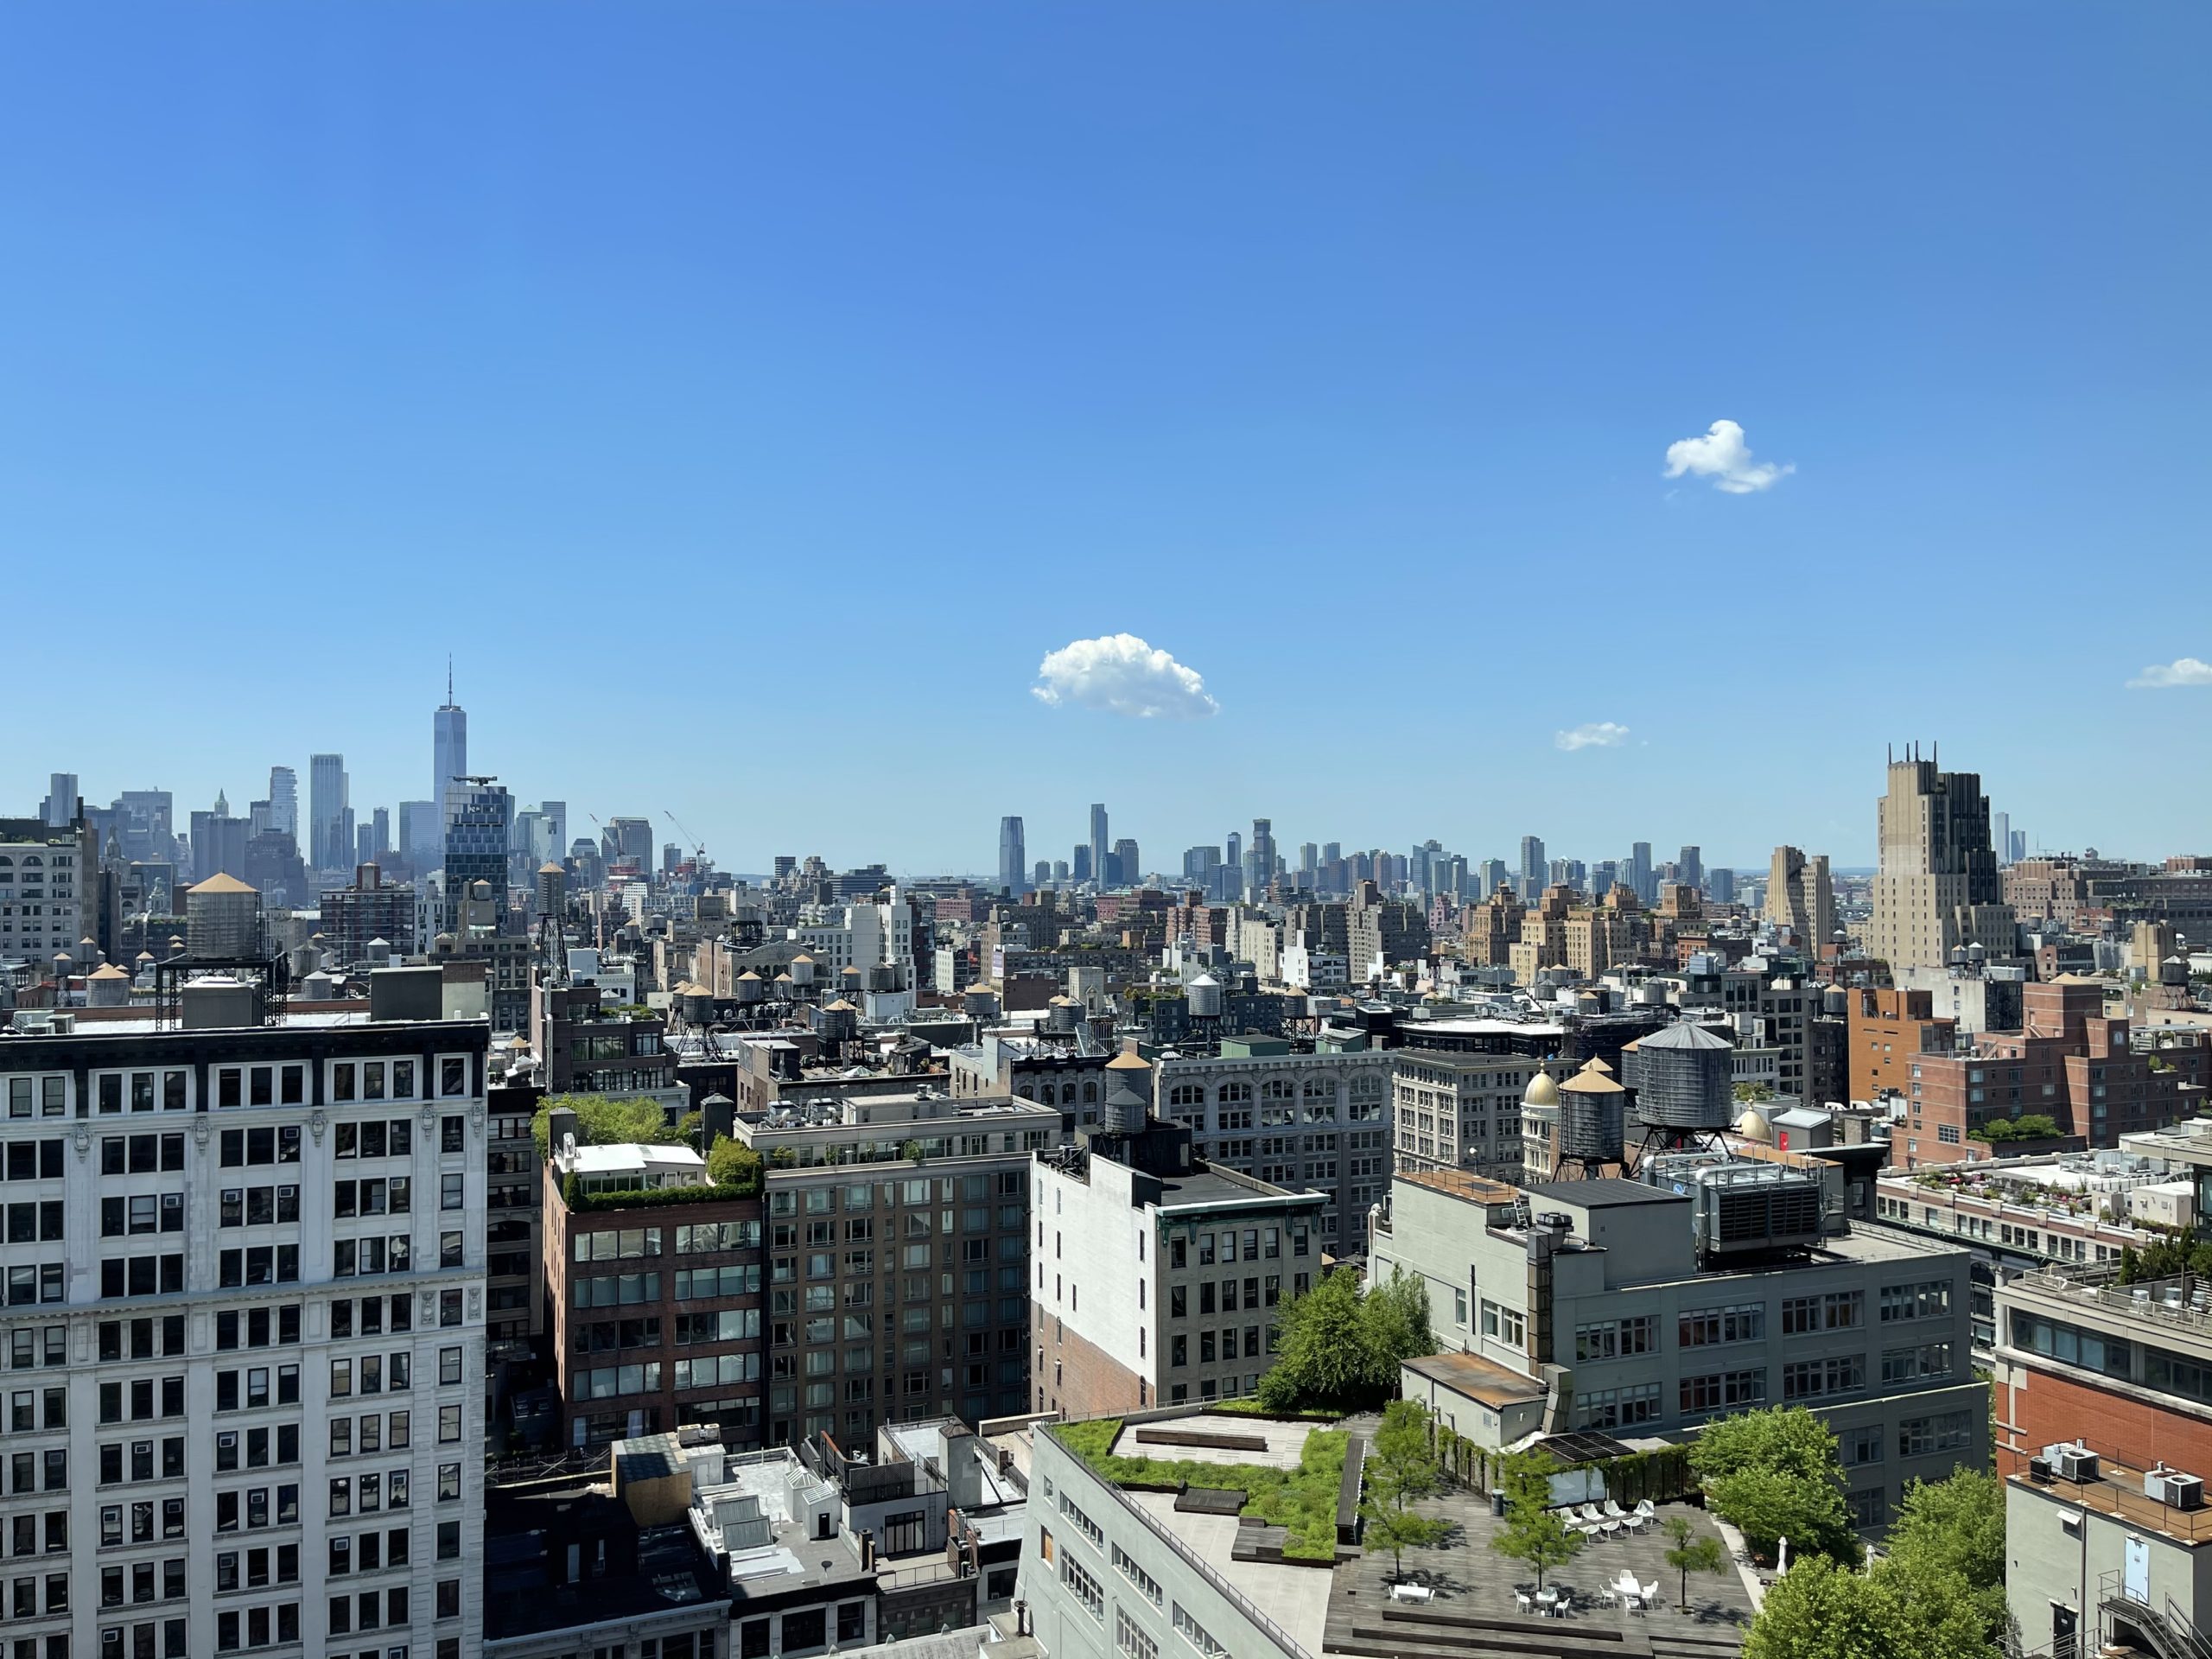
Photo by Michael Young
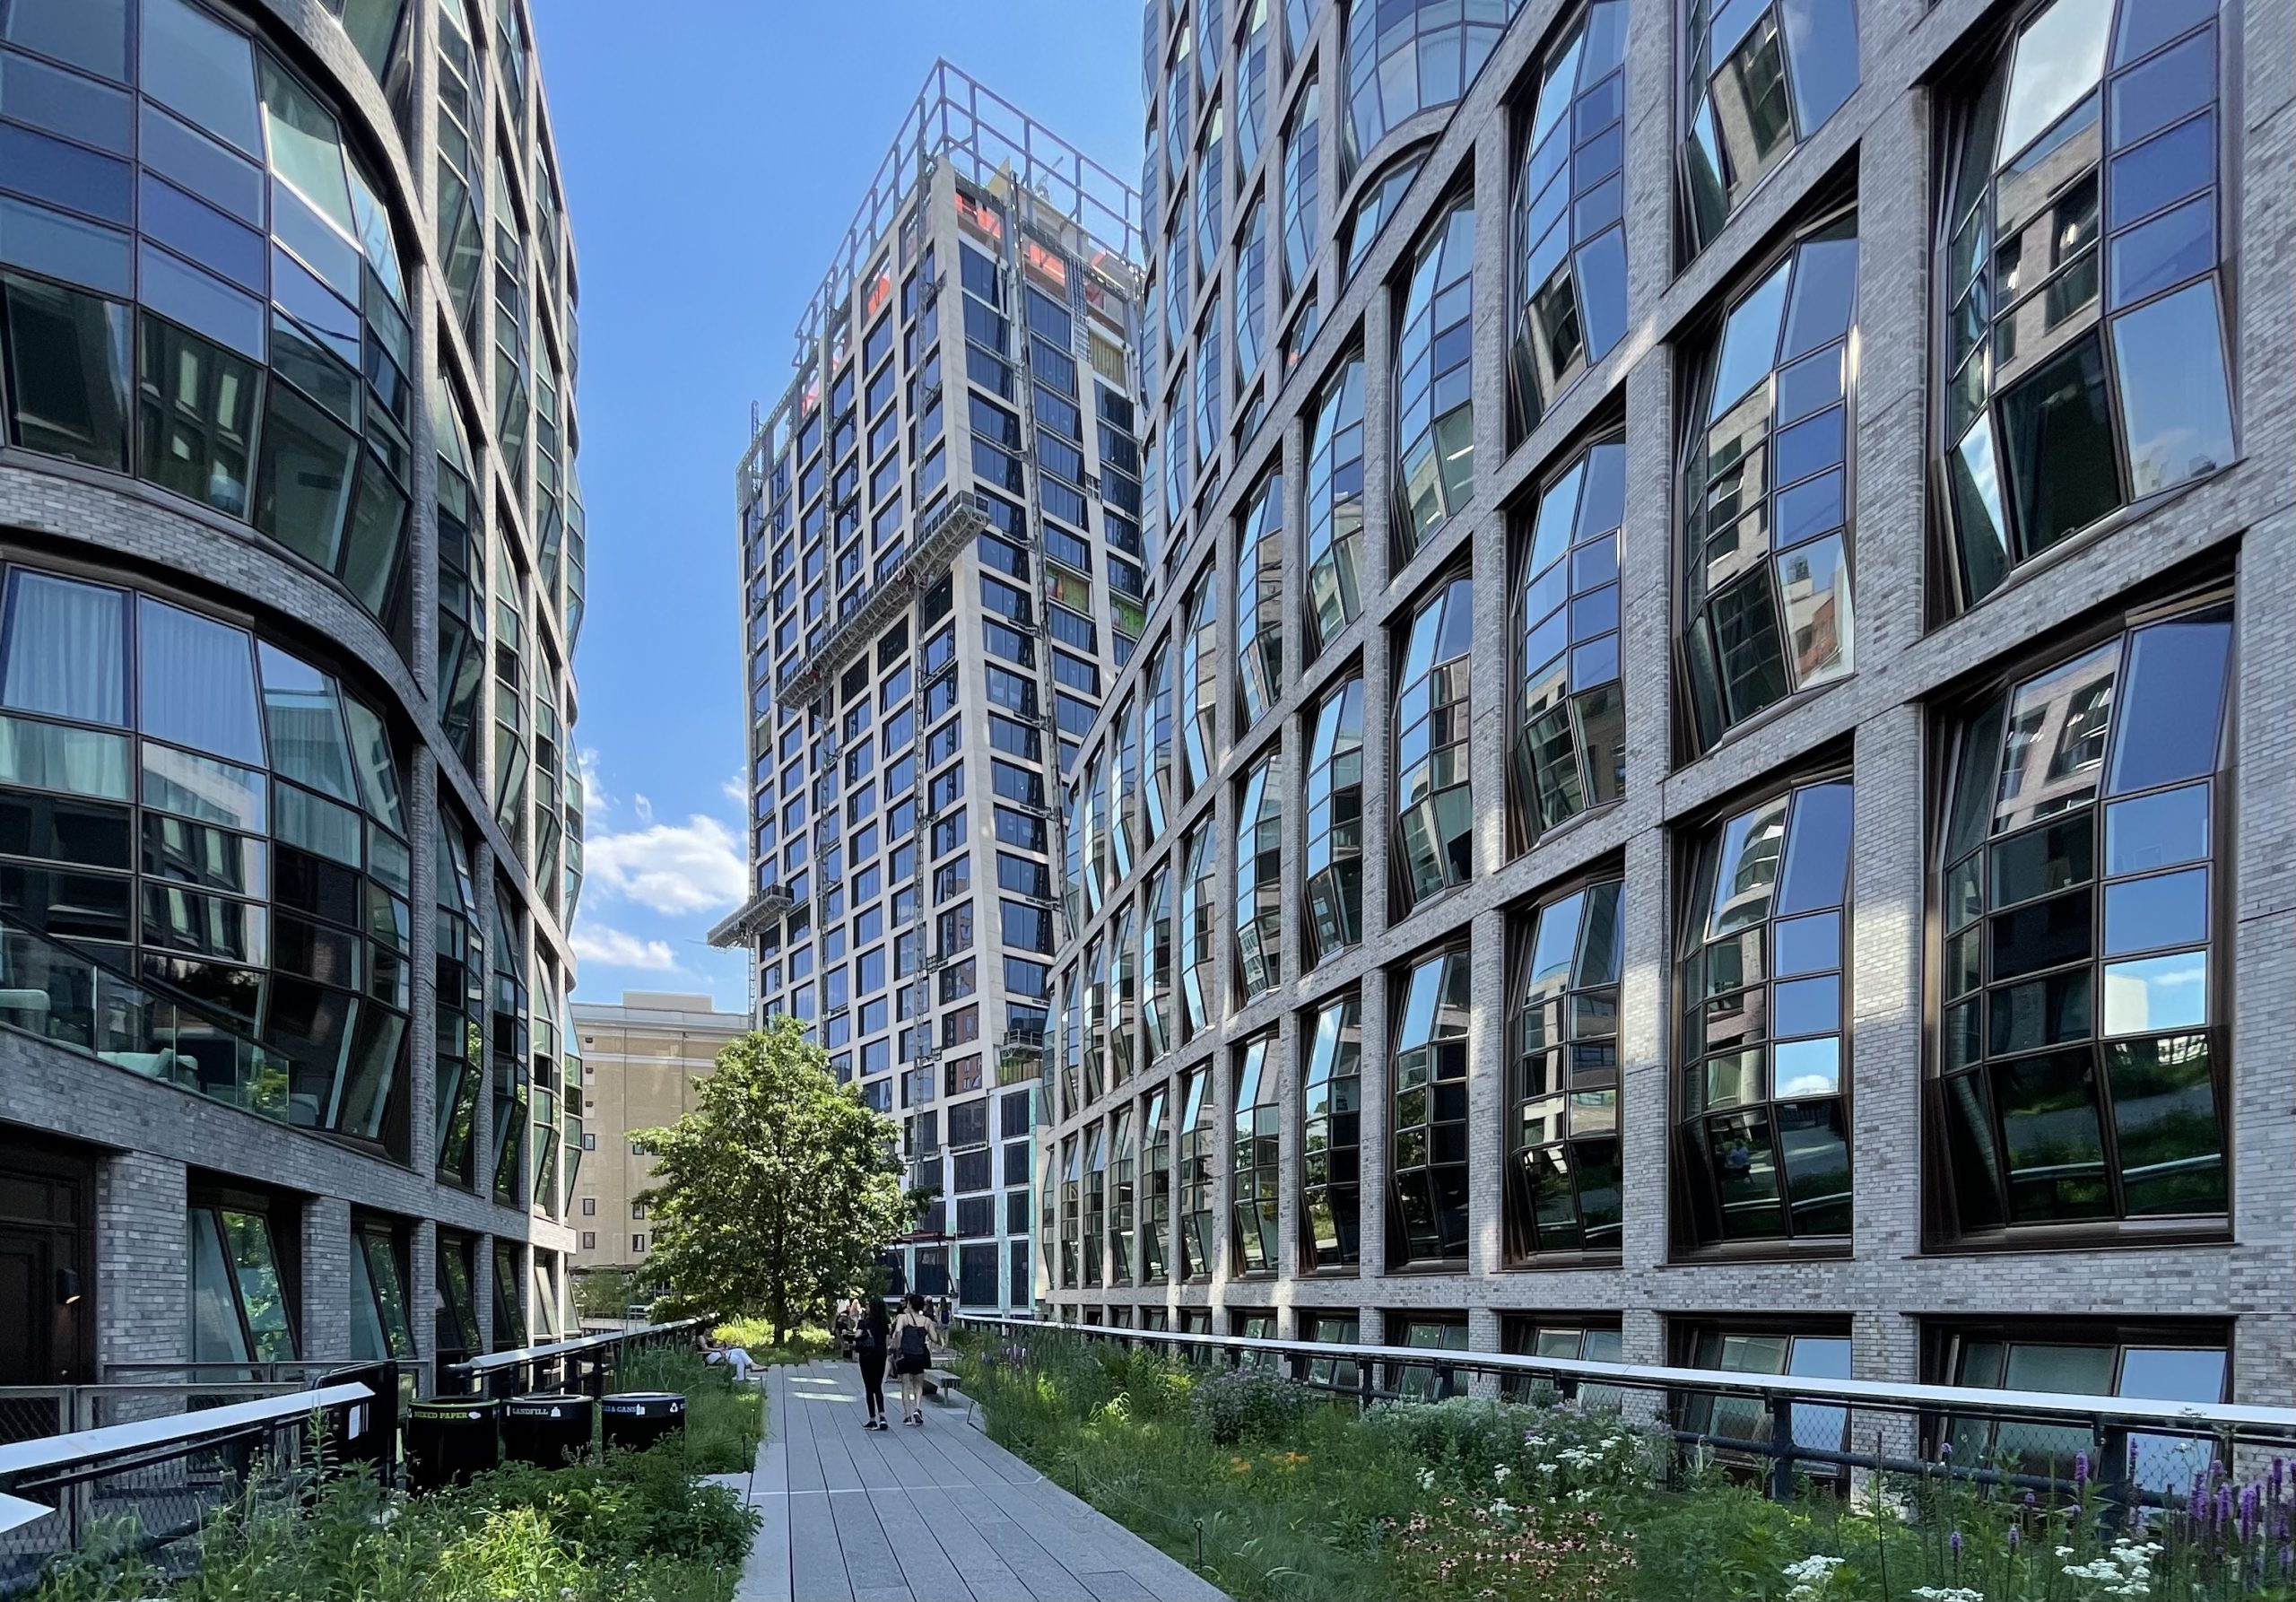
One High Line. Photo by Michael Young
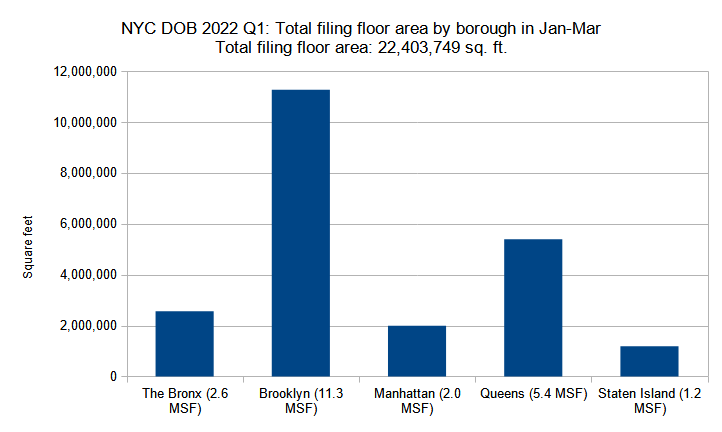
Total floor area filed by borough
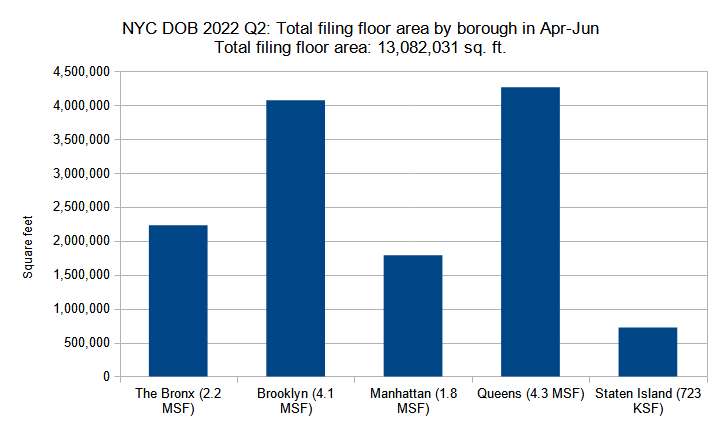
Combined floor area of new construction permits filed per borough in New York City in Q2 (April through June) 2022. Data source: the Department of Buildings. Data aggregation and graphics credit: Vitali Ogorodnikov
Although the total filing count has remained virtually the same between the first and second quarters of 2022, the precipitous drop in total unit counts combined with the fact that a large number of behemoth-sized office buildings are already under construction rather than still on the drawing boards, it is hardly surprising to see a concurrent drop in total filing floor area. Namely, the figure has decreased by 42 percent, from 22.4 million square feet in Q1 down to 13.1 million square feet in Q2.
Also telling of changing trends are the figure differences between the boroughs. The Bronx has remained steady, dipping from 2.4 million square feet in Q1 down to 2.2 million square feet in Q2. By contrast, Brooklyn, which in Q1 held an 11.3-million-square-feet total that relatively equaled the rest of the boroughs combined, in Q2 has plummeted down to 4.1 million square feet, lowering slightly below Queens (4.3 million square feet) though though still nearly doubling that of The Bronx.
Though Queens is now in the first place citywide, it still lowered significantly from the first quarter’s 5.4 million square feet. Manhattan, with its ever-tightening supply of construction-ready space, remains at fourth place, decreasing slightly from two to 1.8 million square feet. Staten Island, consistently notable for its predominantly low-scale construction, has dipped into the six-digits, lowering from 1.2 million square feet in Q1 down to around 723,000 square feet in Q2.
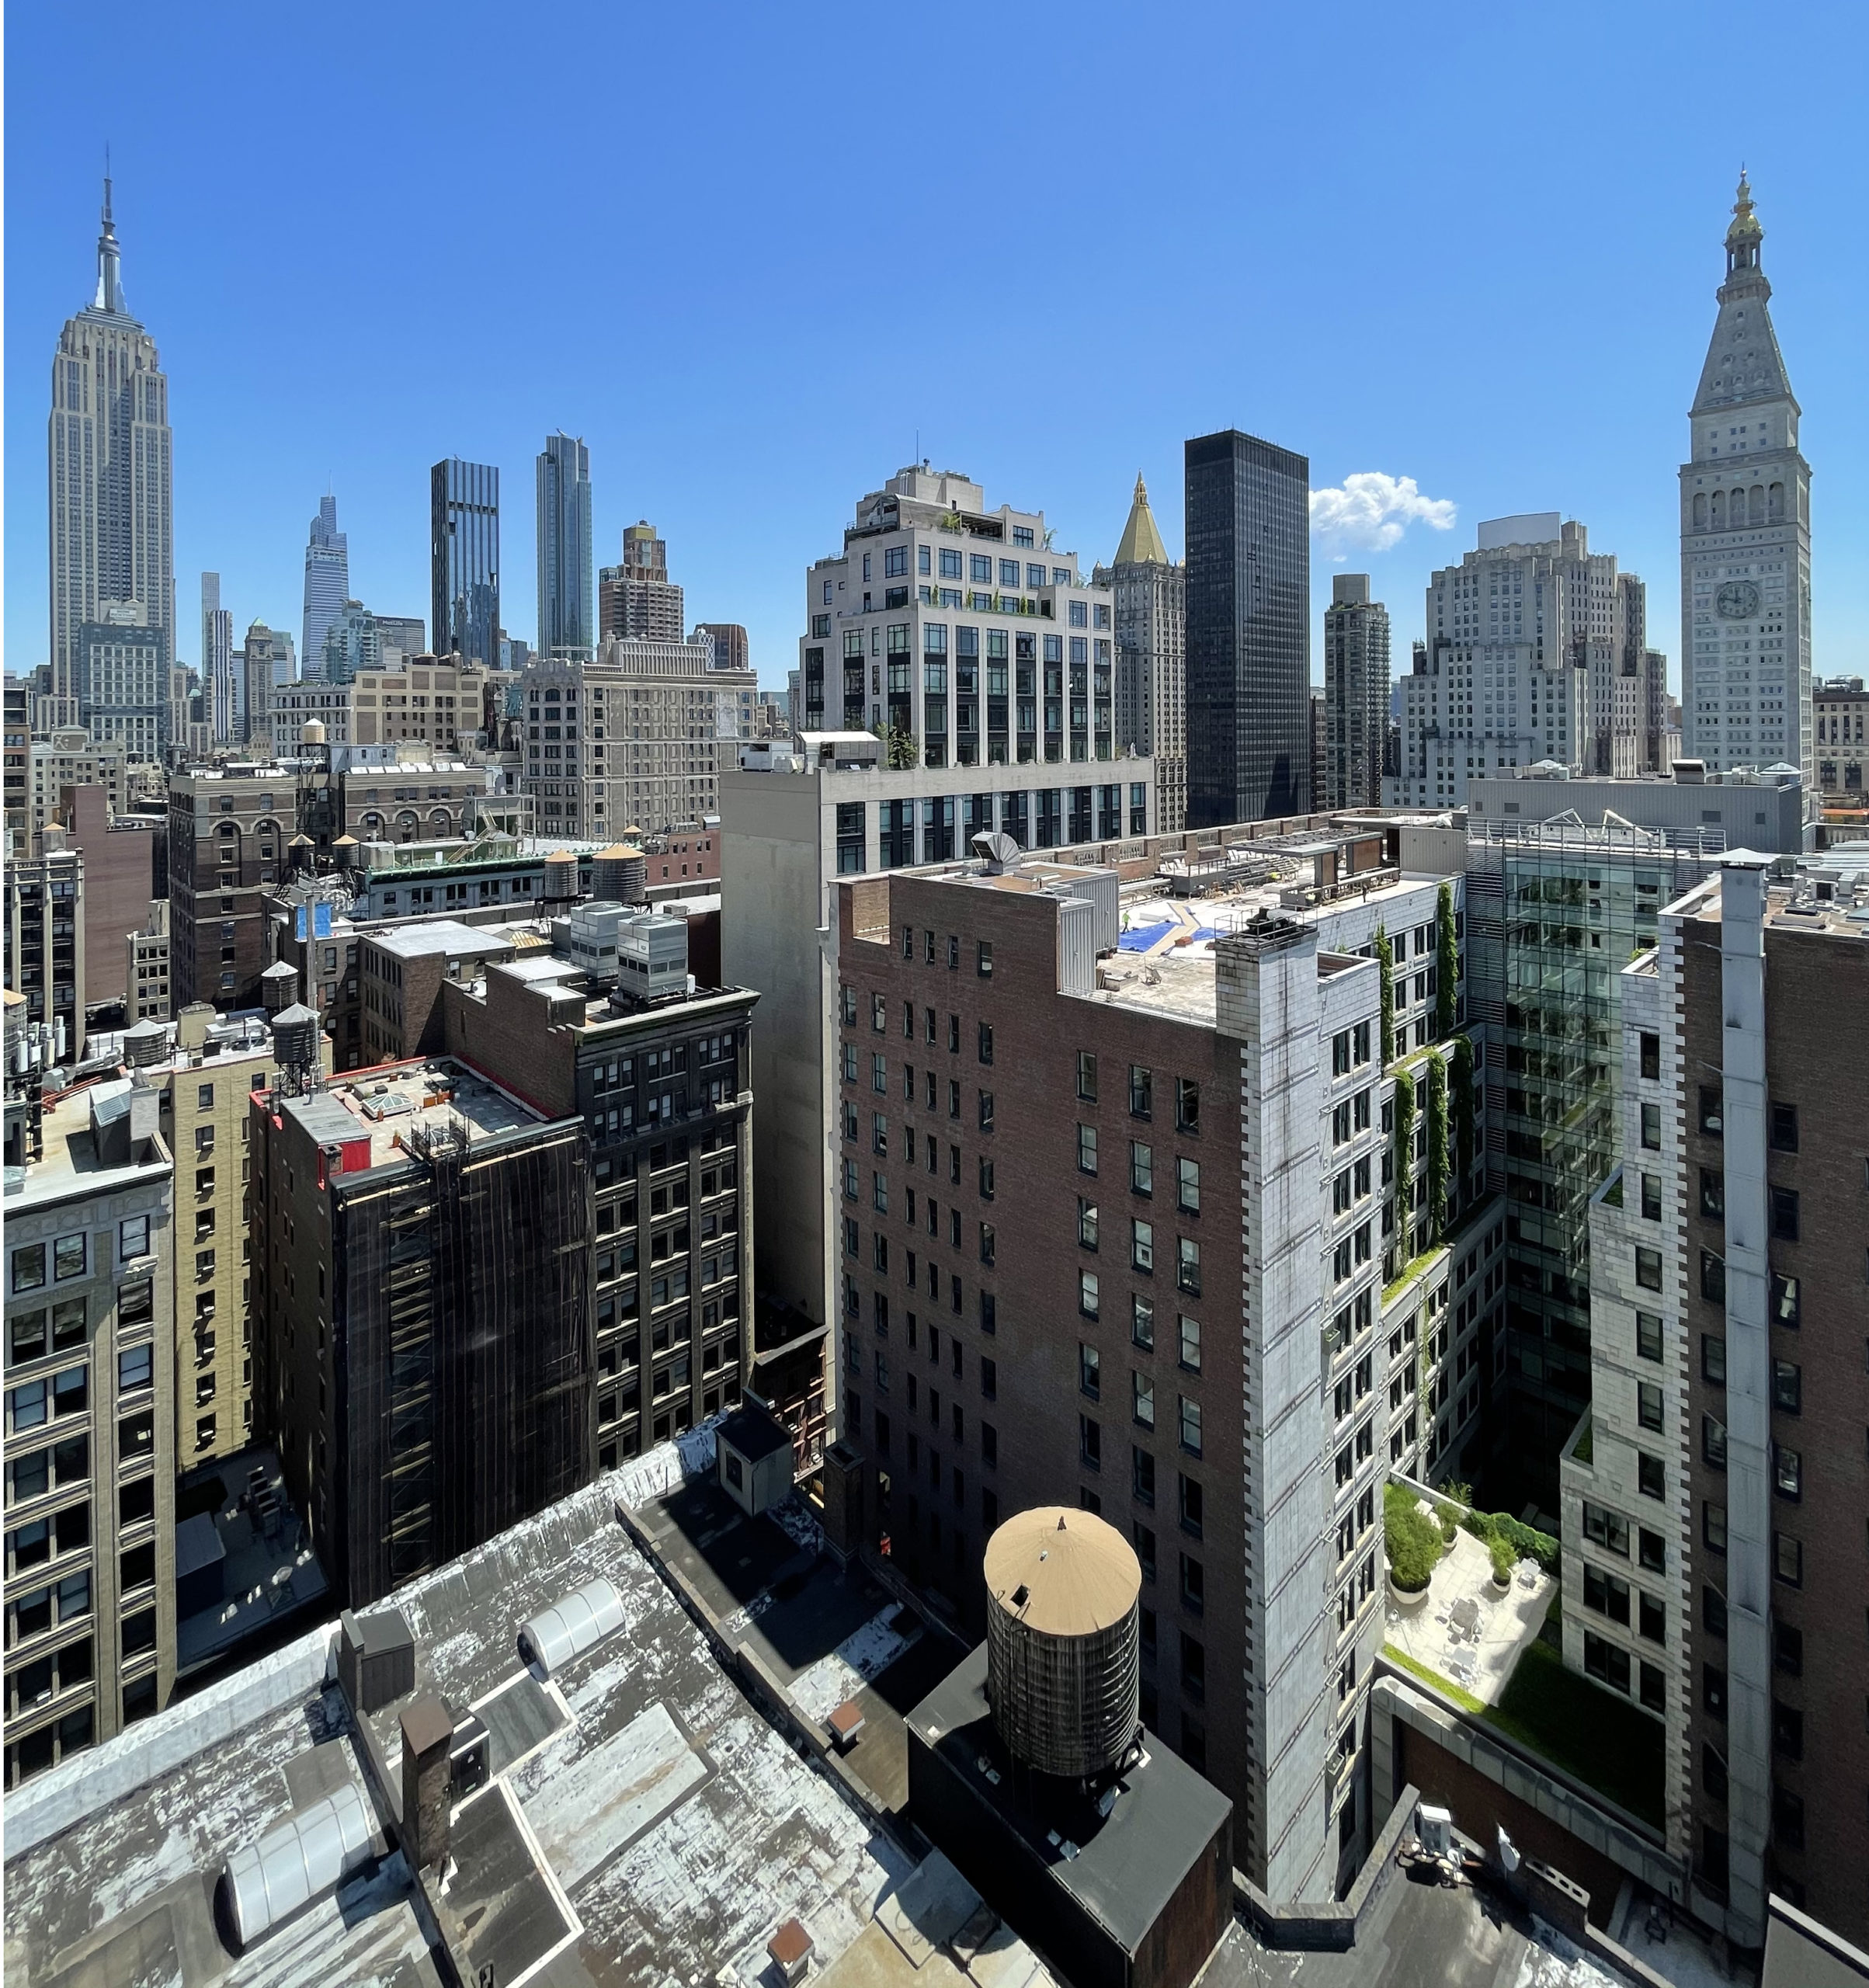
Photo by Michael Young

The outdoor swimming pool. Photo by Michael Young
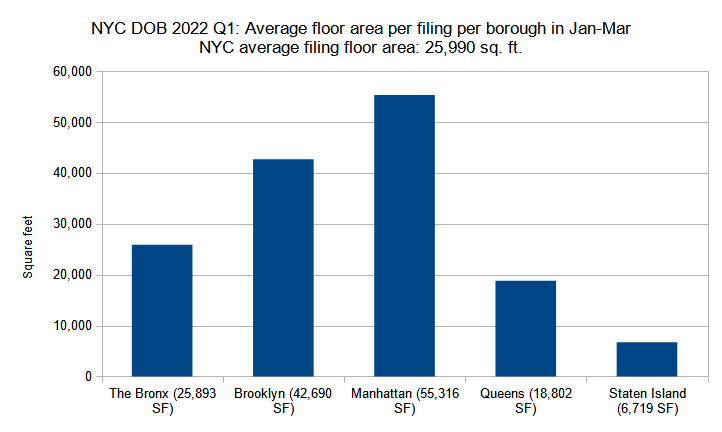
Average floor area per permit filing by borough
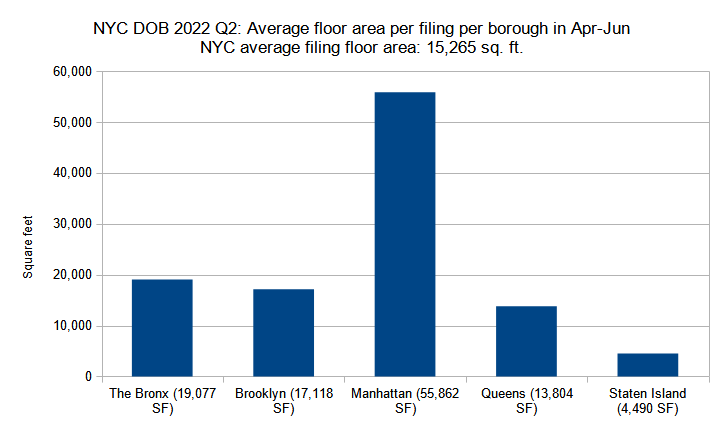
Average floor area per new construction permit per borough filed in New York City in Q2 (April through June) 2022. Data source: the Department of Buildings. Data aggregation and graphics credit: Vitali Ogorodnikov
As indicated in above analyses, the total number of construction permit filings in New York City between the first and second quarters of 2022 has remained virtually the same (862 in Q1 versus 857 in Q2), yet the total volume of filed-for floor area has decreased nearly by half (from 22.4 million square feet in Q1 down to 13.1 million square feet in Q2). A basic inference would suggest that the average filing size has decreased notably during the period. This is confirmed by our tally, which discovers that the average filing size has dropped from 25,990 square feet in Q1 down to 15,265 square feet in Q2.
However, the decrease was not observed equally in all boroughs. The size of the average filing in The Bronx has somewhat lowered, from 25,893 square feet per filing in Q1 down to 19,077 square feet per filing in Q2. Queens and Staten Island have observed similarly moderate decreases, from 18,802 square feet in Q1 down to 13,804 square feet in Q2, and from 6,719 square feet in Q1 down to 4,490 square feet in Q2, respectively.
Crowded Manhattan, where dense development remains more lucrative than in any other borough, has not only maintained its vast lead in terms of square footage per average filing, but has actually slightly increased it, going from 55,316 square feet per average filing in Q1 to 55,862 square feet in Q2.
Four out of five of the largest filings by square footage in the second quarter may be found in Queens. The city’s largest filing for Q2 is 43-02 Ditmars Boulevard in northern Astoria, where an eight-story, 529,234-square-foot, 500-unit development is proposed. The second-largest development is the 27-story, 47,415-square-foot office and community services building is planned at 76 Varick Street in Hudson Square, Manhattan. Next is the five-story, 339,740-square-foot building planned at 48-02 48th Avenue in the southeastern corner of Sunnyside, Queens. Rounding off the list is a pair of towers in Queens that will span a prime subway-adjacent site in Downtown Flushing: 39-18 Janet Place, which will rise 15 stories and span 331,392 square feet, and 39-08 Janet Place, which will stand 18 stories and span 298,713 square feet.
Photo by Michael Young
Photo by Michael Young
In summary, the Department of Buildings data for new construction permits filed for in the second quarter of 2022 allows us to draw certain intriguing conclusions. When YIMBY released its report last quarter, we wondered if the city’s development industry would be able to sustain the unusually high volume of permits that we observed at the time. And although the total square footage and unit count have somewhat readjusted closer to last year’s values, the fact that the city registered effectively as many new permit filings as it did in the previous quarter, well eclipsing the figure for the previous year, is encouraging.
Nevertheless, though 10,000 units may sound like a formidable figure, it still falls far short of what the city needs to address its acute housing crisis. The lowering of the total unit count cannot plausibly be explained by a lack of demand, as recent studies show that more people are moving into Manhattan than before the pandemic, even though the borough is registering record-breaking rent prices.
In essence, the problems of overpriced rent and apartment shortages may be alleviated via the elementary principles of supply and demand: if a commodity is in shortage, we must either decrease demand for the commodity or increase its availability. There’s no sight for the decrease of housing demand, with people continuing to move into the city en masse and New Yorkers looking to improve their options and housing pricing.
As such, the only other alternative is to dramatically increase the supply of housing. And though we must continue to introduce commensurate infrastructure improvements for the new development, the greatest hurdles to this obvious solution are restrictive zoning policies, bureaucracy, and obstinate NIMBY opposition.
Despite its current scale, New York City remains capable of accommodating a large volume of new construction, particularly along underbuilt, transit-accessible areas in the outer boroughs. Likewise, the waterfront would be able to provide much more housing if the city made a significant expansion of its ferry system in all five boroughs.
And while resident displacement in establishment neighborhoods is a complex issue, a notion that any new housing will drive prices up for existing residents is a myth that has been thoroughly debunked. A number of studies (examples: one, two, and three) have shown that even luxury development is likely to lower neighborhood living prices for all incomes, and that restriction of new construction increases unaffordability and exacerbates inequality. In oversimplified terms, newcomers are likely to move into newly desirable neighborhoods regardless of housing supply, and if they cannot move into a brand new building, they instead are much more likely to outbid, buy out, or otherwise displace residents already living in the vicinity.
The city and the world at large are currently facing complicated challenges. The issue of housing shortage, however, is generally a self-inflicted one, which may be significantly alleviated with a shift of policy and urban mindset. New Yorkers are already looking to rent and buy housing. Developers are already looking to build. As such, we must find ways to prudently expedite the planning and construction process, upzone areas that can objectively handle significant new development, demand that our politicians keep up with the infrastructure (transit, schools, sewage, etc.) necessary to support such development, and convince our neighbors that saying Yes In My Back Yard to new development benefits us as a community both in the short and the long run.
606 West 30th Street. Photo by Michael Young

145 West 47th Street. Photo by Michael Young

145 West 47th Street. Photo by Michael Young

660 Fifth Avenue. Photo by Michael Young
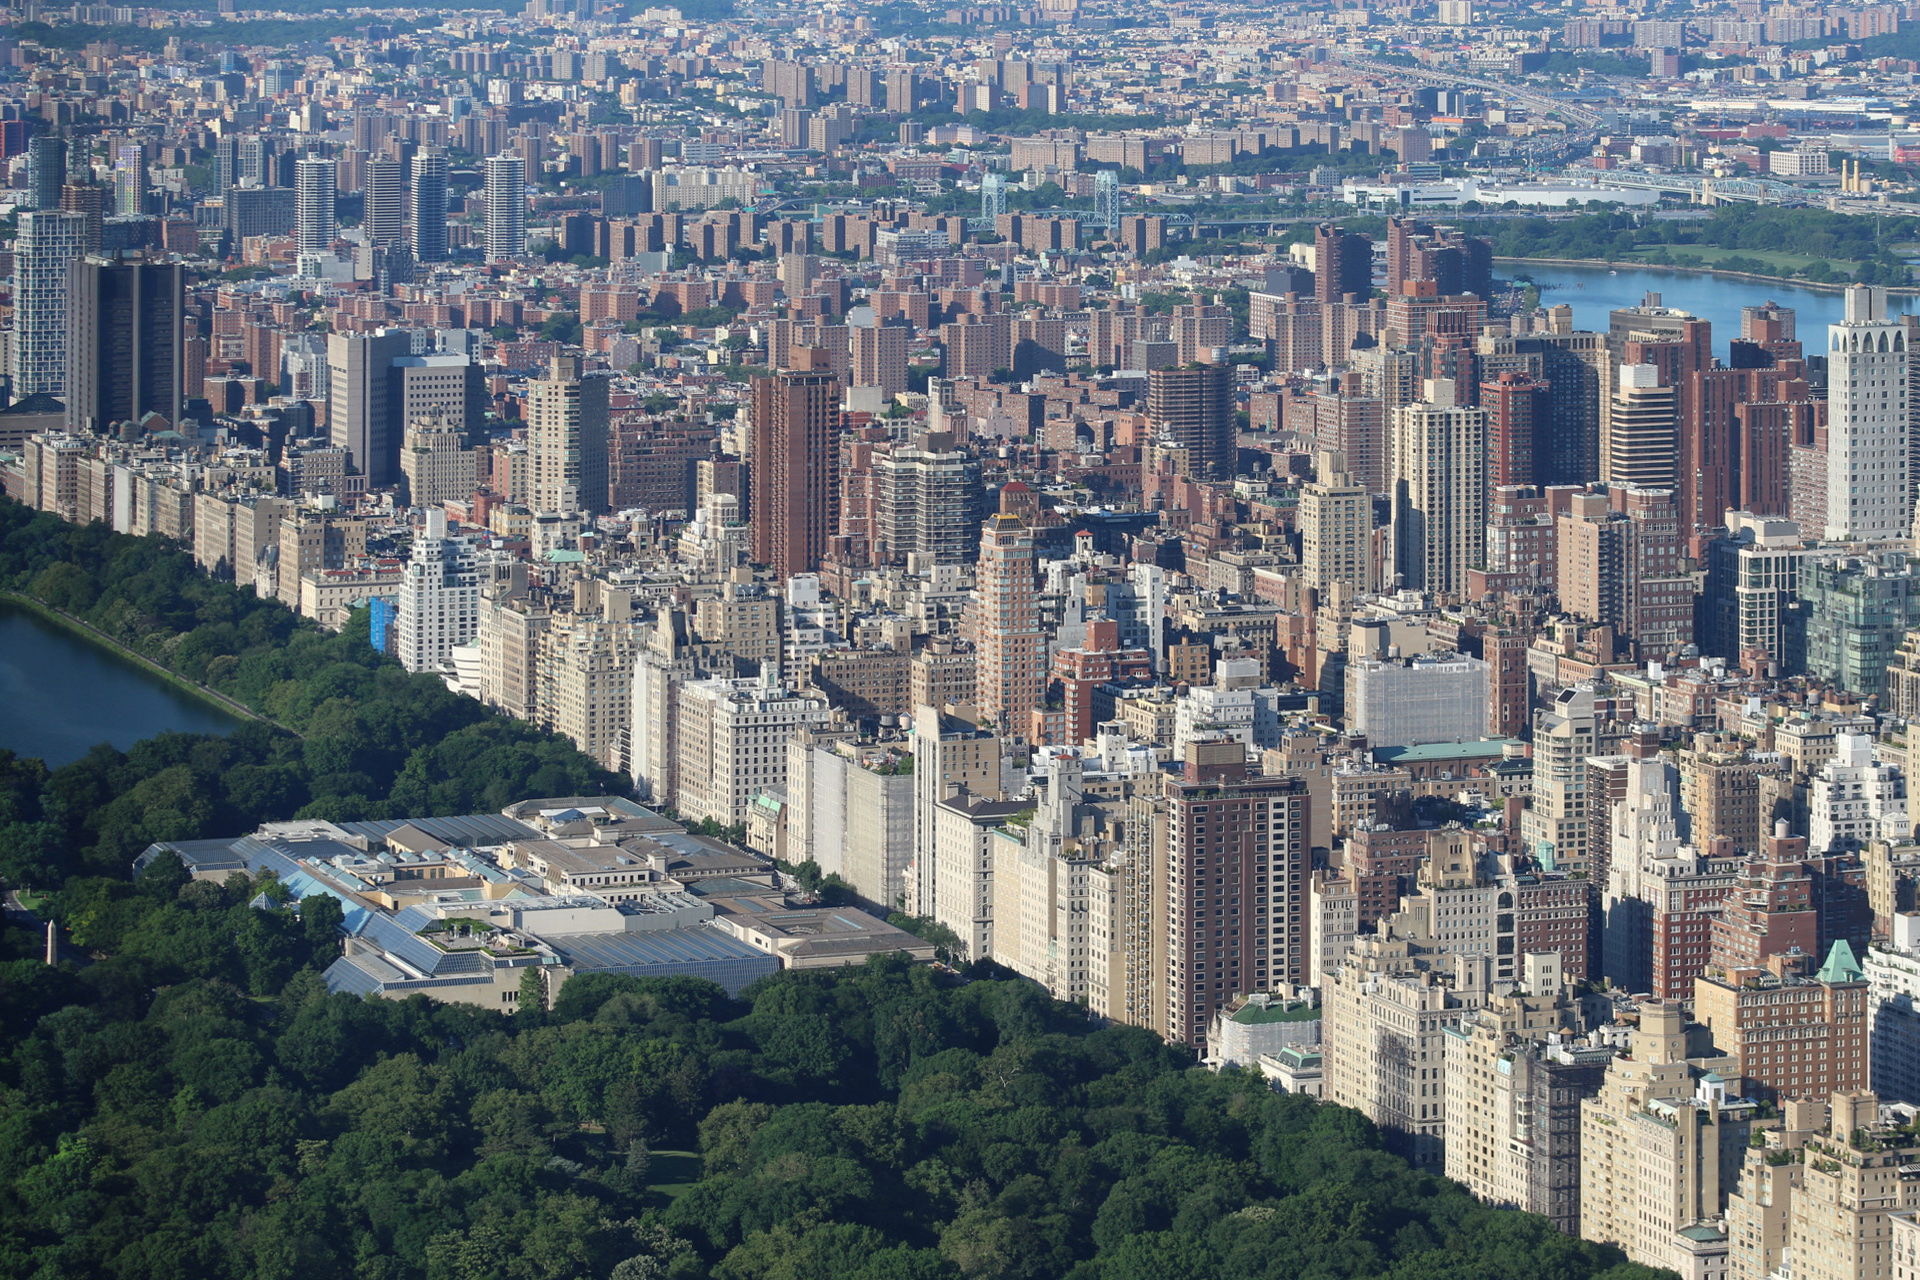
The MET and Upper East Side, Photo by Michael Young
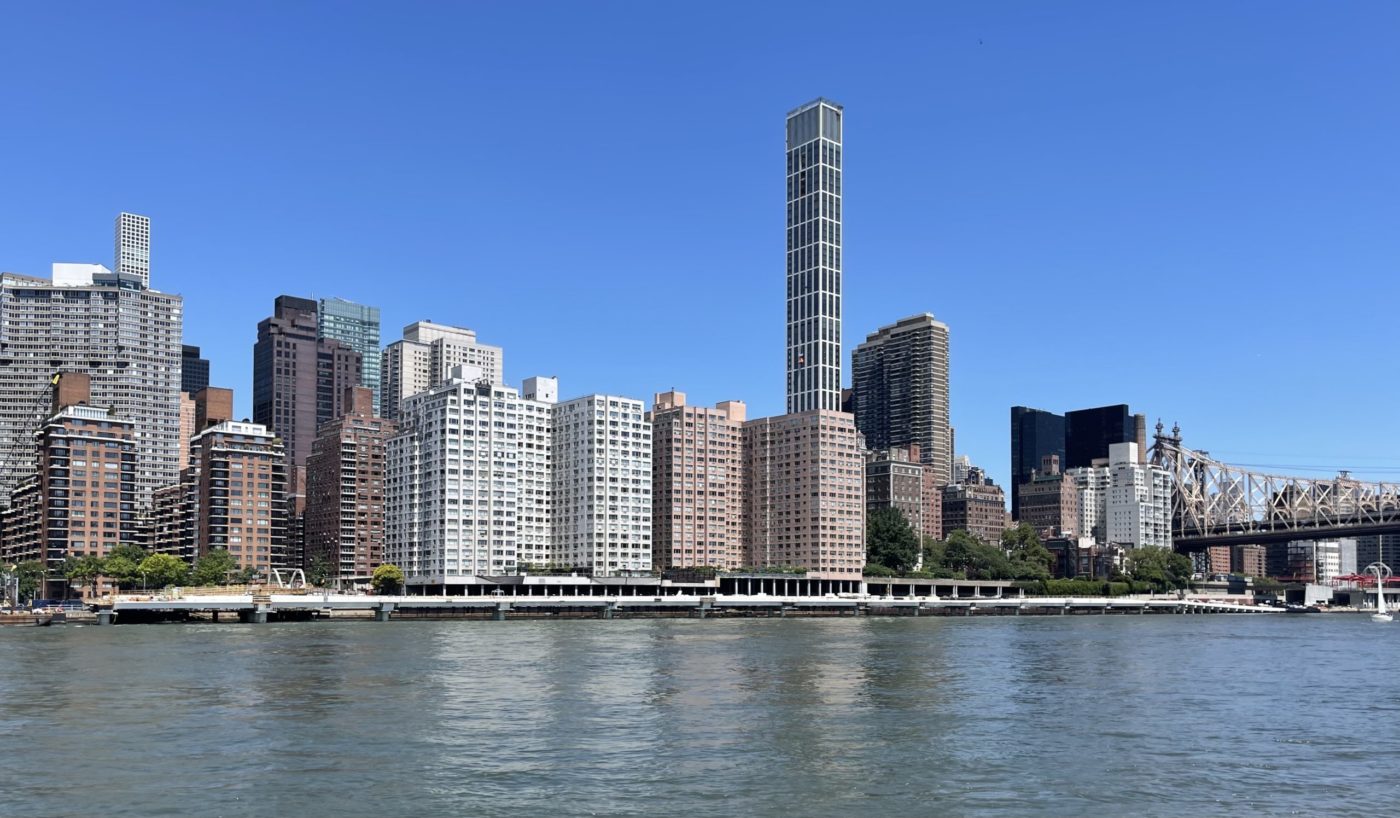
Photo by Michael Young

Olympia. Photo by Michael Young
520 Fifth Avenue. Photo by Michael Young

1841-1845 Broadway. Photo by Michael Young

The Empire State Building. Photo by Michael Young
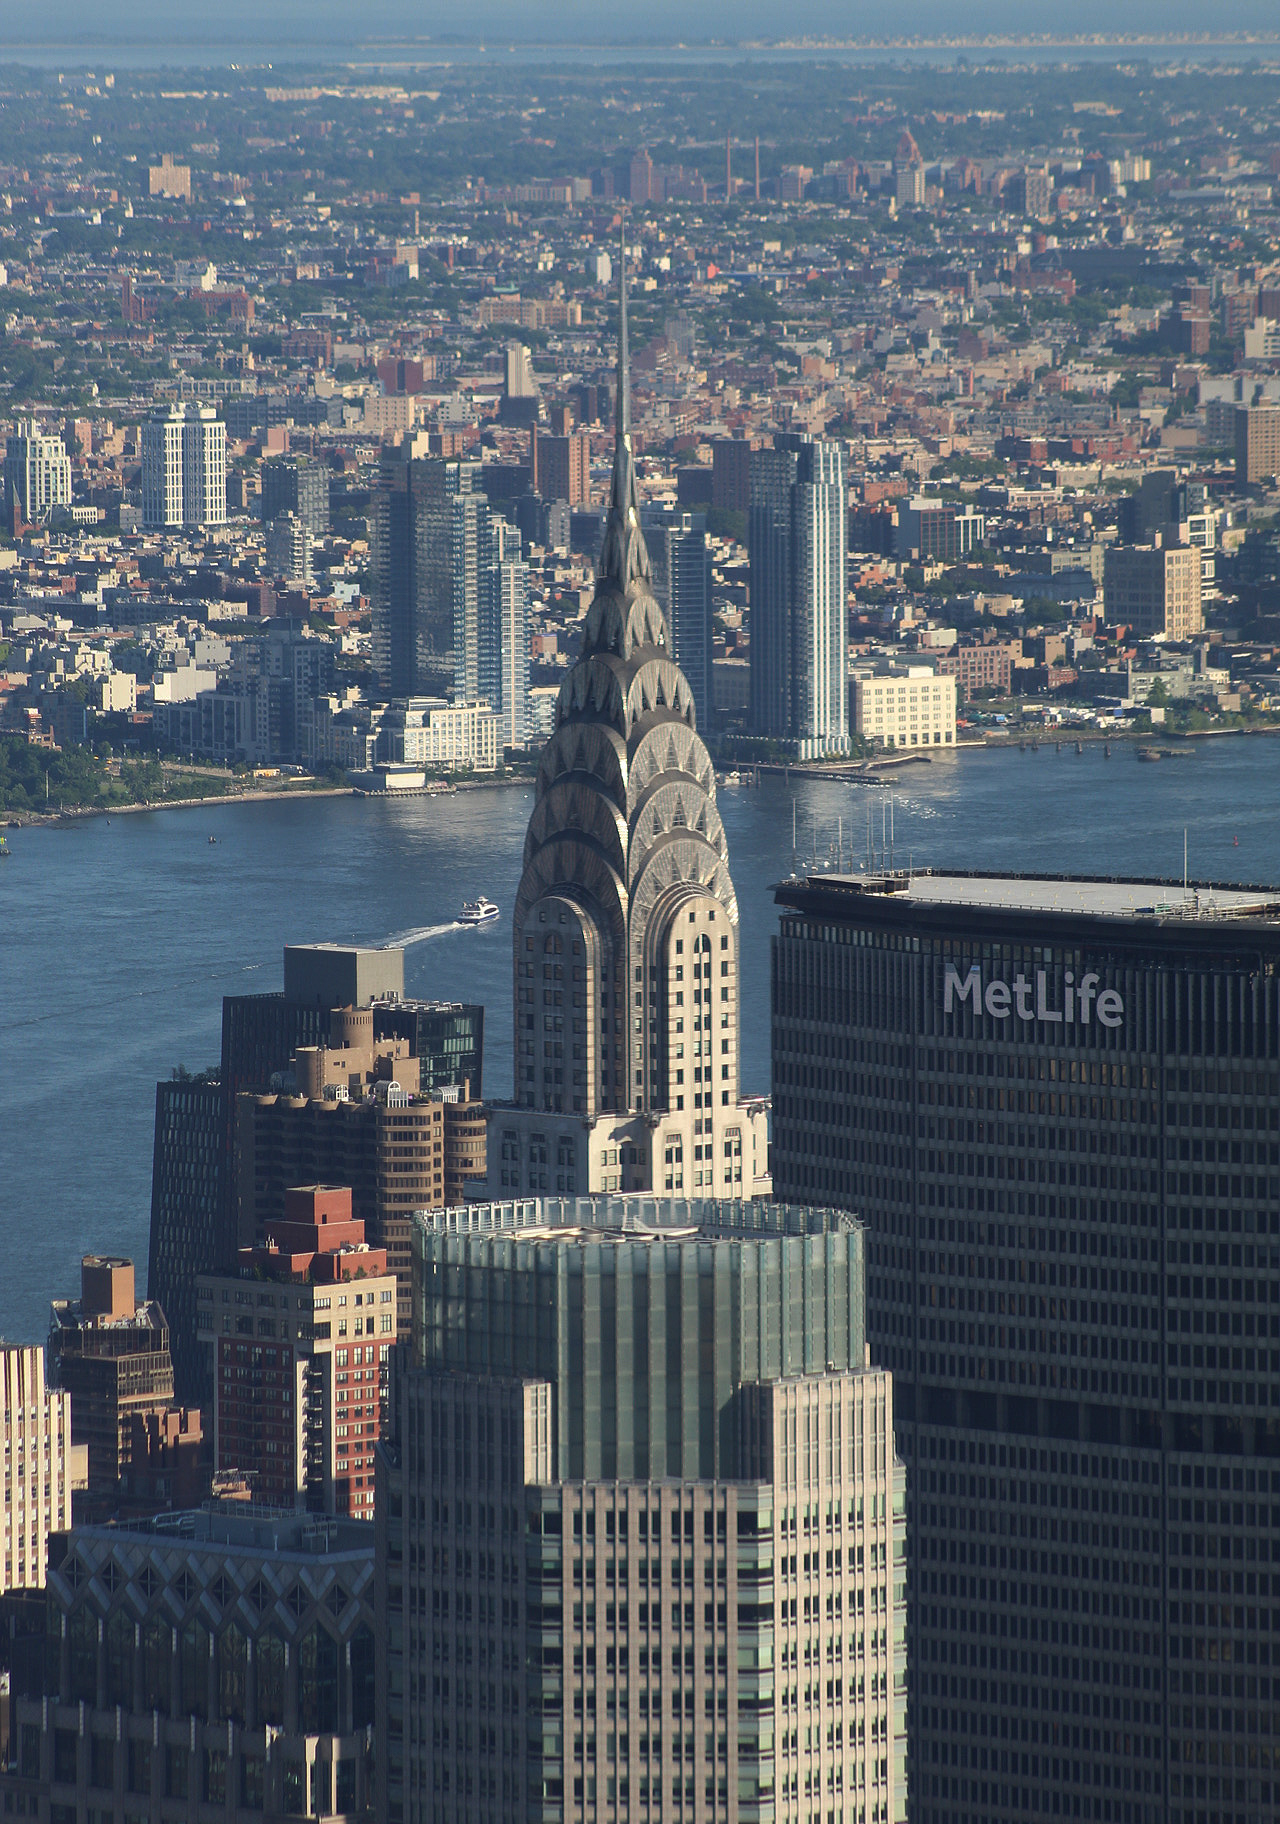
The Chrysler Building. Photo by Michael Young
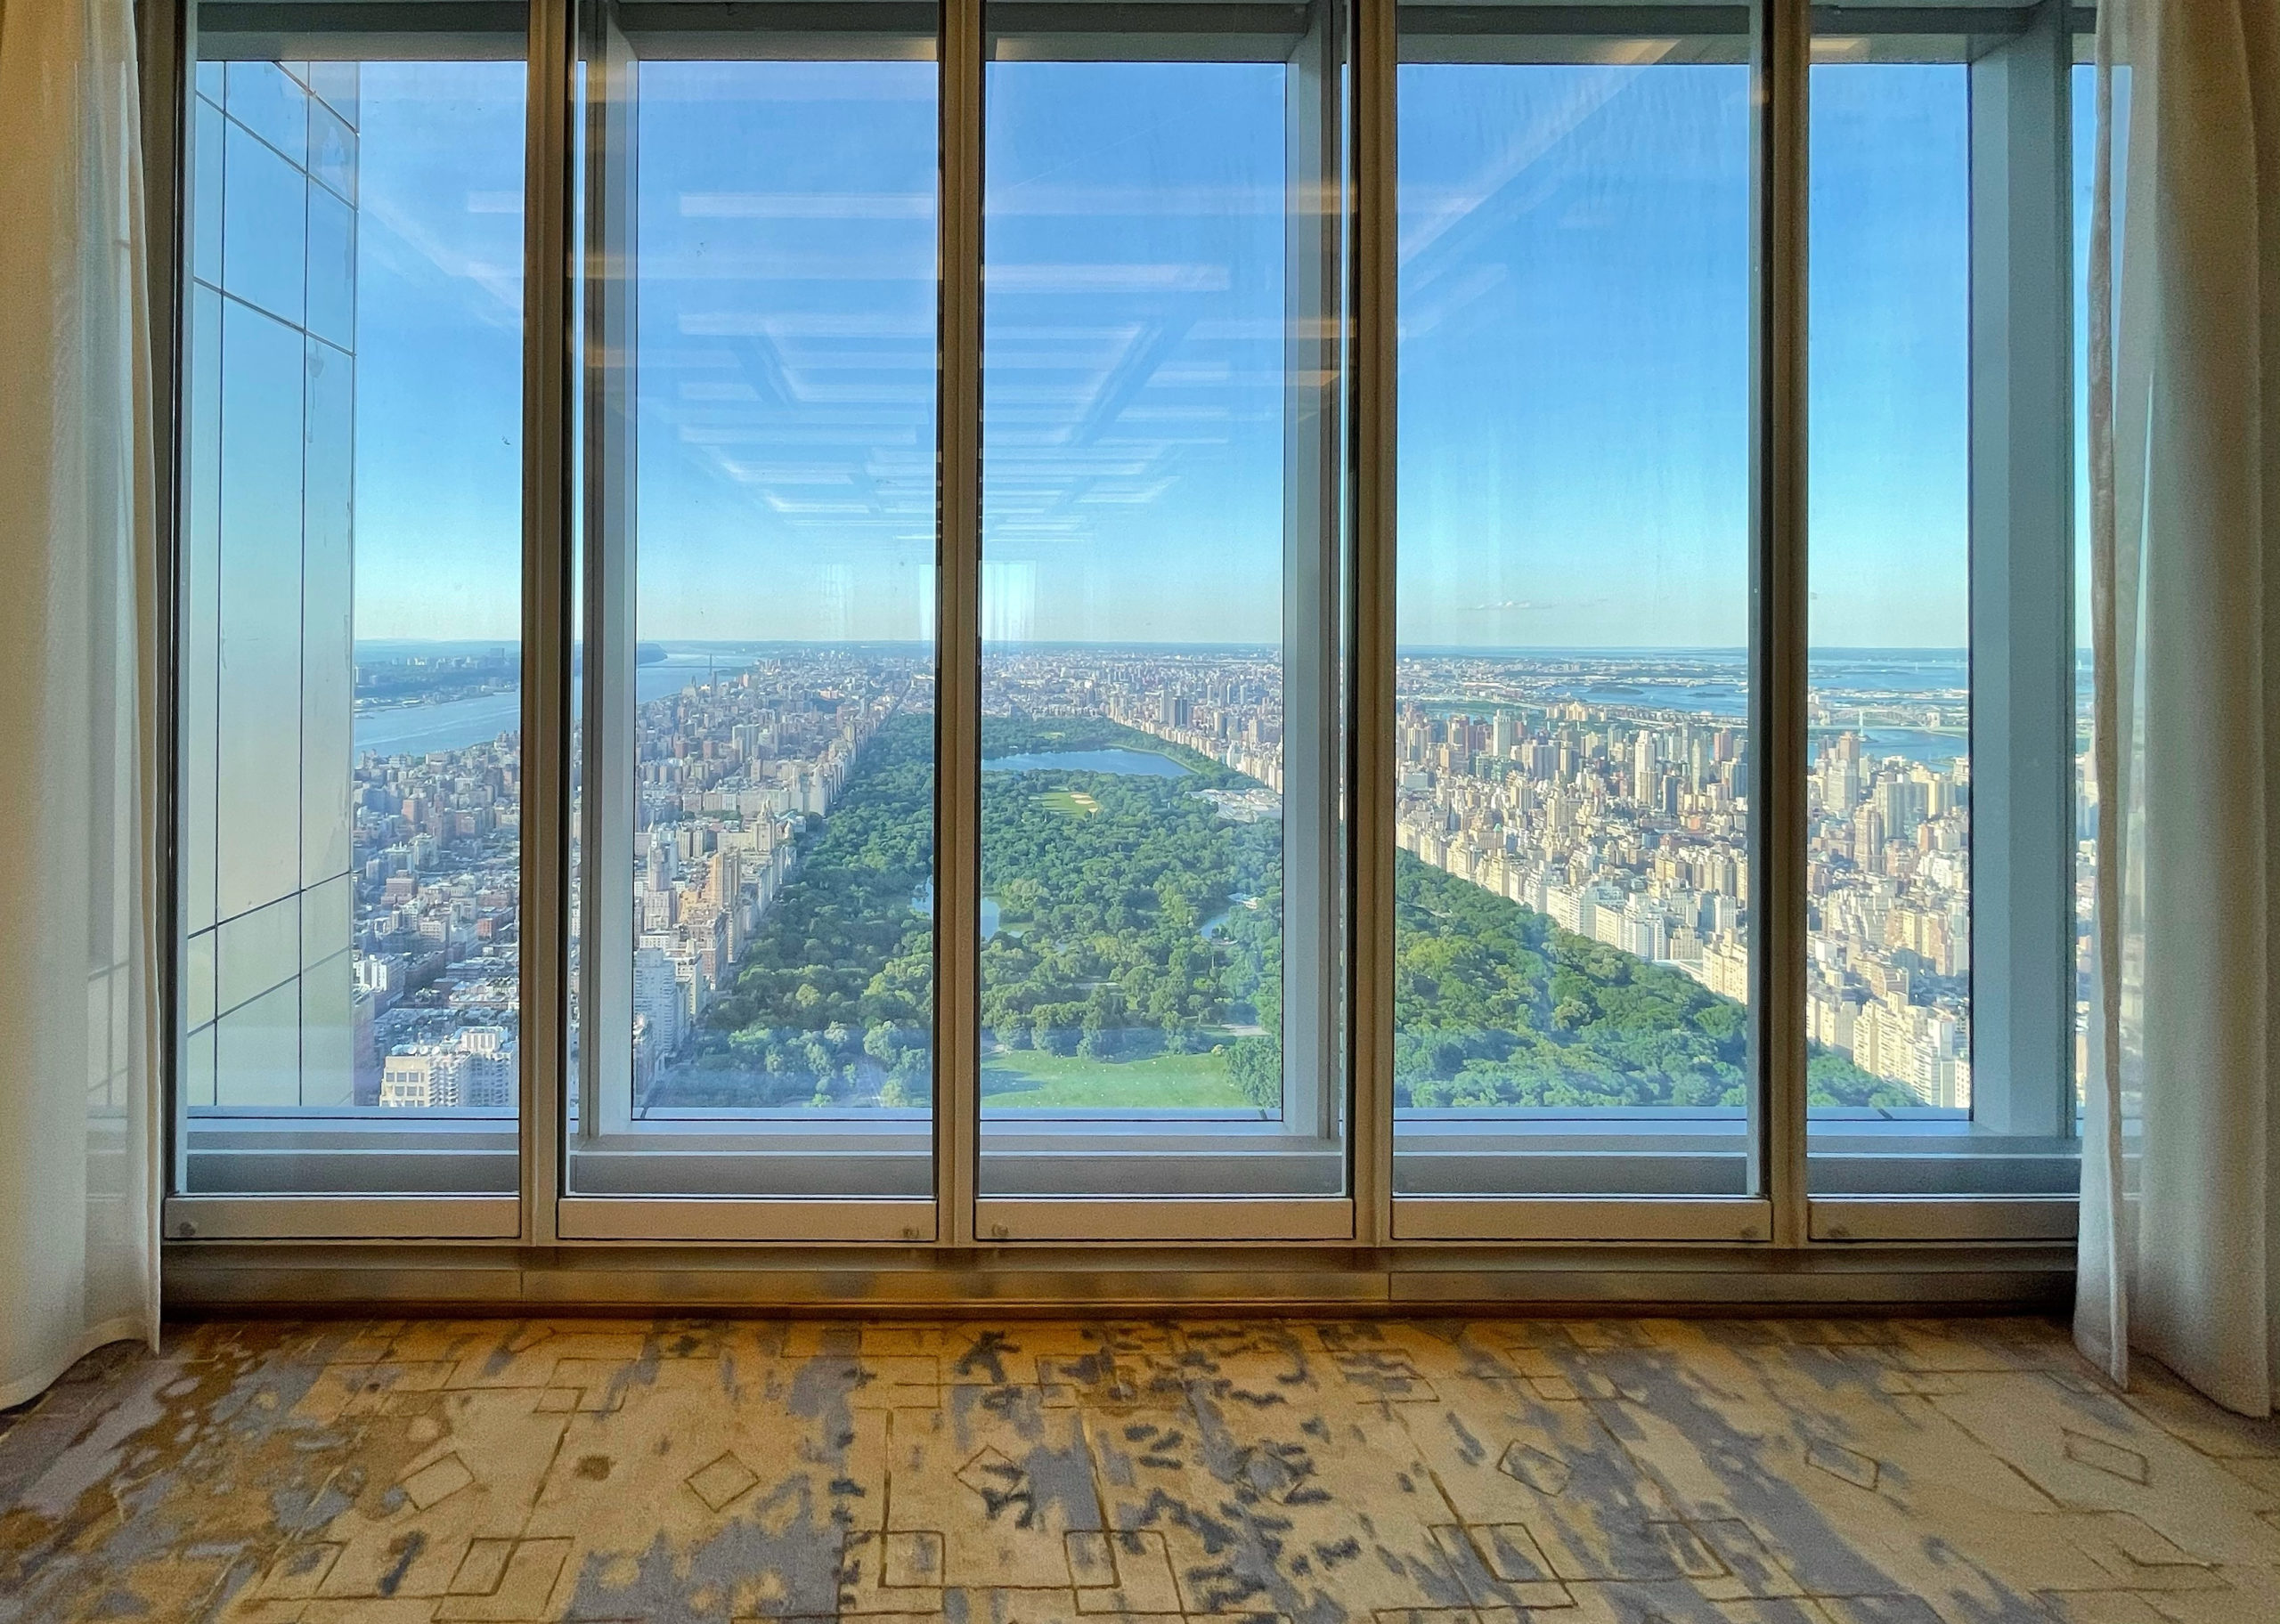
The view of Central Park from the ballroom. Photo by Michael Young
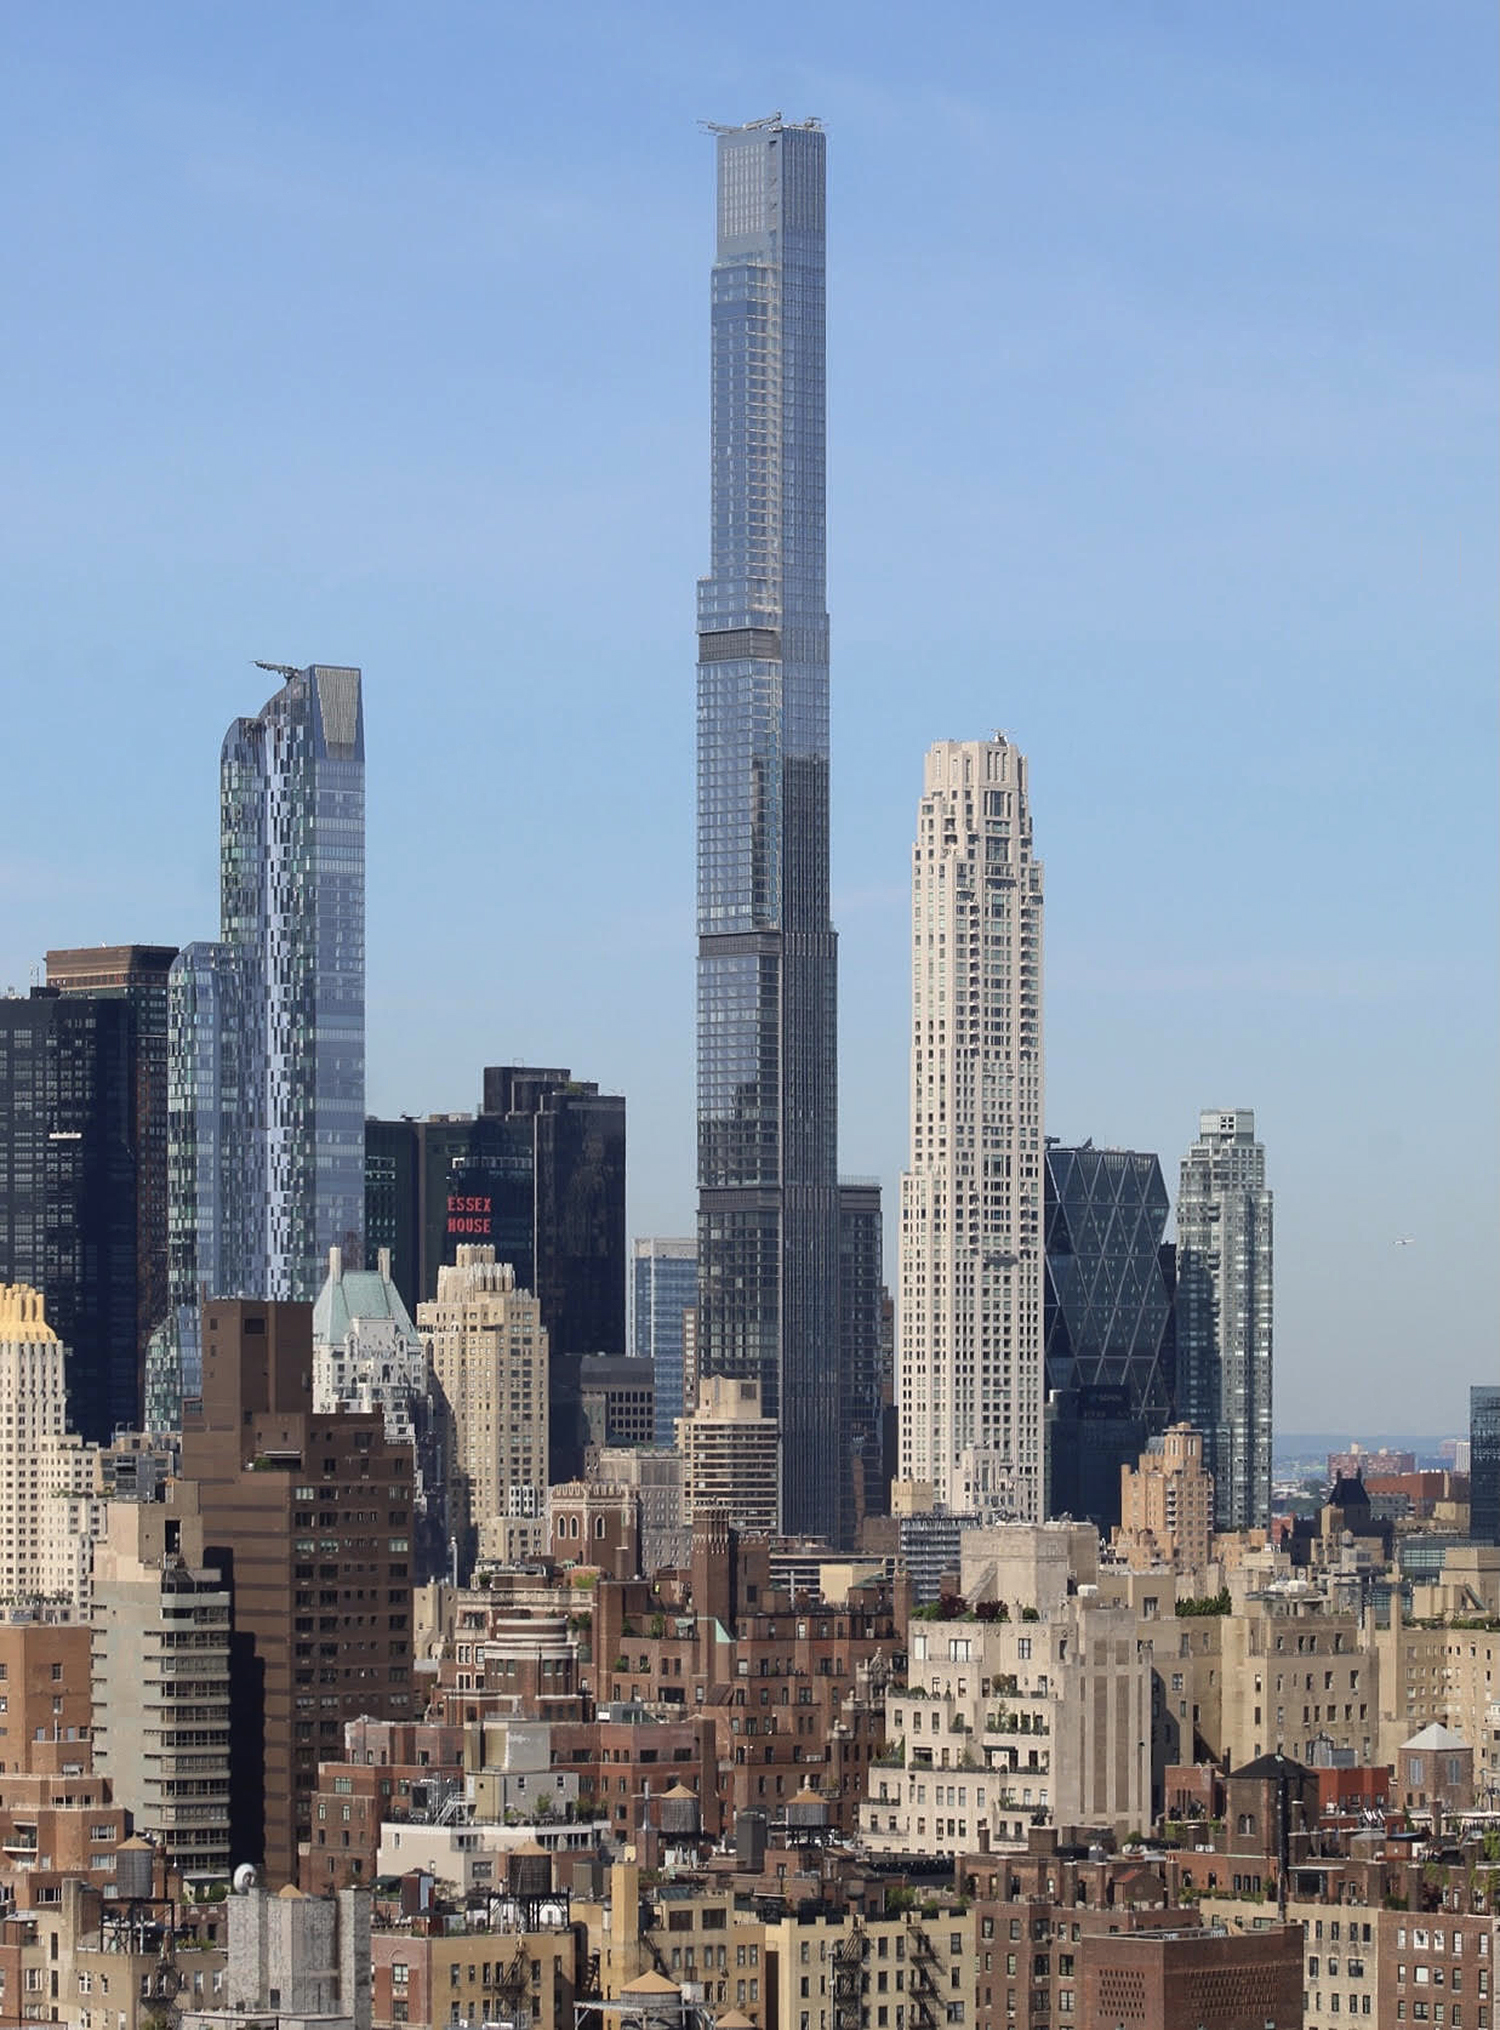
Central Park Tower. Photo by Michael Young

Photo by Michael Young

Photo by Michael Young
Photo by Michael Young
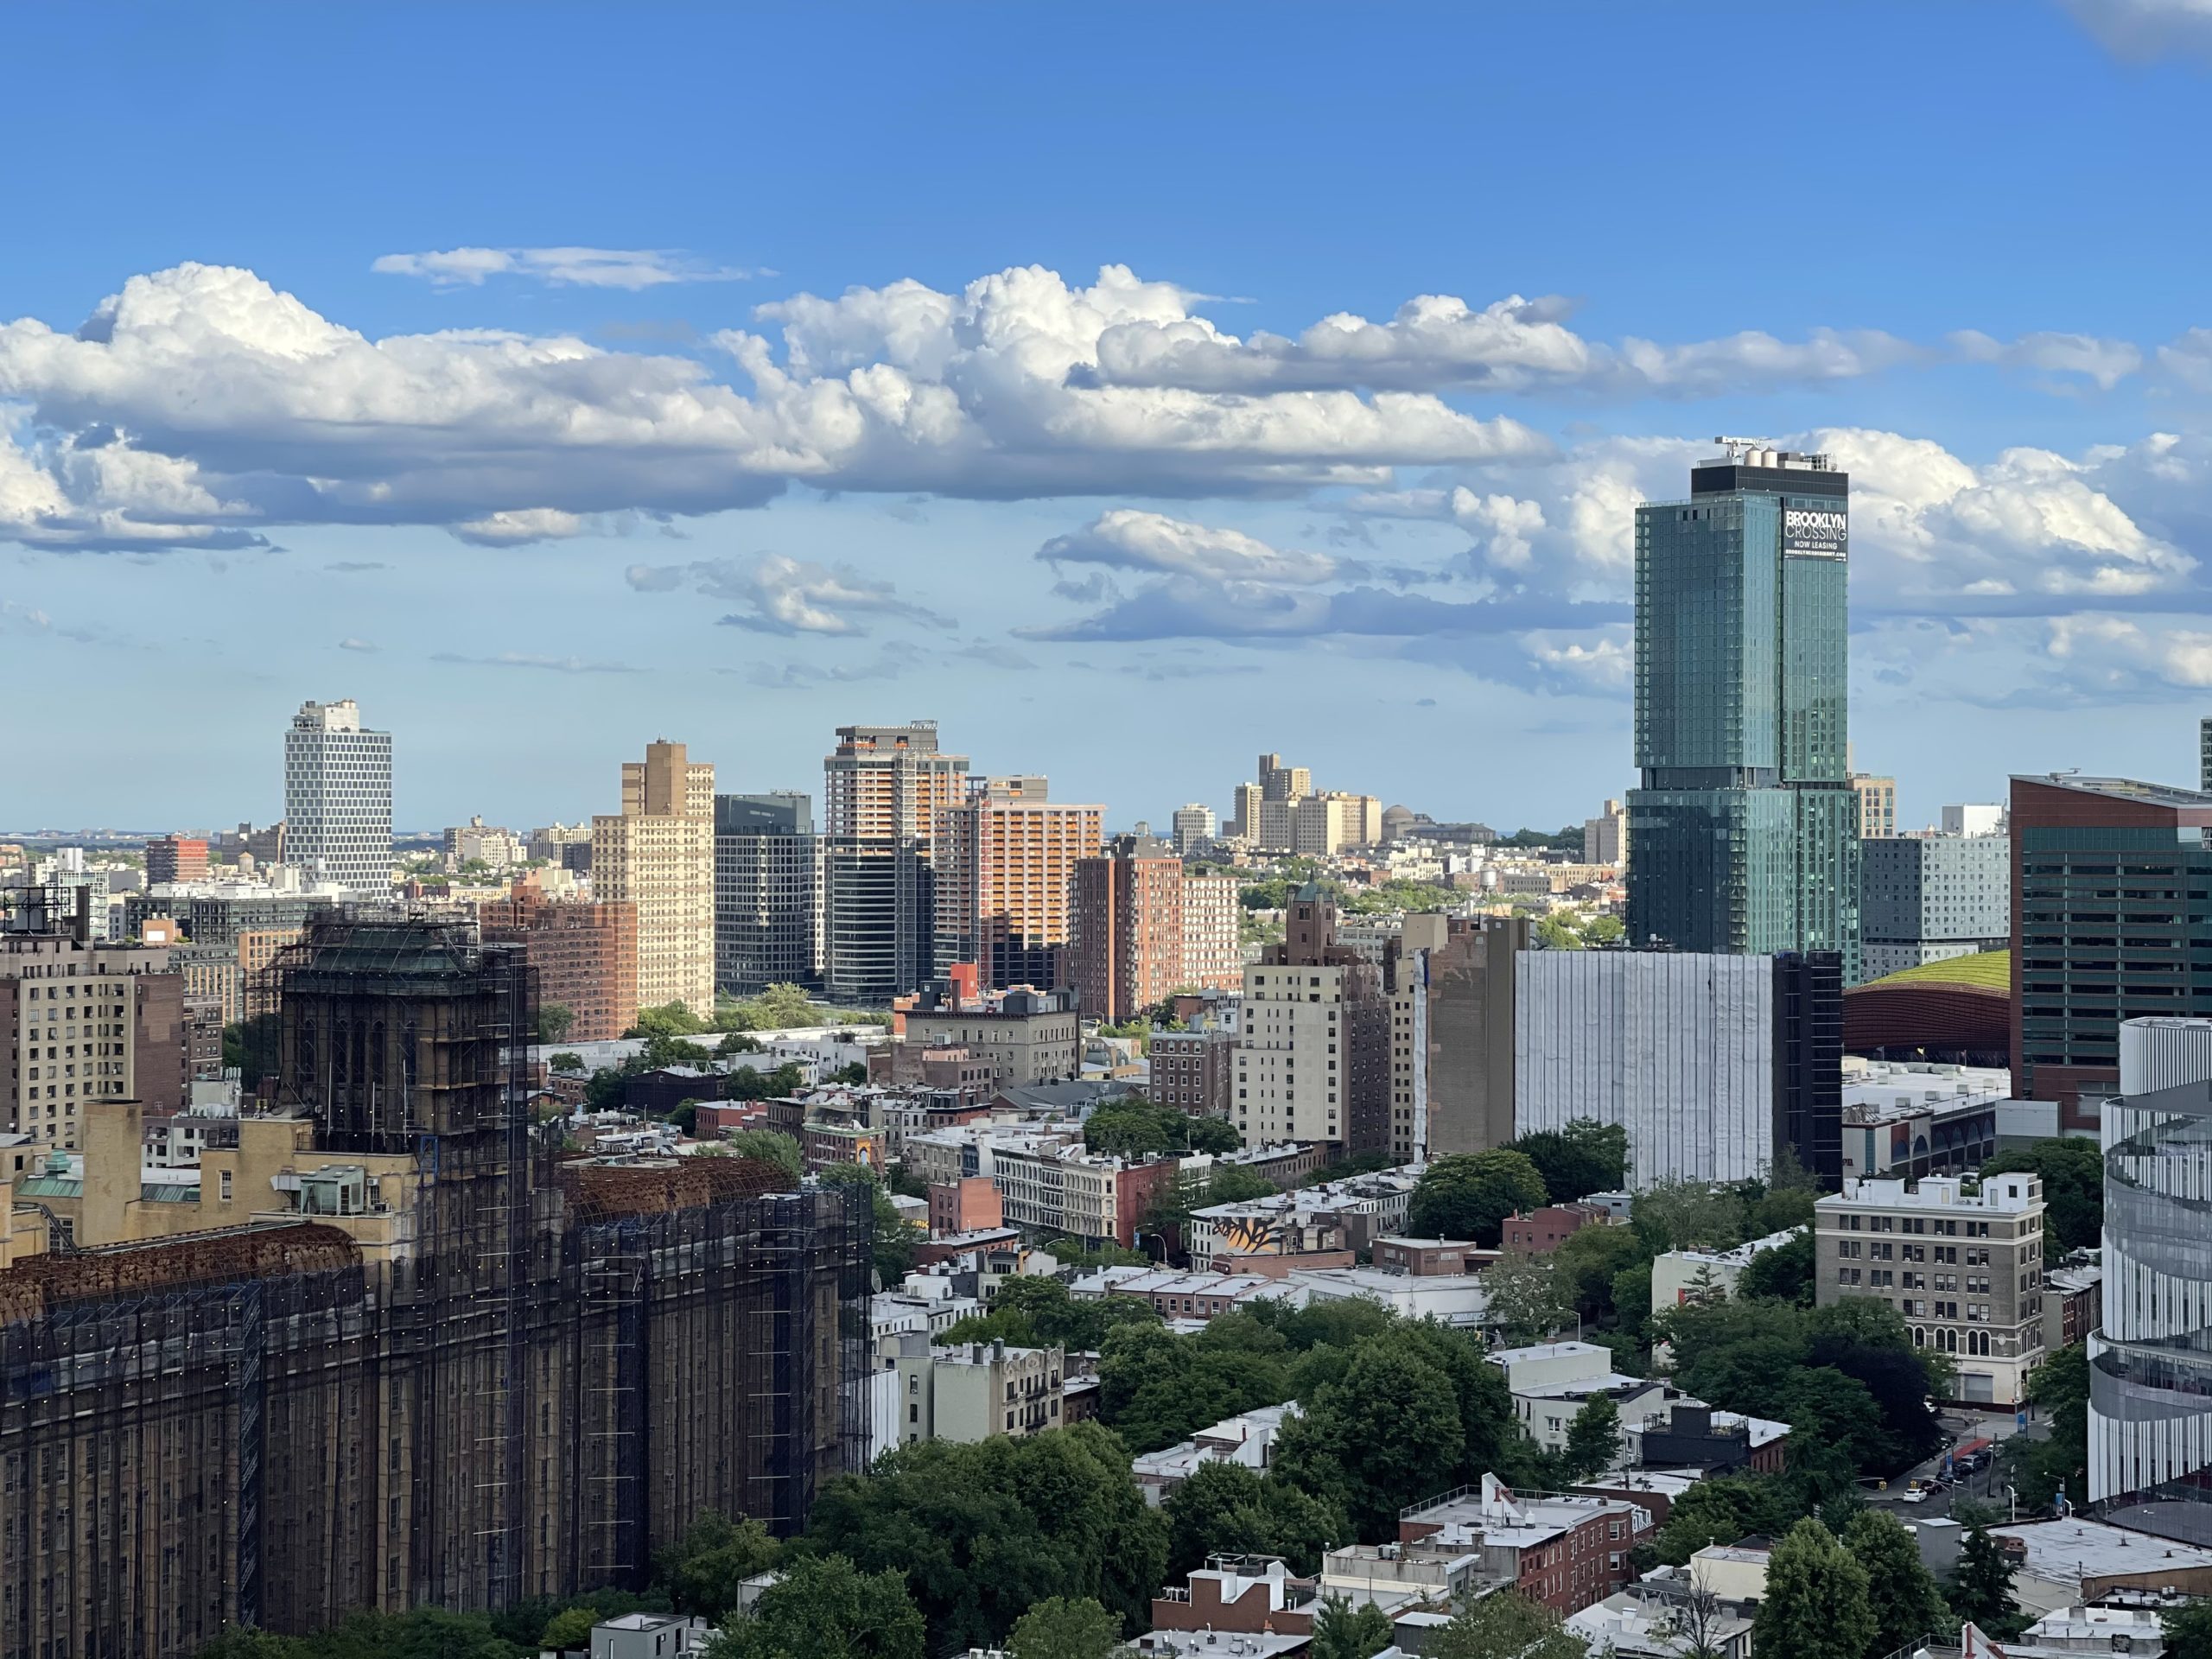
Photo by Michael Young

Photo by Michael Young
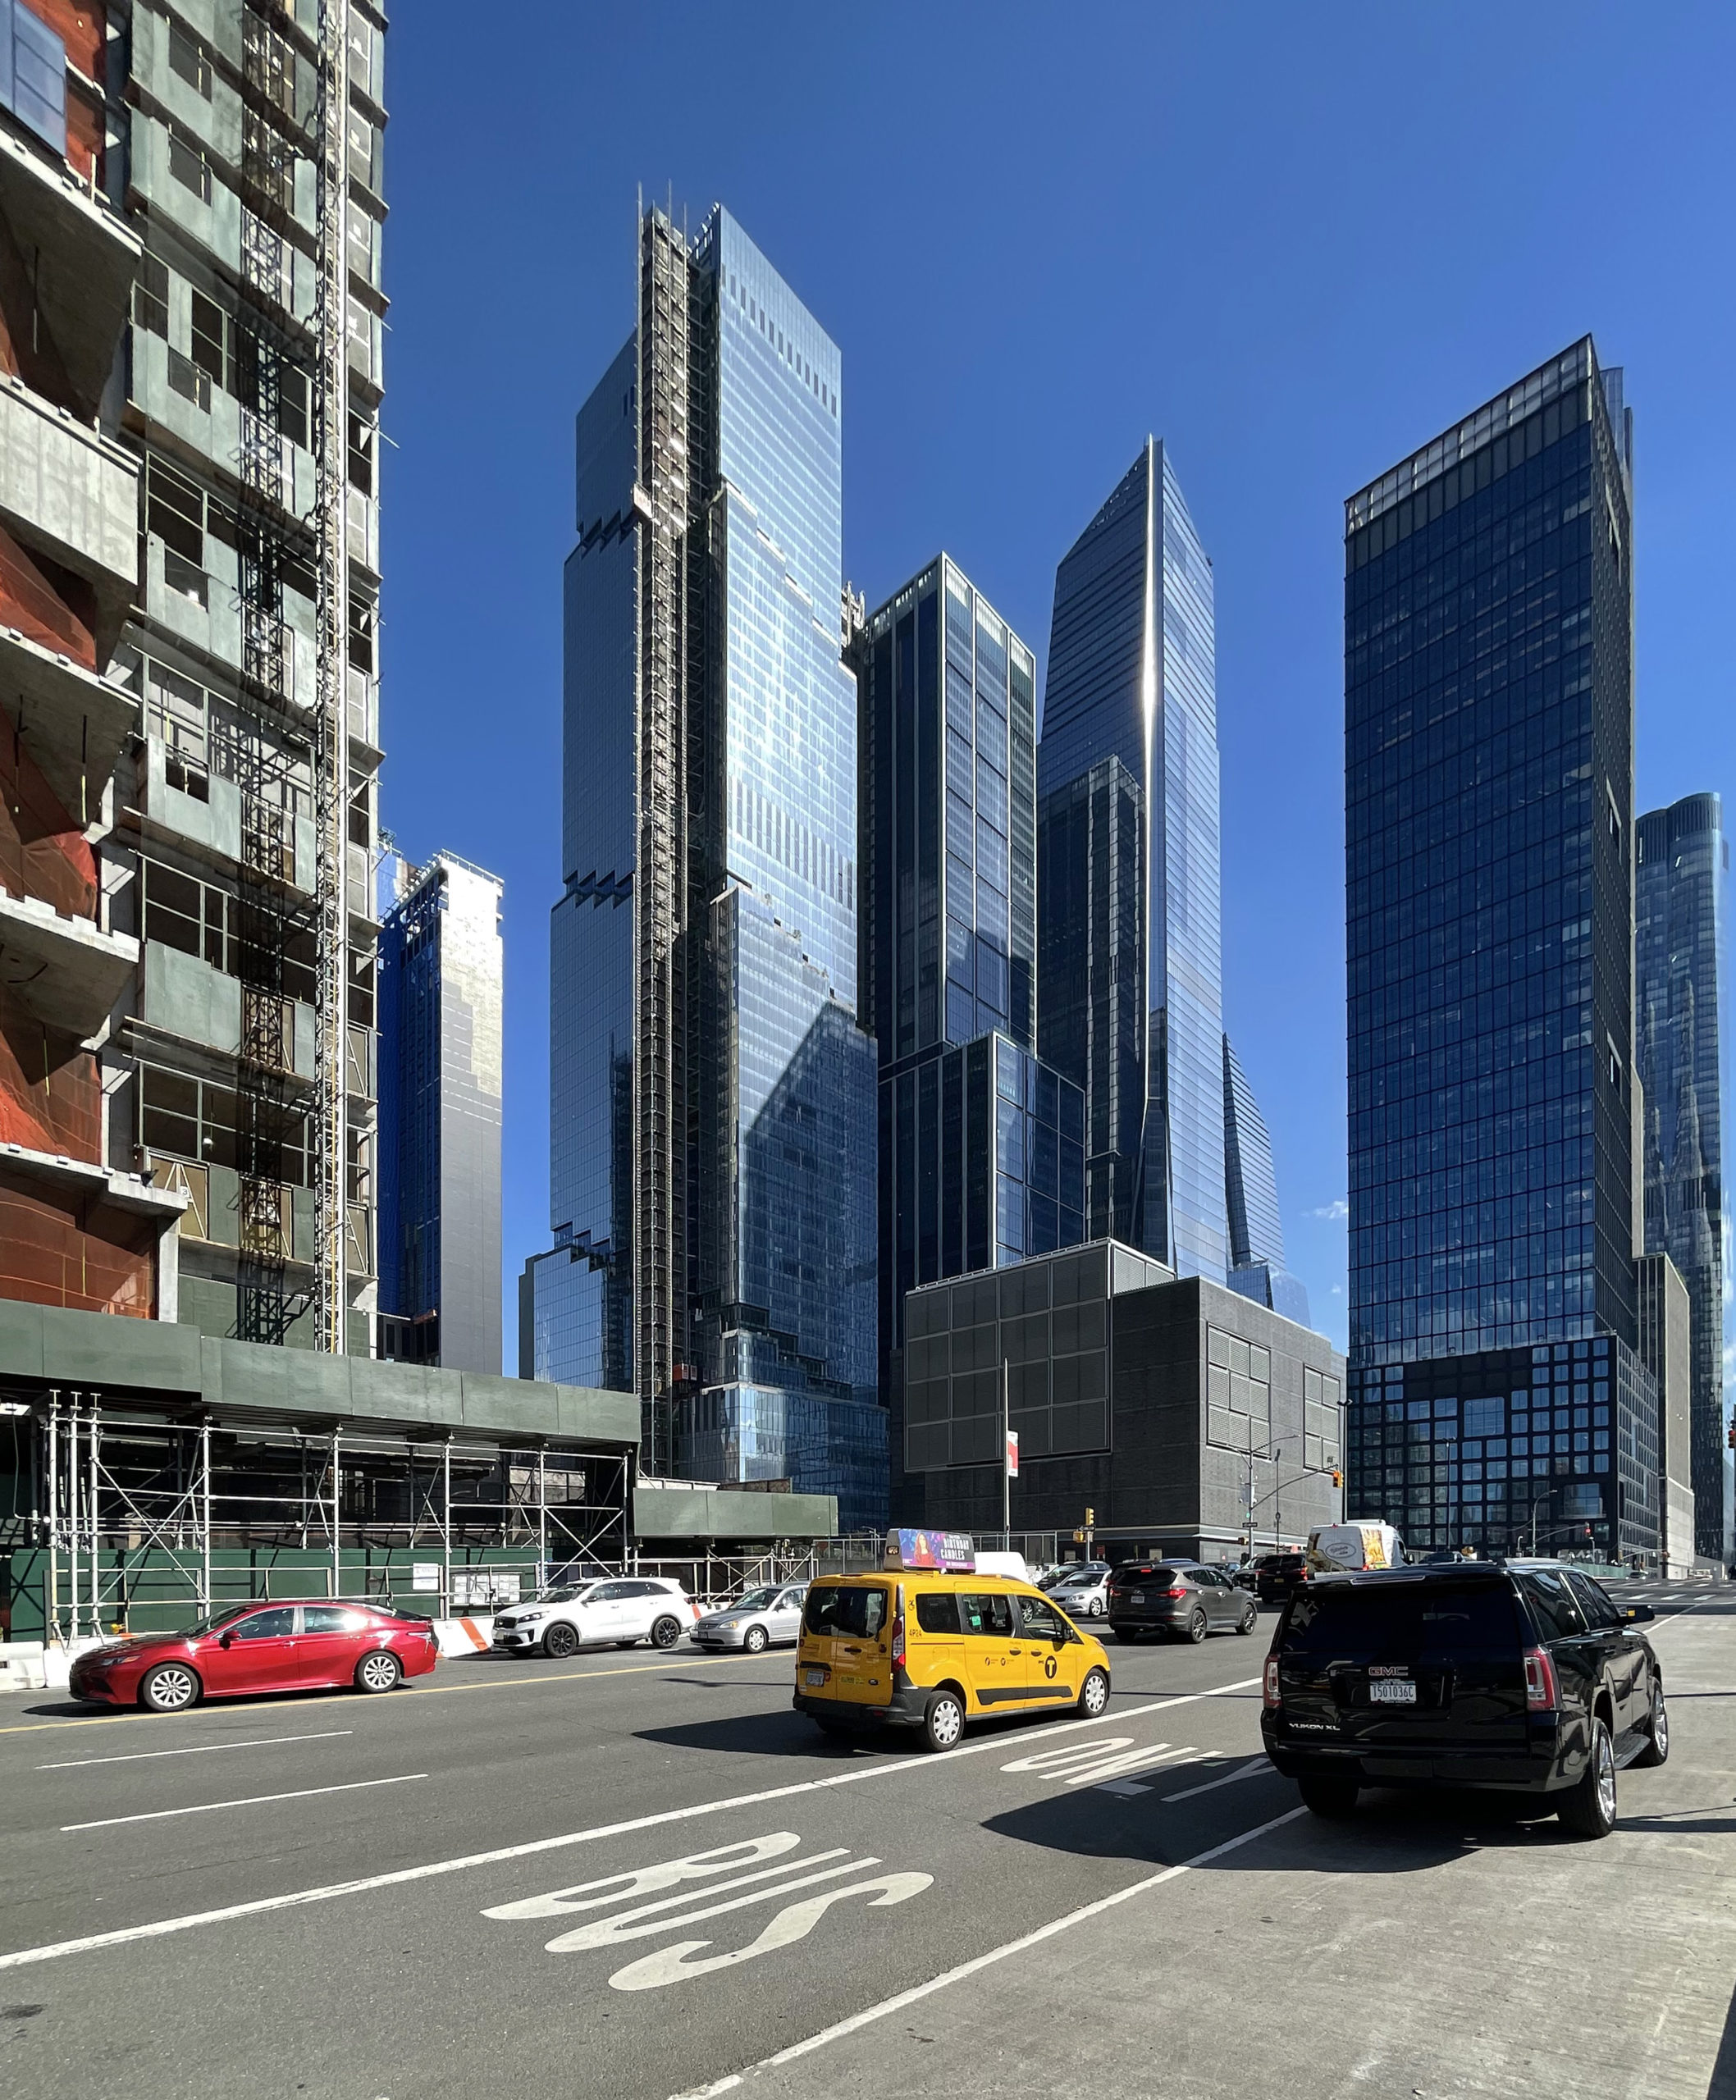
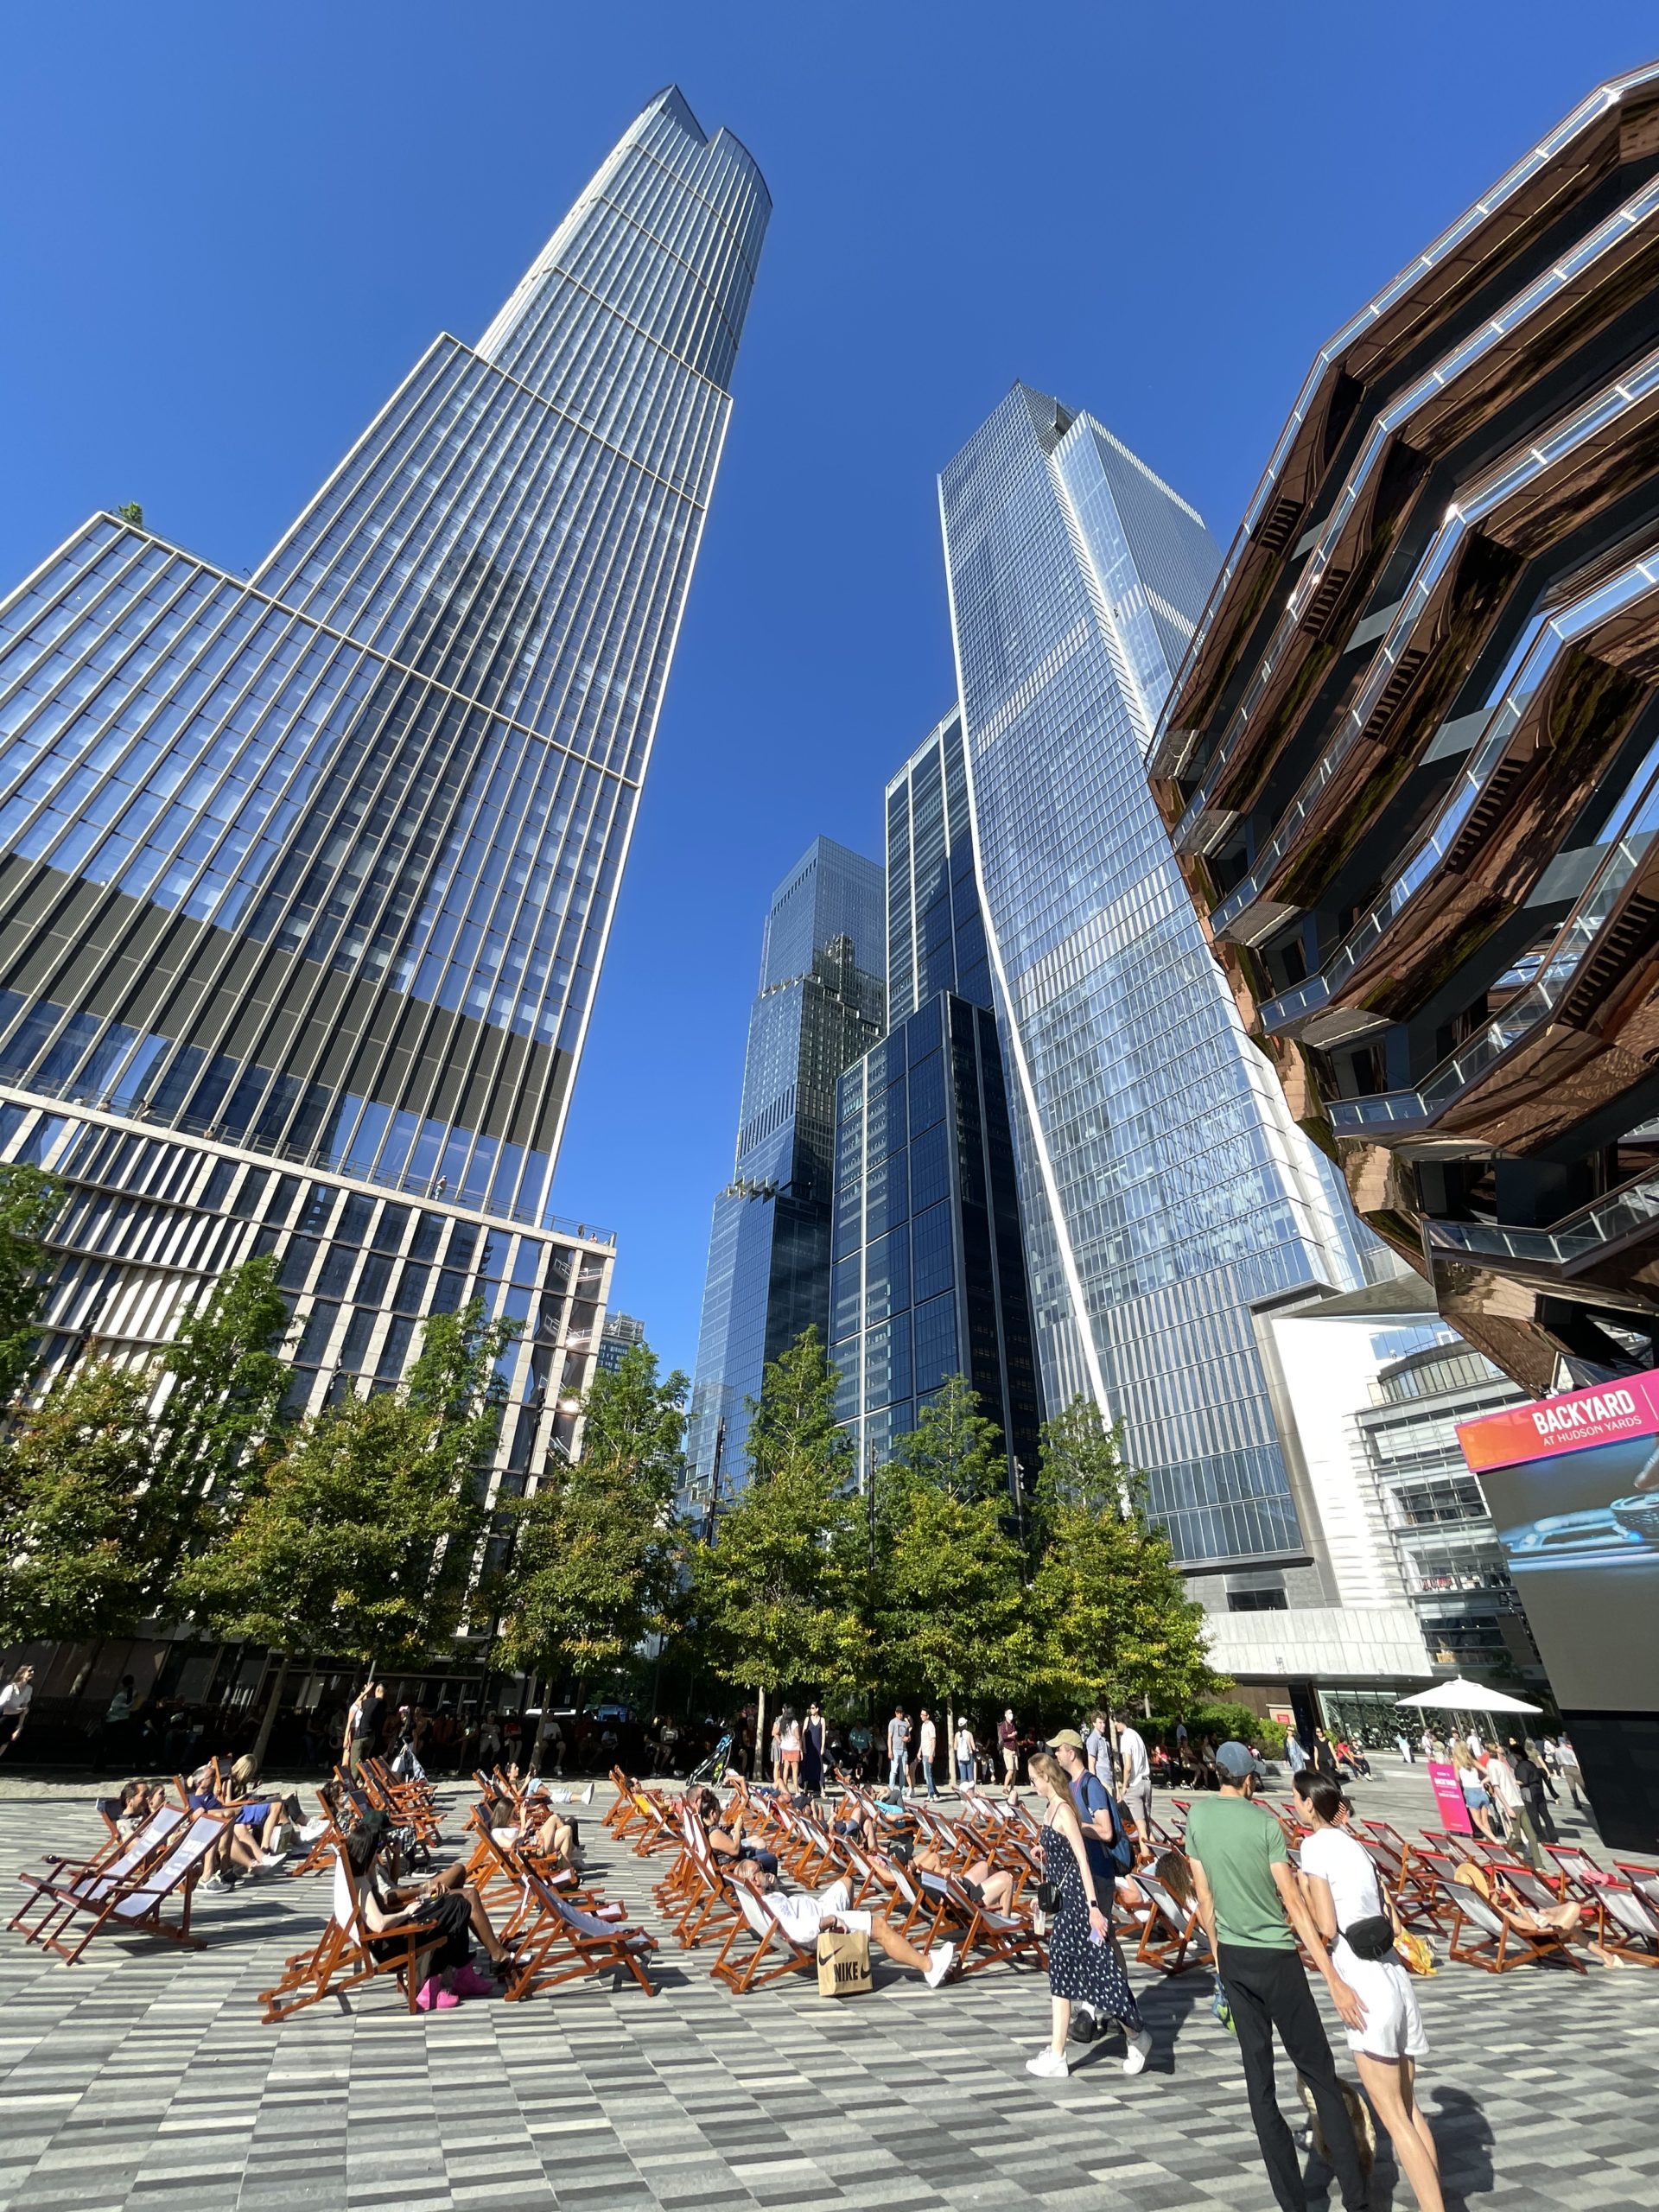
Hudson Yards. Photo by Michael Young
Subscribe to YIMBY’s daily e-mail
![]()
Follow YIMBYgram for real-time photo updates
Like YIMBY on Facebook
Follow YIMBY’s Twitter for the latest in YIMBYnews
Ok, I understand that you are pro-development and cheerlead for the City.
But you’re also supposed to be reporting. And no honest report of this length can be legit if it doesn’t mention the expiration of 421-a.
Because (as in past years when that law was due to expire) developers rush to file their plans before the law expires.
That’s a basic part of understanding this City’s real estate industry. And your omission of this is, quite frankly, astonishing.
New York needs to hire more people to speed up permits and approvals and licenses much faster. The city is extremely slow and there is so much red tape. Buildings could be built and occupied much faster.
I was also expecting that the 421-a expiration had a major effect on those numbers, especially in the outer boroughs where developers have smaller properties compared to Manhattan but make up for it in qauntity. That 421-a will give them huge savings hence the rush to get jobs filed.
Great photography
Some of the best photos of the city I’ve seen in some time. Great angles and some solid architecture. I wish I could be excited about Hudson Yards, but it really just looks like a blur of blue glass blobs from afar.