
Filing statistics for the first quarter of 2021 are in, and New York YIMBY has prepared a detailed report that analyzes the findings. During the period from January through March, applications were filed for 3,566 new residential units across the five boroughs. Compared to the first quarter of 2020, the number of buildings filed dipped slightly in January (from 163 in 2020 to 135 in 2021) and negligibly in February (from 158 in 2020 to 156 in 2021). An unexpected surprise came in March, when a total of just six new building applications were filed over the course of the month, which is a collapse compared to the 147 filings registered in March of last year. However, many of the projects filed for during this period were conceived during the height of local and global economic uncertainty. In addition, in early March of 2021, the city implemented a moratorium on permit filings for properties that had unresolved violations, which may have further deflated the total number of new buildings filed. The full Excel spreadsheet of all Q1 2021 applications is available with purchase of the Building Wire subscription.
Number of filings per proposed occupancy
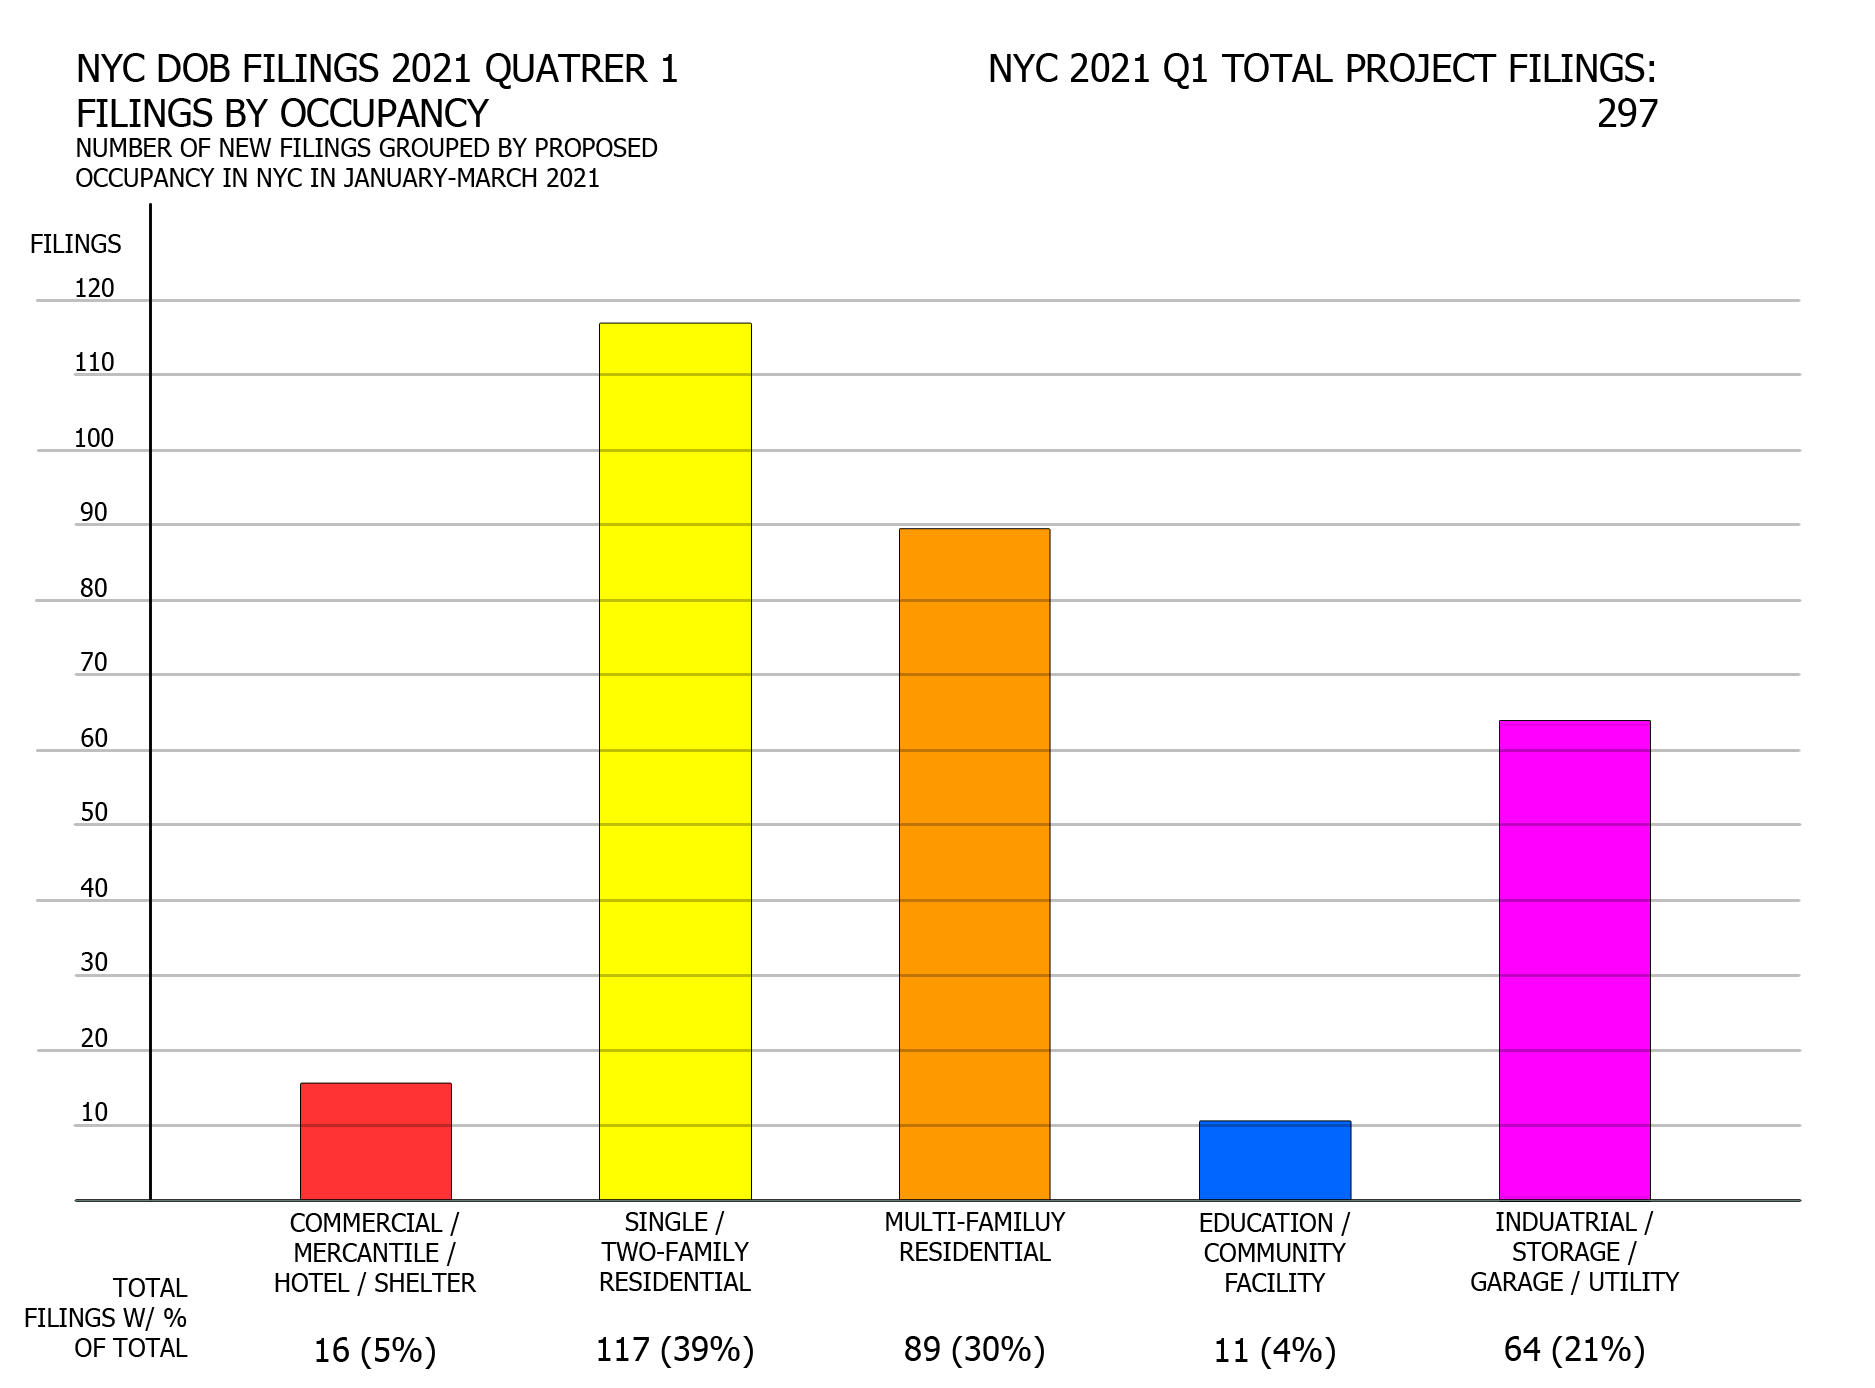
NYC DOB filings in first quarter of 2021 by occupancy. Credit: Vitali Ogorodnikov
In the first quarter of 2021, single- and two-family homes emerged as the dominant category among new construction filings, representing 39 percent of the total, followed by multi-family building filings, which accounted for 30 percent of the share. The figure represents a skew in favor of smaller-scale residential construction when compared to quarterly averages from last year, when both single/two-family and multi-family categories accounted for 36 and 37 percent of the quarterly average totals, respectively.
The remainder of the categories stayed roughly proportional to their quarterly counterparts from last year, each noting up to a three-percent difference in their overall share.
In terms of sheer filing volume, each category saw a notable drop compared to last year’s average. In 2020, around 444 new construction filings were submitted per average quarter. By contrast, the first quarter of 2021 counted just 297 filings, accounting for reductions in every category.
Given ongoing uncertainties in the near-term future of both office and hotel real estate markets, it is unsurprising to see that the number of filings for the category fell by half when compared to last year, from an average of 31 per typical 2020 quarter to 16 in Q1 2021. The numbers include six hotel filings, which will hold a total of 871 rooms. The tallest by floor count and largest by room number is the 13-story, 369-room hotel planned at 144-02 135th Avenue in South Jamaica, Queens, near JFK Airport. Unlike last year, so far this year no filing was listed as a shelter, though it is not impossible that some of the planned hotels will indeed be used as such.
Residential filings saw a great reduction compared to last year’s quarterly averages, with single/two-family filings dropping from 159 to 117 and multi-family filings seeing an even greater decrease from 164 to 89. In contrast, the educational/community and storage/garage/utility categories observed only slight dips, from 14 down to 11 for the former and from 78 down to 64 for the latter.
Sven (left). Photo by Michael Young
Floor area per proposed occupancy
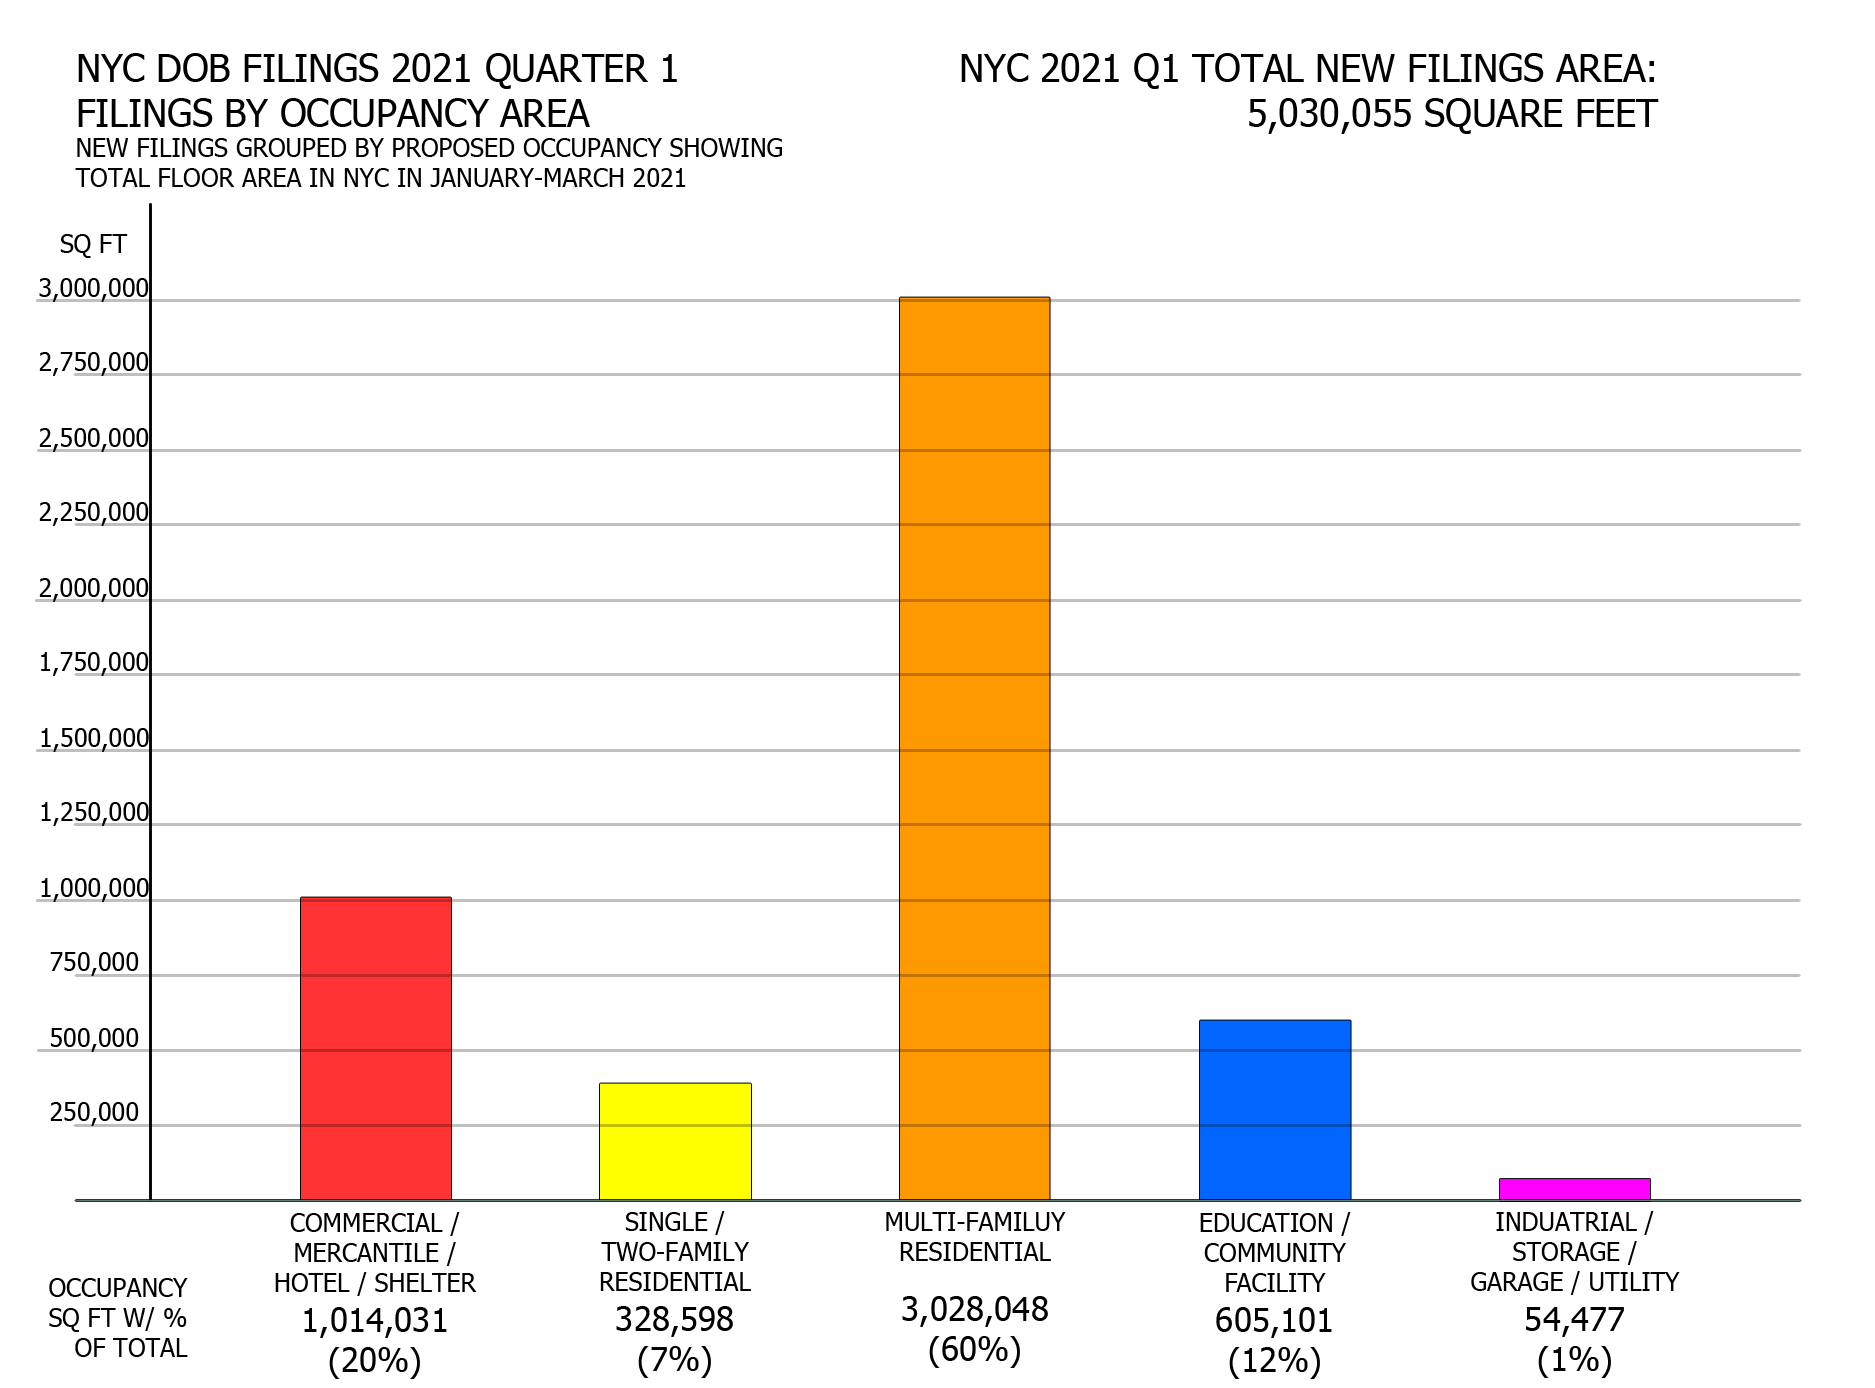
NYC DOB filings in first quarter of 2021 by proposed program square footage. Credit: Vitali Ogorodnikov
In the first quarter or 2021, the overall share of newly filed residential and commercial floor area is similar to that of last year, with up to 4-percent variance in each of the three categories. The share allocated to educational and community facilities surged from 6 to 12 percent of overall space, and that of storage/garage/utility dropped from eight to just one percent of the total footage.
The picture is markedly different in terms of overall footage. The combined floor area filed for in the first quarter of 2021 counts just over 5 million square feet, just barely over one-third last year’s average quarterly total of 14.4 million square feet.
The 1 million square feet of commercial/mercantile/hotel space filed for in Q1 accounts for only around two-fifths of the 2020 quarterly average of 2.4 million square feet. In the last quarter, the average filing in the category measured 63,377 square feet, with the largest being the 523,188-square-foot, 70-story mixed-use tower planned at 520 Fifth Avenue (though only 353,196 square feet are classed as strictly commercial, with the rest going mainly to the 98-unit residential component).
However, a single outlier makes an immense difference in terms of commercial footage. Without the nearly 5-million-square-foot distribution facility planned at 526 Gulf Avenue in Staten Island, last year’s quarterly average for the category would add up to slightly under 1.2 million square feet, which is almost equal to the Q1 2021 figure.
The floor area for single- and two-family homes dropped by more than half, from last year’s quarterly average of 717,667 square feet down to a total of 328,598 square feet in Q1. In this category, the average filing size has been reduced from 4,514 square feet last year down to 2,809 square feet this year, likely indicating a shift from two-family to single-family filings.
Compared to quarterly averages last year, the total for multi-family filings in Q1 2020 has shrunk three times, from 9.2 million down to 3 million square feet. Average filing size went down from 56,237 square feet last year to 34,023 square feet in the first quarter of this year, indicating more modestly sized structures, a trend that is as counter-intuitive as it is unfortunate given the city’s ongoing acute housing crisis. This figure does not include the above-mentioned residential square footage planned at 520 Fifth Avenue, though its inclusion would not have dramatically altered the numbers, regardless.
Despite its surge from 6 to 12 percent in terms of overall share of the total area, the educational and community category was still reduced compared to last year’s quarterly averages, going from 876,689 square feet per average quarter in 2020 down to 605,101 square feet in Q1 2021.
The figure for the storage/garage/utility category plummeted from last year’s quarterly average of nearly 1.2 million square feet down to a paltry 54,477 square feet in the last quarter.
Elizabeth H. Berger Plaza. Photo by Michael Young
Filings grouped by floor count
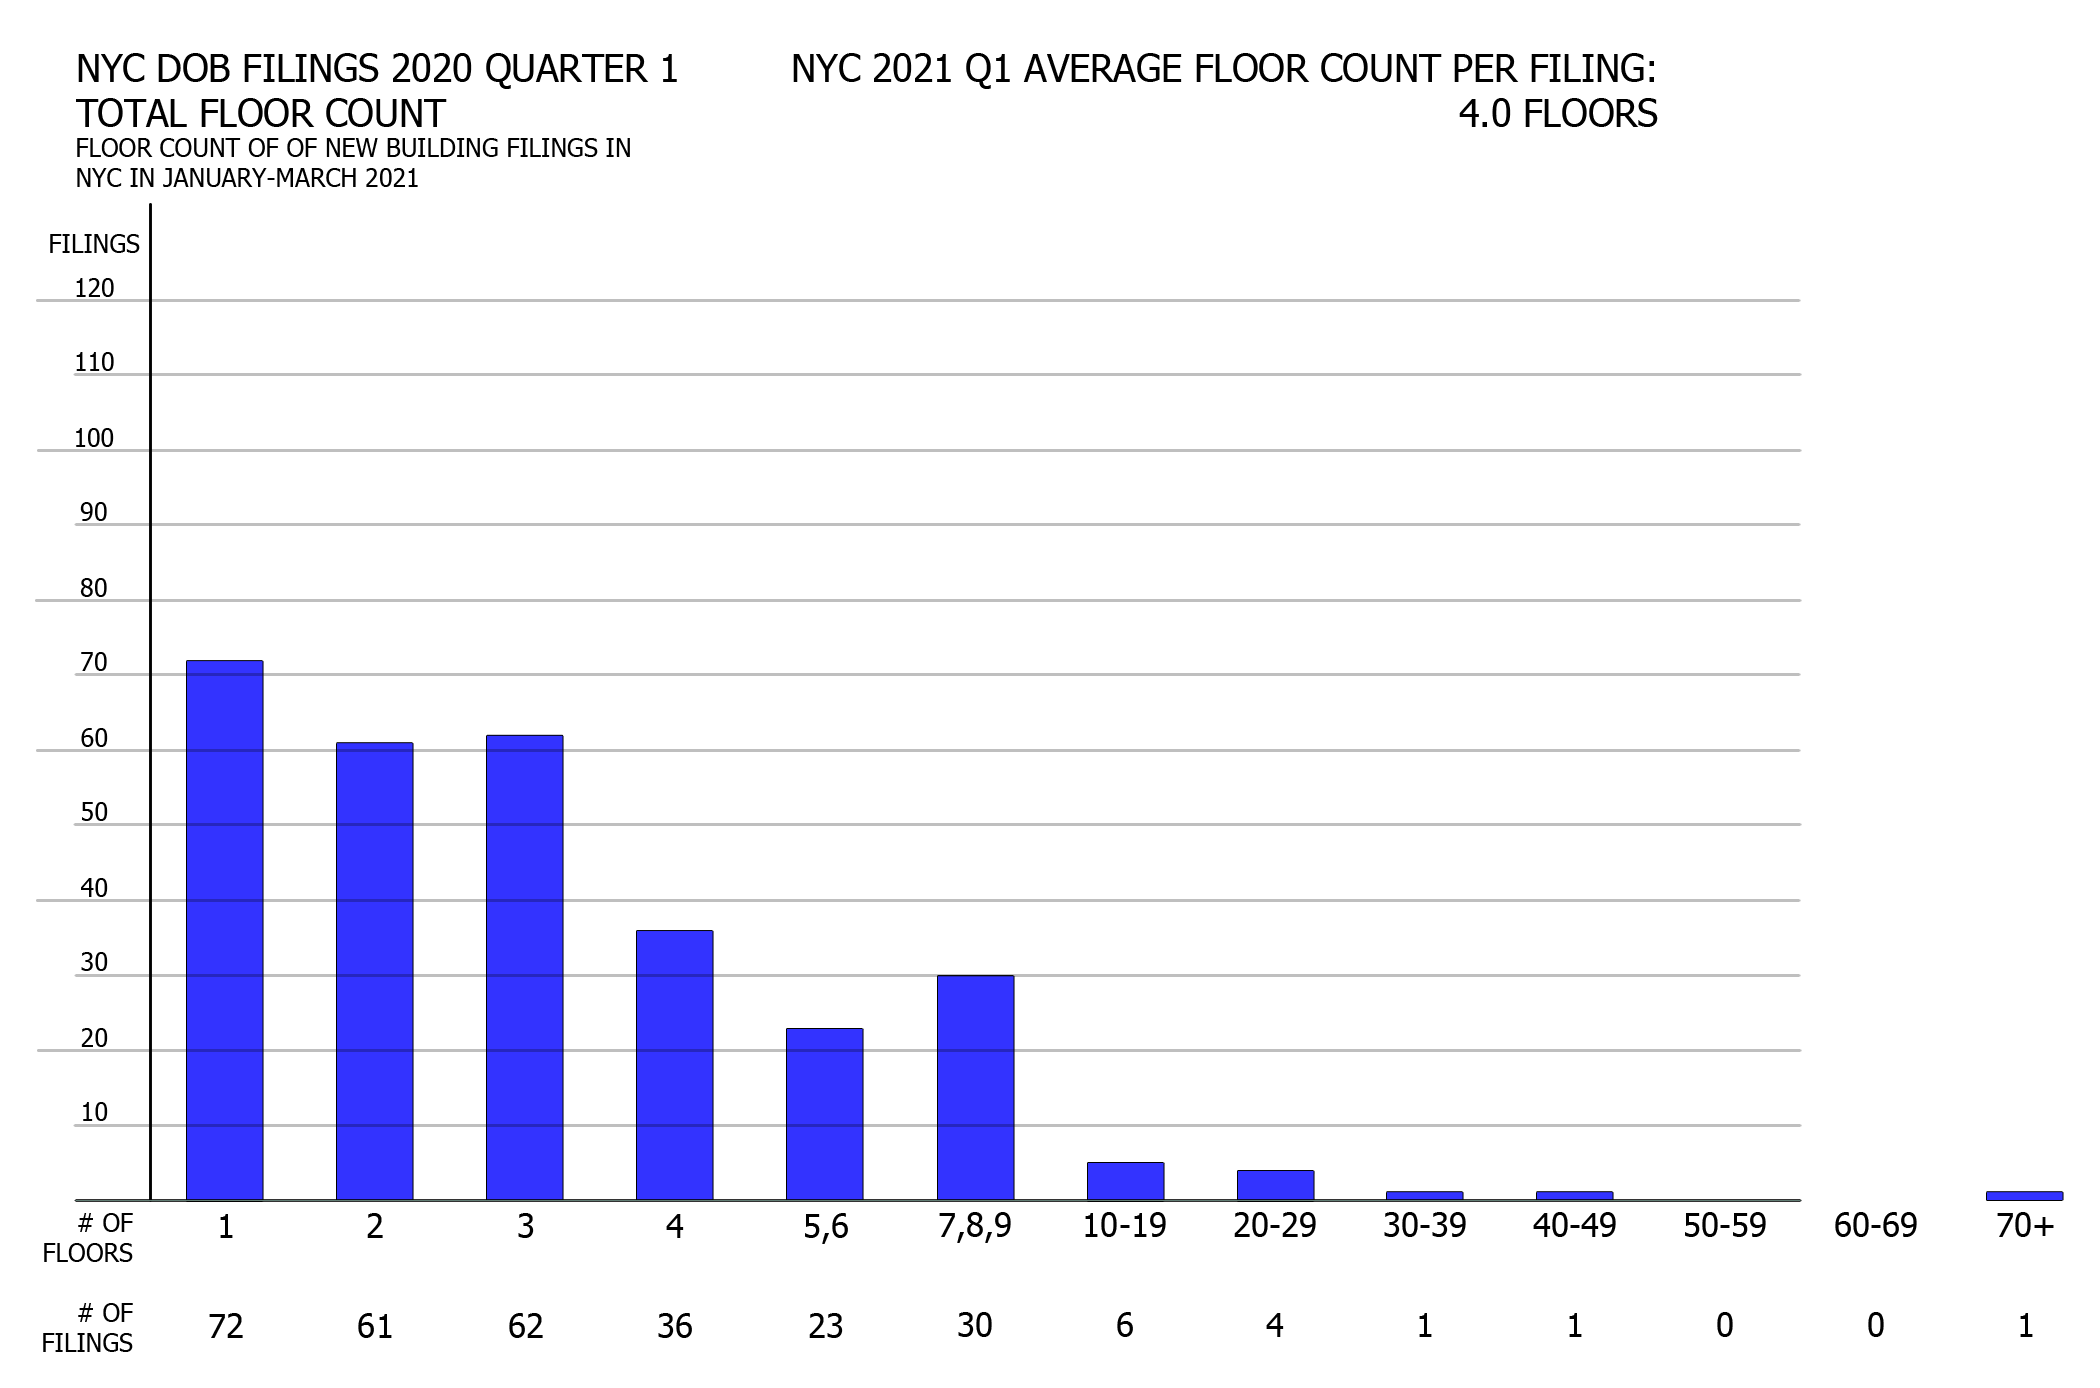
NYC DOB filings in first quarter of 2021 by proposed floor count. Credit: Vitali Ogorodnikov
Compared to average quarterly figures for 2020, the first quarter of 2021 saw a dramatic drop in the number of filings in the majority of floor count categories. The drop is most precipitous for filings for buildings that count between two and 19 floors, where each of the above-mentioned categories shrunk by around a third. Last year, these categories counted a combined total of 353 filings per average quarter. By contrast, in the first quarter of 2021 the total count sits at 218 filings, a paltry 62 percent of the prior figure.
Filings for single-story structures fared slightly better, dropping to 72 from last year’s quarterly average of 83, a 13-percent downgrade.
The number of permits issued for buildings between 20 and 49 stories has remained stable. In this category, permits for six buildings were filed over the past three months, roughly matching the 6.5 quarterly average for last year. Five of the six filings are residential, and include a trio of Manhattan towers at 550 Tenth Avenue, 12 East 37th Street, and at 270 West 96th Street, set to rise 47, 33, and 23 stories, respectively, as well as a pair of adjacent residential high-rises proposed in Brooklyn at 480 and 490 Kent Avenue, which will rise 21 and 22 stories. The only non-residential outlier is the 21-story commercial tower proposed at 360 Bowery in Manhattan.
On the bright side, despite the apparently dwindling figures, the overall floor count per average filing has remained virtually the same, dipping from 4.1 last year down to 4.0 so far this year. In addition, the tallest filing for Q1 2021 surpasses the tallest filing for the entire year in 2020 by a whopping 21 stories. In January, developer Rabina Properties filed permits for a 70-story mixed-use tower at 520 Fifth Avenue, which far surpasses last year’s tallest filing, a 49-story residential tower at 180 Ashland Place in Brooklyn. The angled, crystalline glass skyscraper will rise around 900 feet tall and will dramatically alter the skyline around Bryant Park and sets a new filing record to be beat in the following quarters.
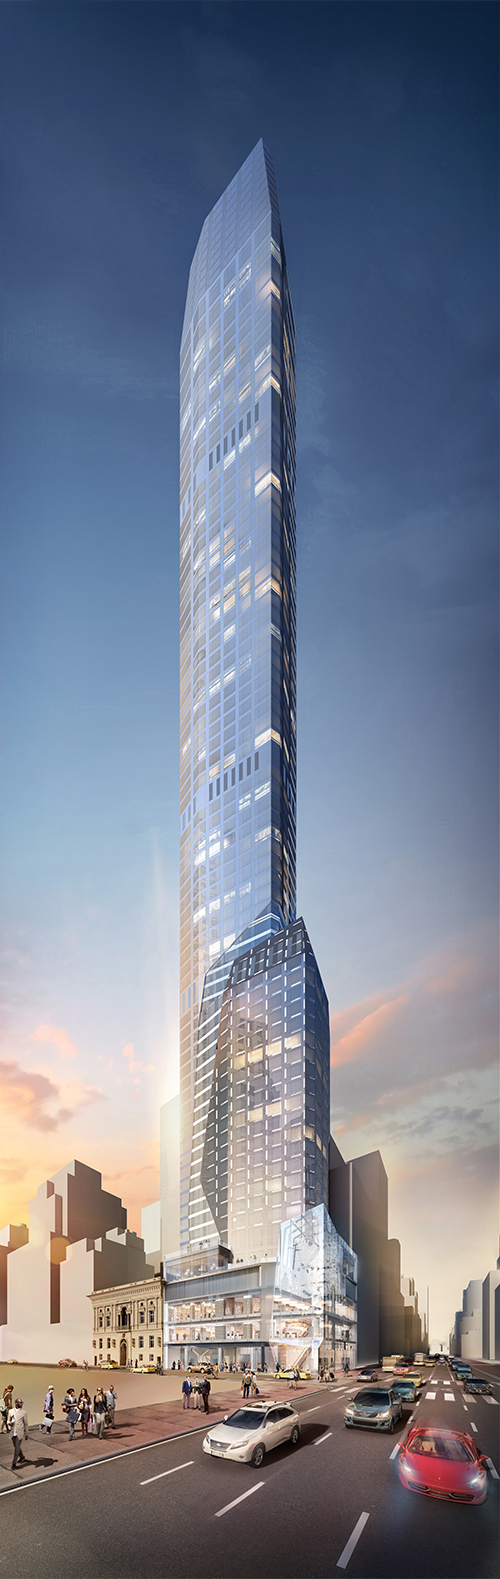
520 Fifth Avenue, image from Ceruzzi Properties
Filings grouped by floor area
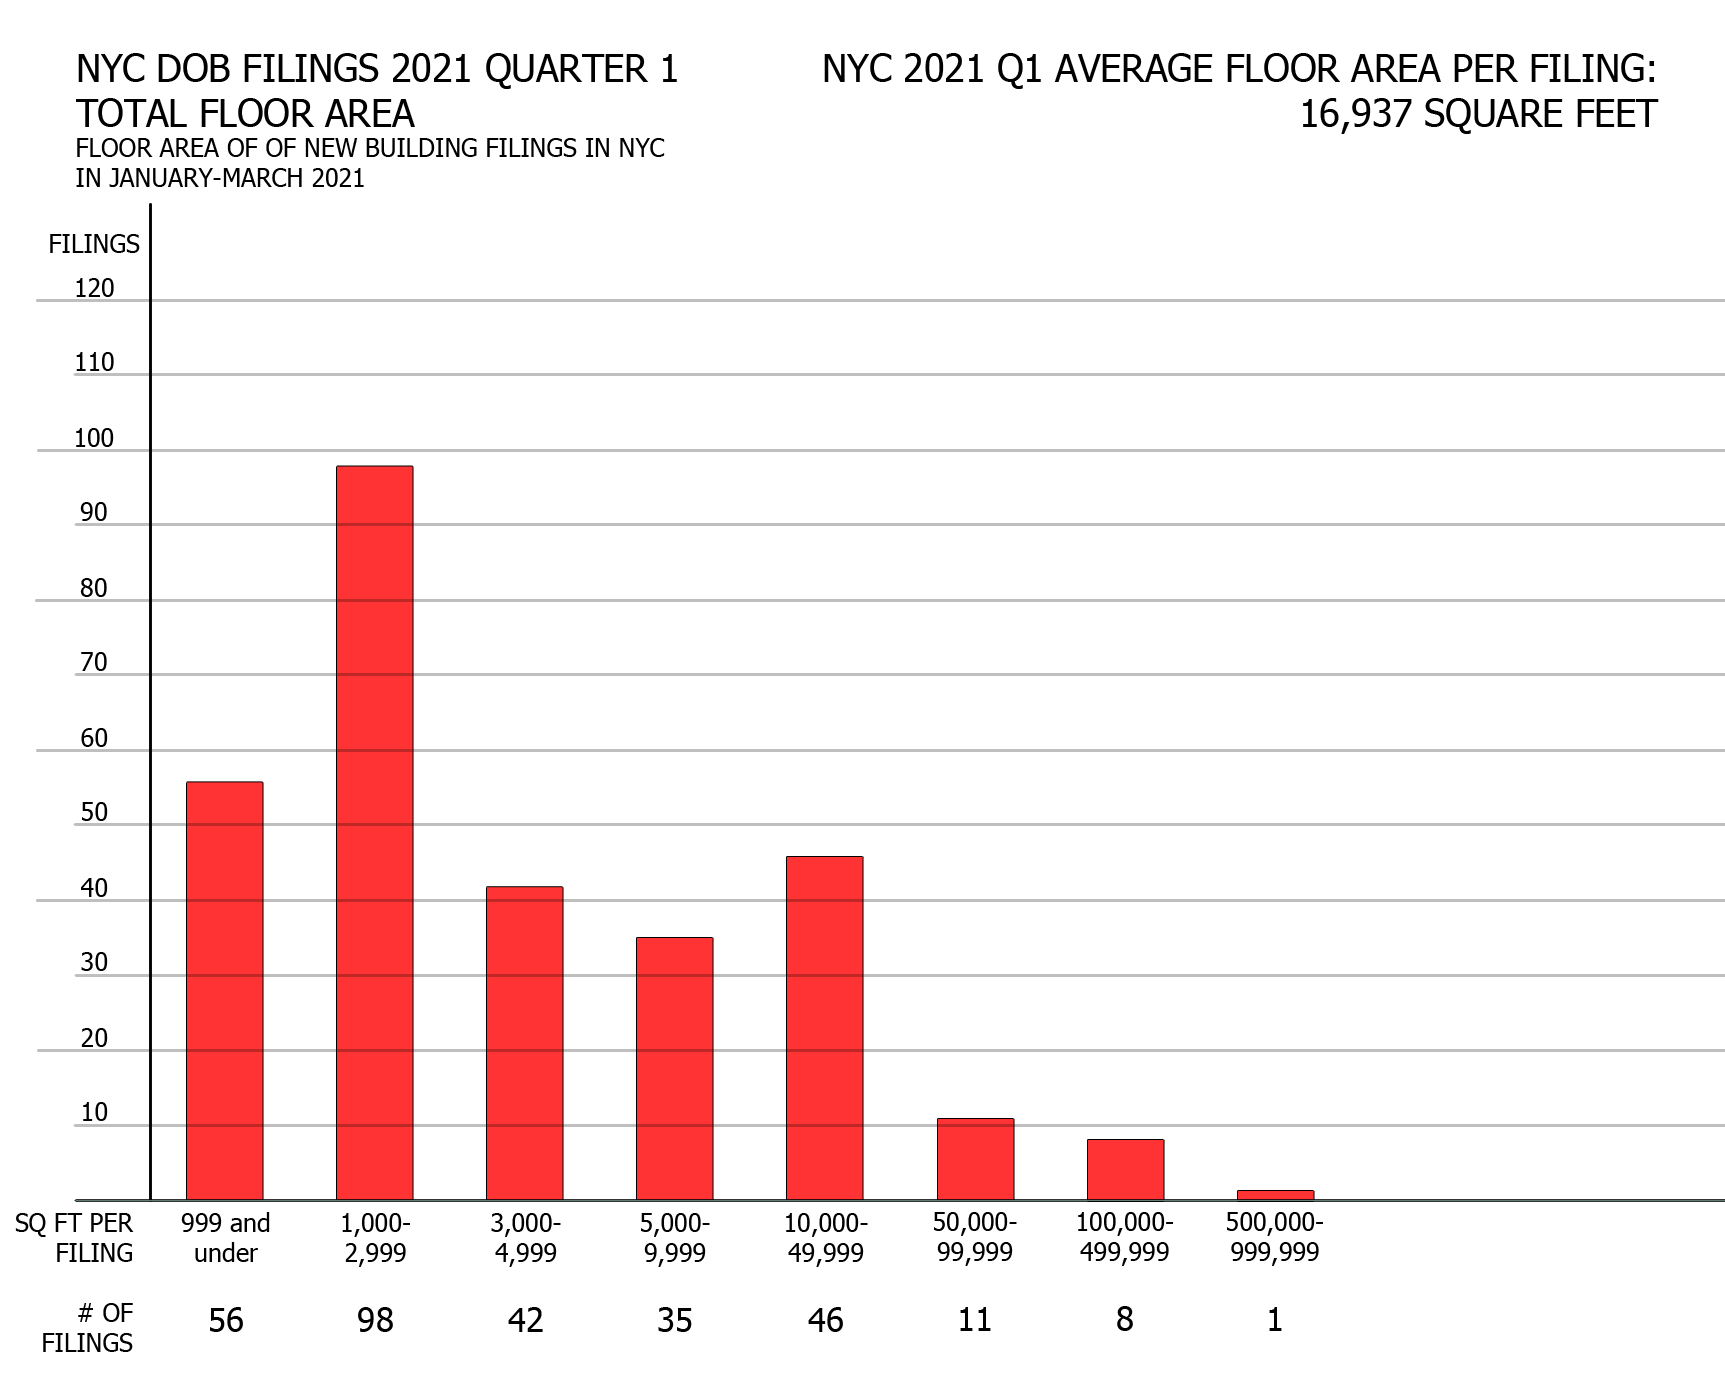
Compared to quarterly averages from 2020, the share of filings for small structures (under 3,000 square feet, generally composed of garages and one- and two-family homes) has increased notably, and now accounts for 58 percent of total filings in the first quarter. In terms of total filing count, the number of filings for small structures has declined slightly from last year’s averages, from 61 down to 56 for filings under 1,000 square feet, and from 112 down to 98 for filings between 1,000 and 2,999 square feet.
Every category with buildings measuring 3,000 square feet and above has declined precipitously. The number of filings for buildings measuring 3,000 to 4,999 square feet has dropped from last year’s quarterly average of 72 down to 42, a 42-percent reduction. The rest of the numbers have decreased even more steeply, falling by more than half in every category compared to last year.
Last year, filings from 100,000 to 499,000 square feet averaged at 20 per quarter and those between 500,000 and 1 million square feet averaged at three per quarter. In the first quarter of 2021, the figures tumbled down to eight and one for the two respective categories. No filings had totaled over 1 million square feet, as opposed to last year’s average of two per quarter.
In contrast to last year, a curious trend observed in this quarter is that the largest filings also generally happen to be the tallest, at least when considered by floor counts. Of the ten largest filings from Q1 2021, seven also happen to be among the top-ten buildings with the most floors.
These include the following projects: 520 Fifth Avenue (number one by area at 523,188 square feet and number one by floors at 70 floors), 550 Tenth Avenue (number two by area at 428,208 square feet, number two by floors at 47 floors), 490 Kent Avenue (number three [tie] by area at 380,375 square feet, number five by floors at 22 floors), 480 Kent Avenue (number three [tie] by area at 380,375 square feet, number six by floors at 21 floors), 144-02 135th Avenue (number six by area at 126,805 square feet, number eight by floors at 13 floors), 270 West 96th Street (number seven by area at 124,591 square feet, number four by floors at 23 floors), and 360 Bowery (number ten by area at 98,788 square feet, number seven by floors at 21 floors). By contrast, the largest filing from any quarter last year was the nearly 5-million-square-foot Amazon facility planned at 526 Gulf Avenue in Staten Island.
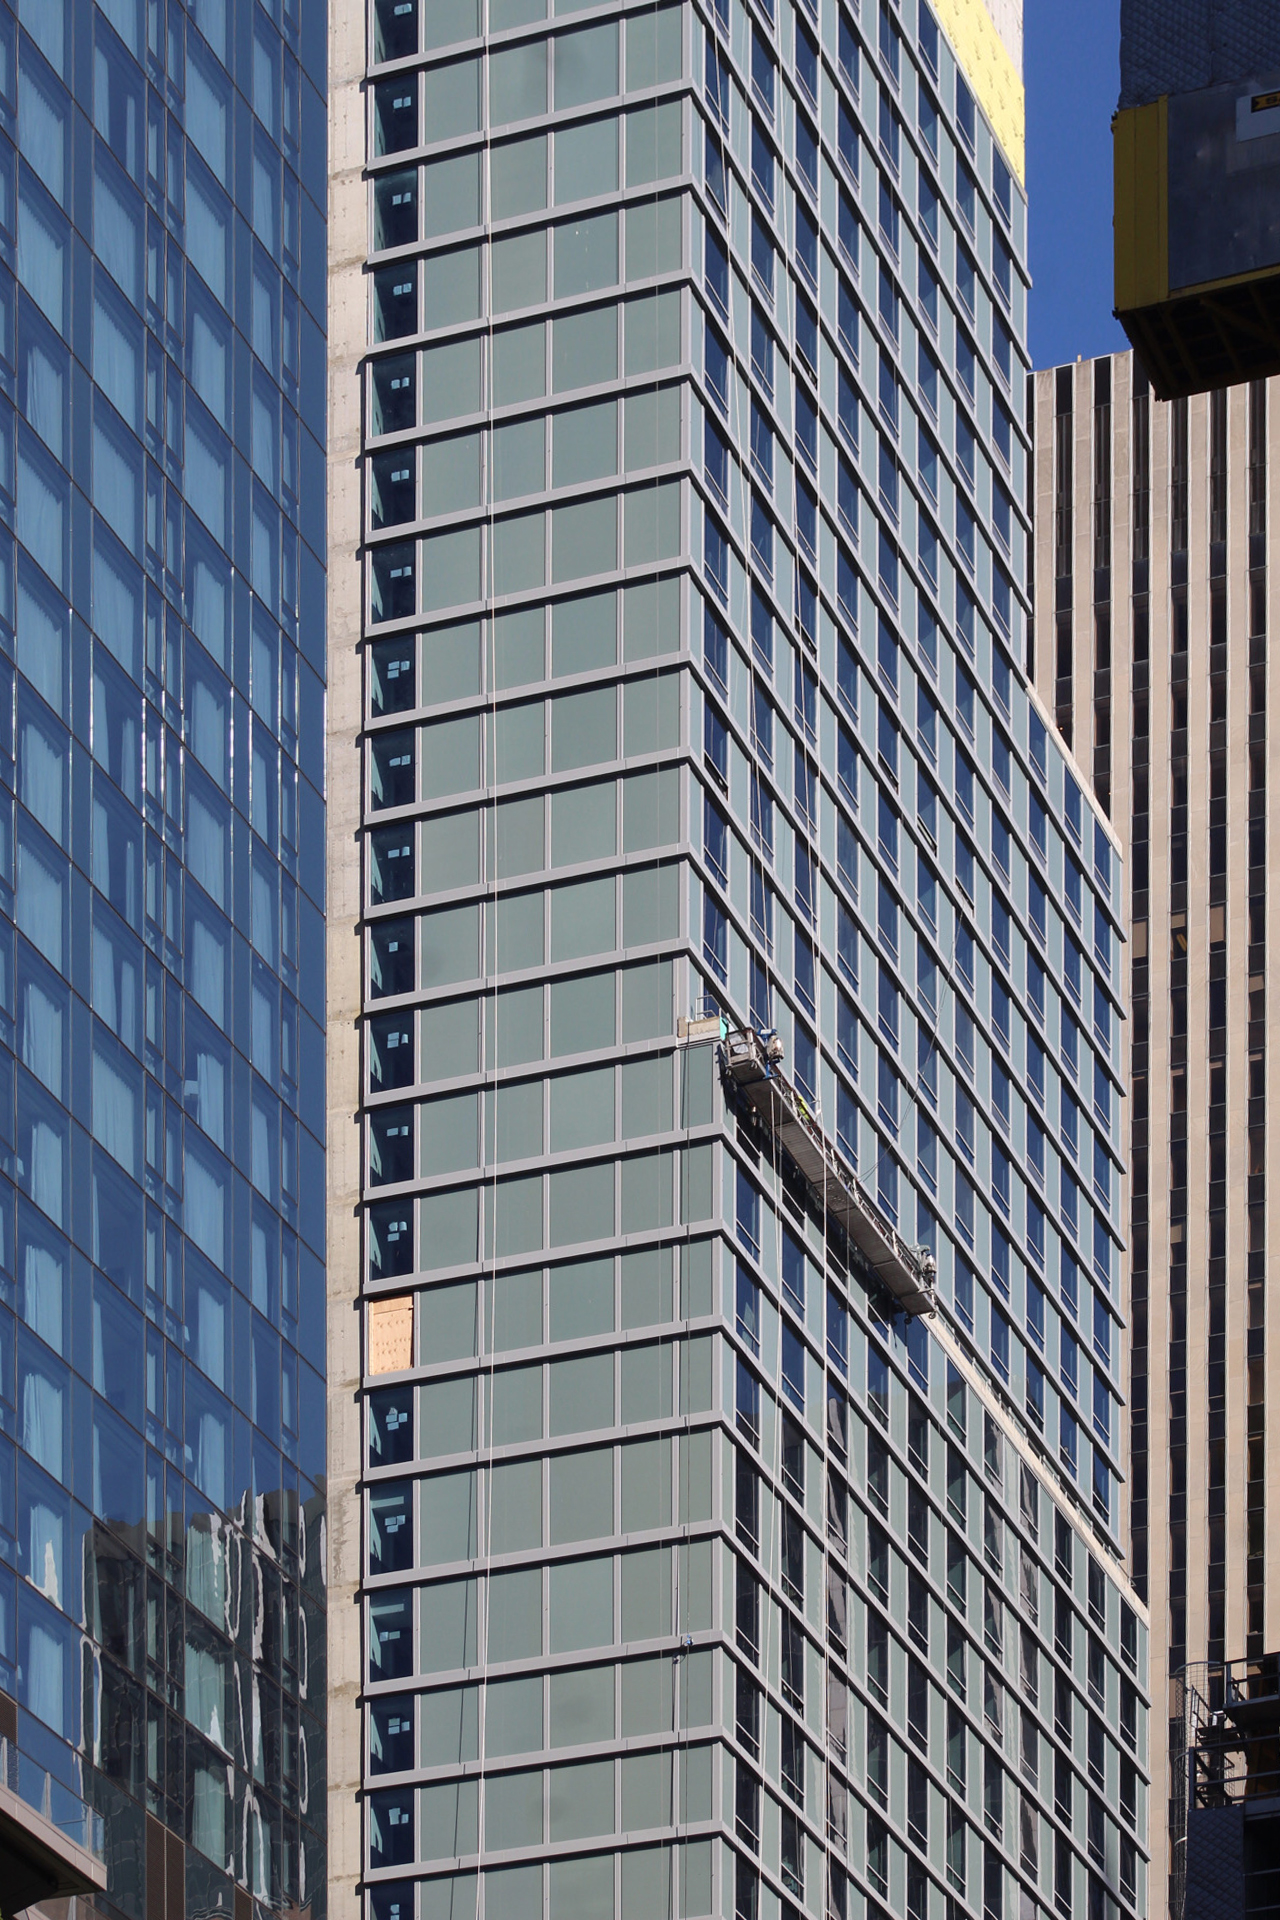
145 West 47th Street. Photo by Michael Young
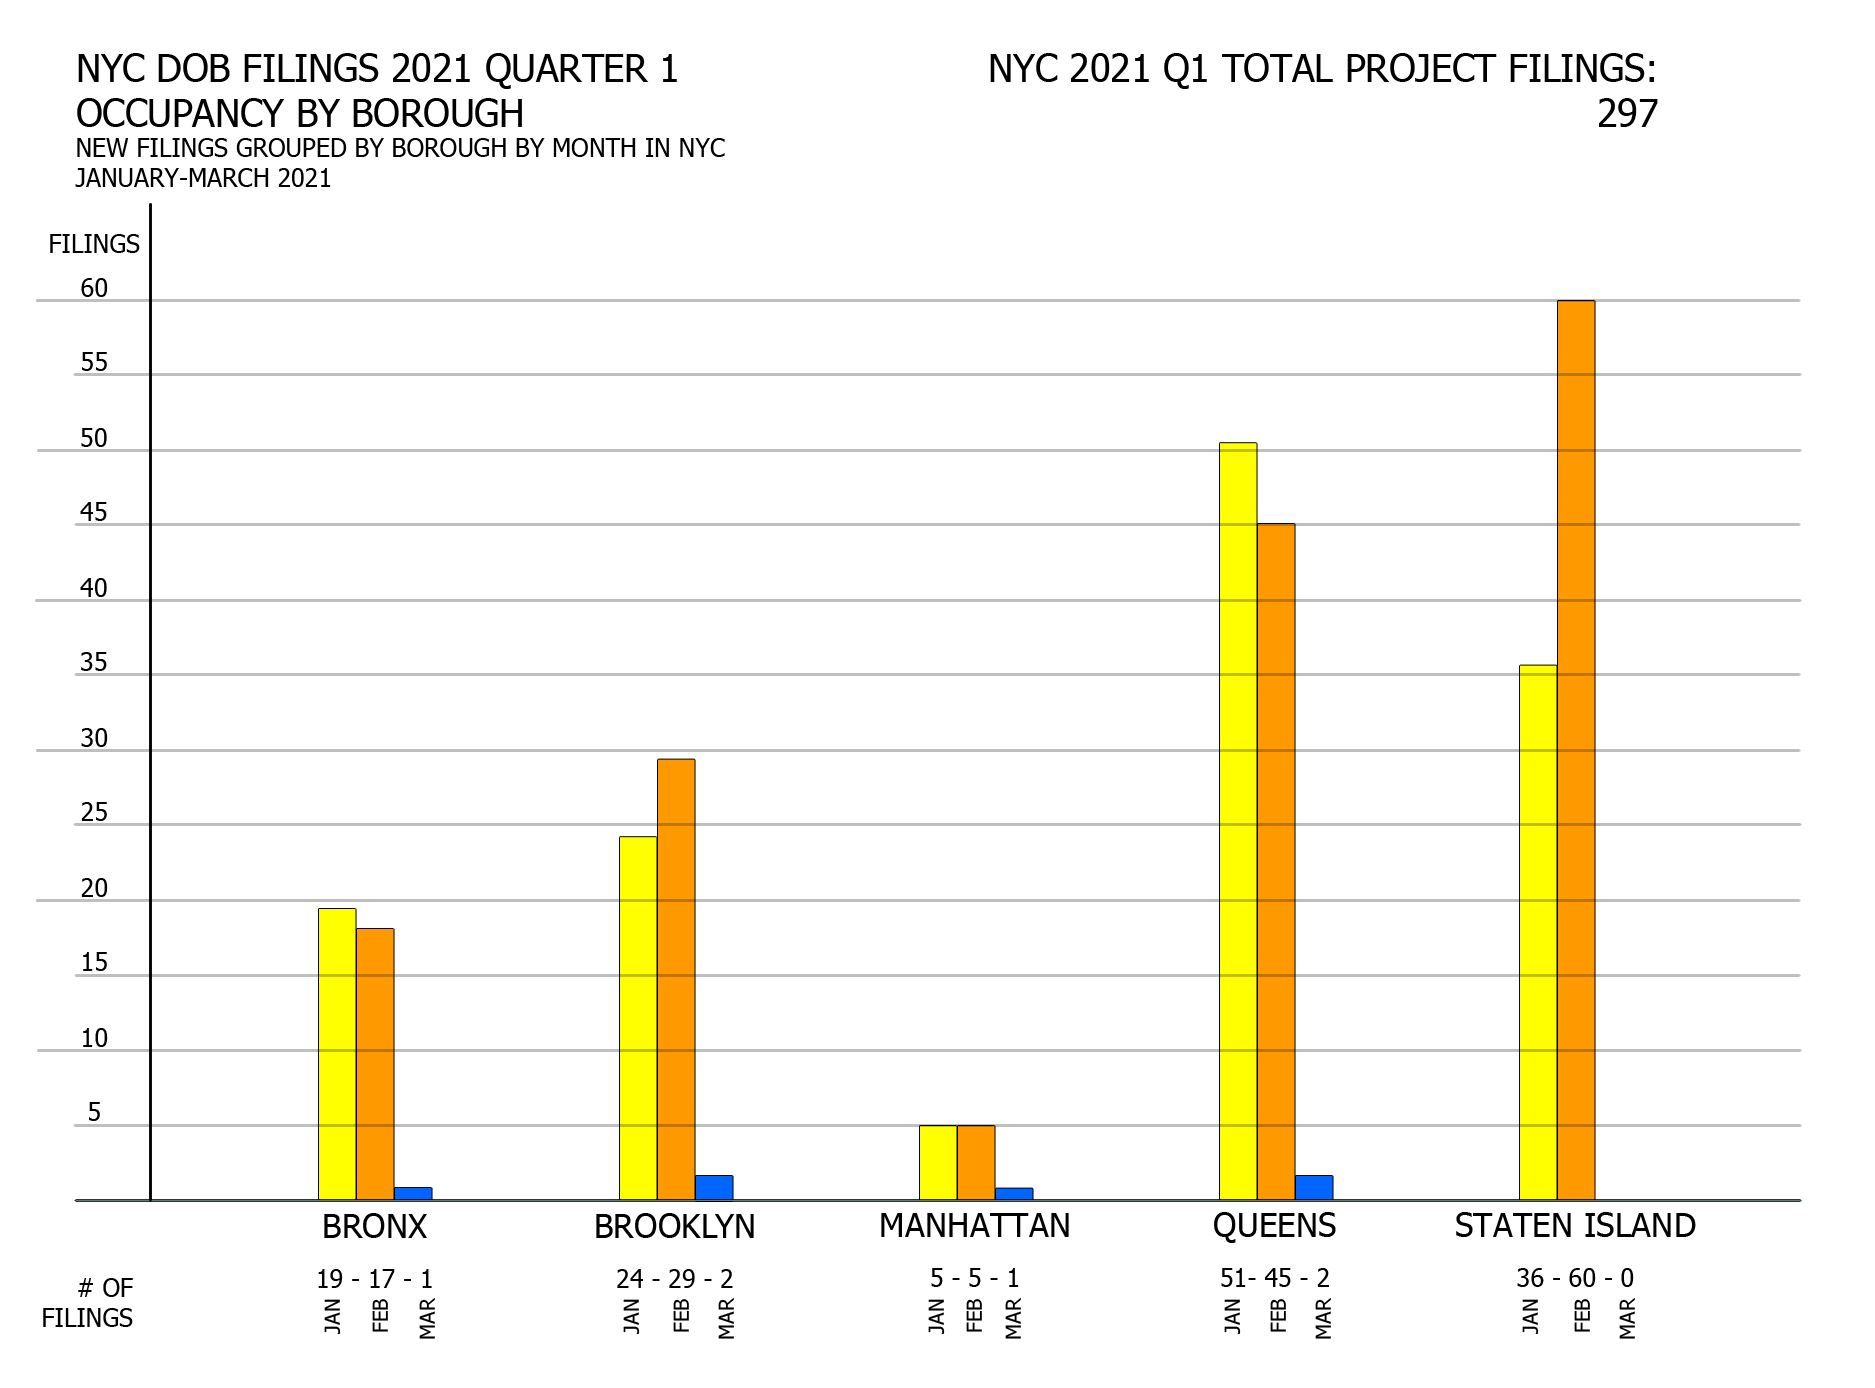
Number of filings by borough

NYC DOB filings in first quarter of 2021 by borough. Credit: Vitali Ogorodnikov
As addressed in the introduction, the number of permit filings in the first two months of this year dipped slightly when compared to last year, from 163 in January 2020 to 135 in January 2021 and from 158 in February 2020 to 156 in February 2021, and plummeted in March from 147 last year to just six filings in 2021. The March drop is largely responsible for a notable decrease in filing numbers in every borough when compared to last year’s quarterly averages.
Compared to last year’s quarterly averages, the number of filings in Q1 2021 fell by more than a quarter in Queens (from 138 down to 98) and in the Bronx (from 53 down to 37), by half in Manhattan (from 22 to 11), and by more than half in Brooklyn (from 125 to just 55). Staten Island fared slightly better, dropping by around one-tenth of the number of filings, from 107 down to 96.
378 West End Avenue and the Collegiate Church. Photo by Michael Young
Number of filings per month by borough
NYC DOB filings in first quarter of 2021 by the number of filings per month per borough. Credit: Vitali Ogorodnikov
In continuation of the previous section, for most boroughs, filing numbers slightly fluctuate between January and February and plummet in March. Between January and February, Brooklyn gained five filings (from 24 to 29), Manhattan stayed even (five filings each month), the Bronx lost two (19 down to 17), and Queens went down by six (51 to 45). In March, each of the four borough registered just one (Manhattan and the Bronx) or two (Brooklyn and Queens) filings.
Staten Island is somewhat of an outlier, as nearly doubled its filing count between 36 in January and 60 in February, and then hit rock bottom in March with a total of zero permit filings for the entire month.

Zero Irving. Photo by Michael Young
Total proposed floor area per borough

NYC DOB filings in first quarter of 2021 by total proposed floor area per borough. Credit: Vitali Ogorodnikov
Despite having by far the lowest number of filings, Manhattan leads by total proposed floor area, with nearly 1.5 million square feet filed for in the first quarter of the year. However, the number speaks volumes about the humbler numbers observed in the other boroughs when compared to their average 2020 quarterly figures.
In the average quarter in 2020, Manhattan’s filed floor area of 1.7 million square feet trailed well behind the rest of the boroughs. In the first quarter of 2021, Manhattan’s total fell by a further 10 percent down to slightly below 1.5 MSF. Astoundingly, despite the drop, Manhattan now finds itself as the leader in cumulative floor area due to a notable reduction in filed floor area across the rest of the boroughs.
Compared to average quarterly figures from 2020, the amount of floor space filed for in the first quarter of 2021 shrunk by more than half in Brooklyn, by three and a half times in the Bronx, by nearly five and a half times in Queens, and by seven and a half times in Staten Island. Most of the figures may be explained by the dramatic drop in filings in March, as discussed in the sections above.
221 West Street. Photo by Michael Young
Average floor count per borough
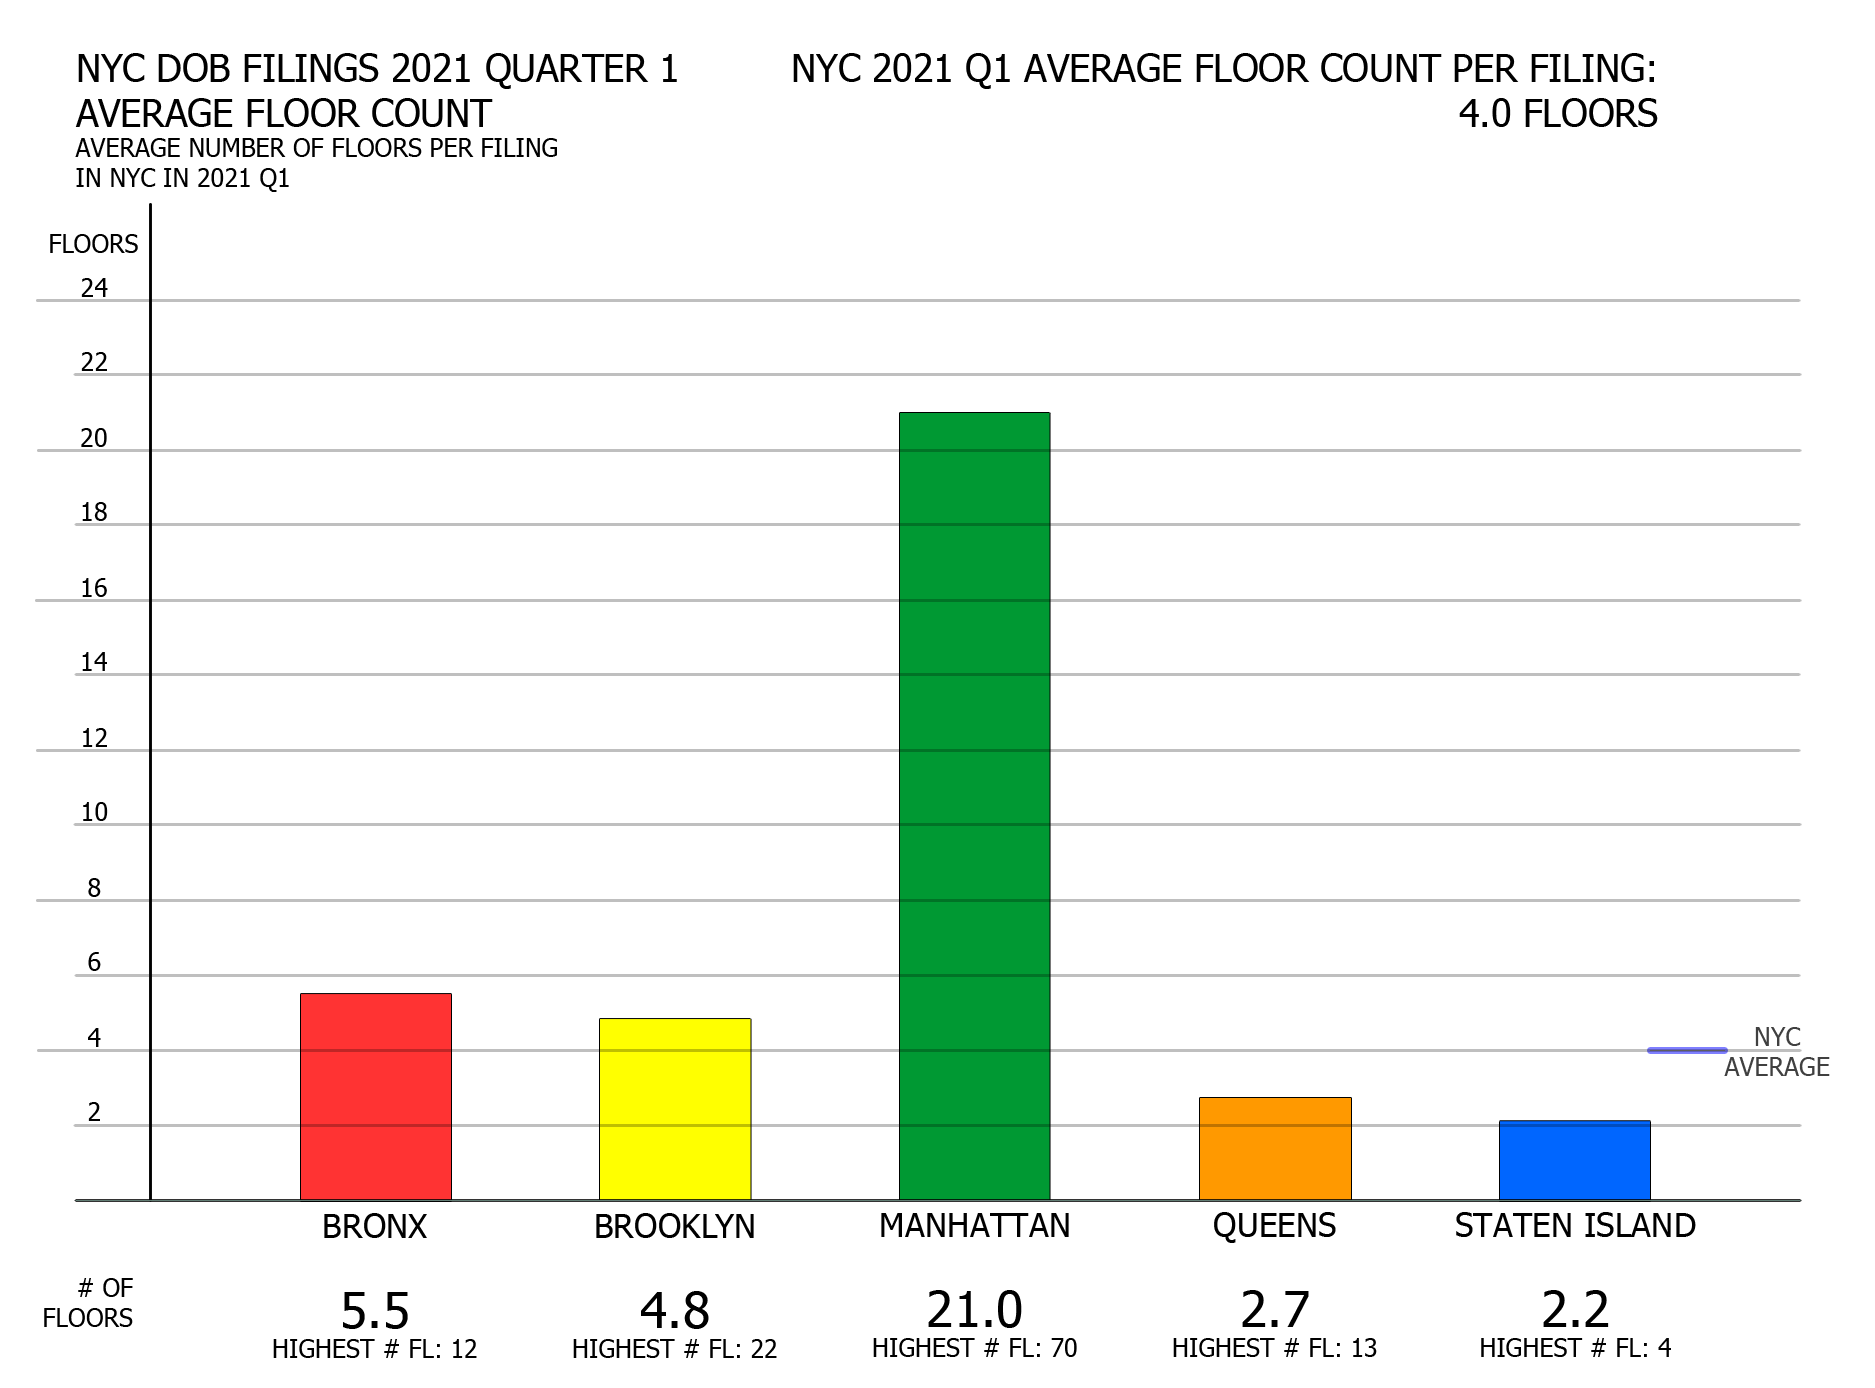
NYC DOB filings in first quarter of 2021 by average floor count per borough. Credit: Vitali Ogorodnikov
Although various filing statistics have shrunk across the board for the first quarter of 2021 as compared to averages from last year, the average floor count per filing remains virtually the same, slipping to four floors even down from last year’s average of 4.1 stories.
Manhattan, which was already far ahead of the others last year in terms of average floor counts, has effectively doubled its lead, rising from 11.5 floors to 21 stories. Despite its slight decrease in average floor area per filing, so far this year the borough has more tightly embraced its storied high-rise typology.
In the first quarter alone, Manhattan has seen two filings that exceed all of the borough’s filings from last year, namely the 70-story skyscraper proposed at 520 Fifth Avenue and the 47-story tower planned at 550 Tenth Avenue. The borough’s last-year champion, the 33-story hotel filed for at 32 West 48th Street, matches the floor count of Q1’s number three in Manhattan, the residential tower filed for at 12 East 37th Street, and will hold roughly half as many floors as are planned at 520 Fifth Avenue.
The Bronx maintains its second place with a solid mid-rise average of 5.5 floors per filing, slightly down from last year’s average of 5.8 stories. Even though the borough’s tallest building planned so far this year, the 12-story multi-family building at 2702 Creston Avenue, will stand well below last year’s filing forerunner, the 47-story residential tower planned at 355 Exterior Street, the rest of the borough’s filings rise high enough to nearly match last year’s average.
A similar situation unfolds in Brooklyn, where the Q1 2021 average of 4.8 floors per filing evenly matches that of last year, even though the borough’s tallest building planned last quarter, the 22-story multi-family high-rise proposed at 490 Kent Avenue, stands well below the planned height of the borough’s last year’s 49-story filing leader at 180 Ashland Place (aka 98 DeKalb Avenue).
The two remaining boroughs maintain their low-rise floor count averages. Last quarter, the figure for Queens dropped to 2.7 stories slightly shy of last year’s average of 3.2, while the borough’s tallest proposal so far this year, the 13-story hotel planned at 144-02 145th Avenue, will stand just around one-third of the height of last year’s 49-story borough filing title holder planned at 23-14 45th Avenue.
Staten Island effectively maintains its last year’s average, slipping from 2.3 to 2.2 floors per average filing, while last year’s 12-story leader planned at 475 Bay Street makes way for a paltry four-story project planned at 422 Saint Marks Place. However, in the coming months we may expect a much taller building to take the top spot, with several high-rises planned at 170-208 Richmond Terrace.

Sven. Photo by Michael Young
Average floor area per borough
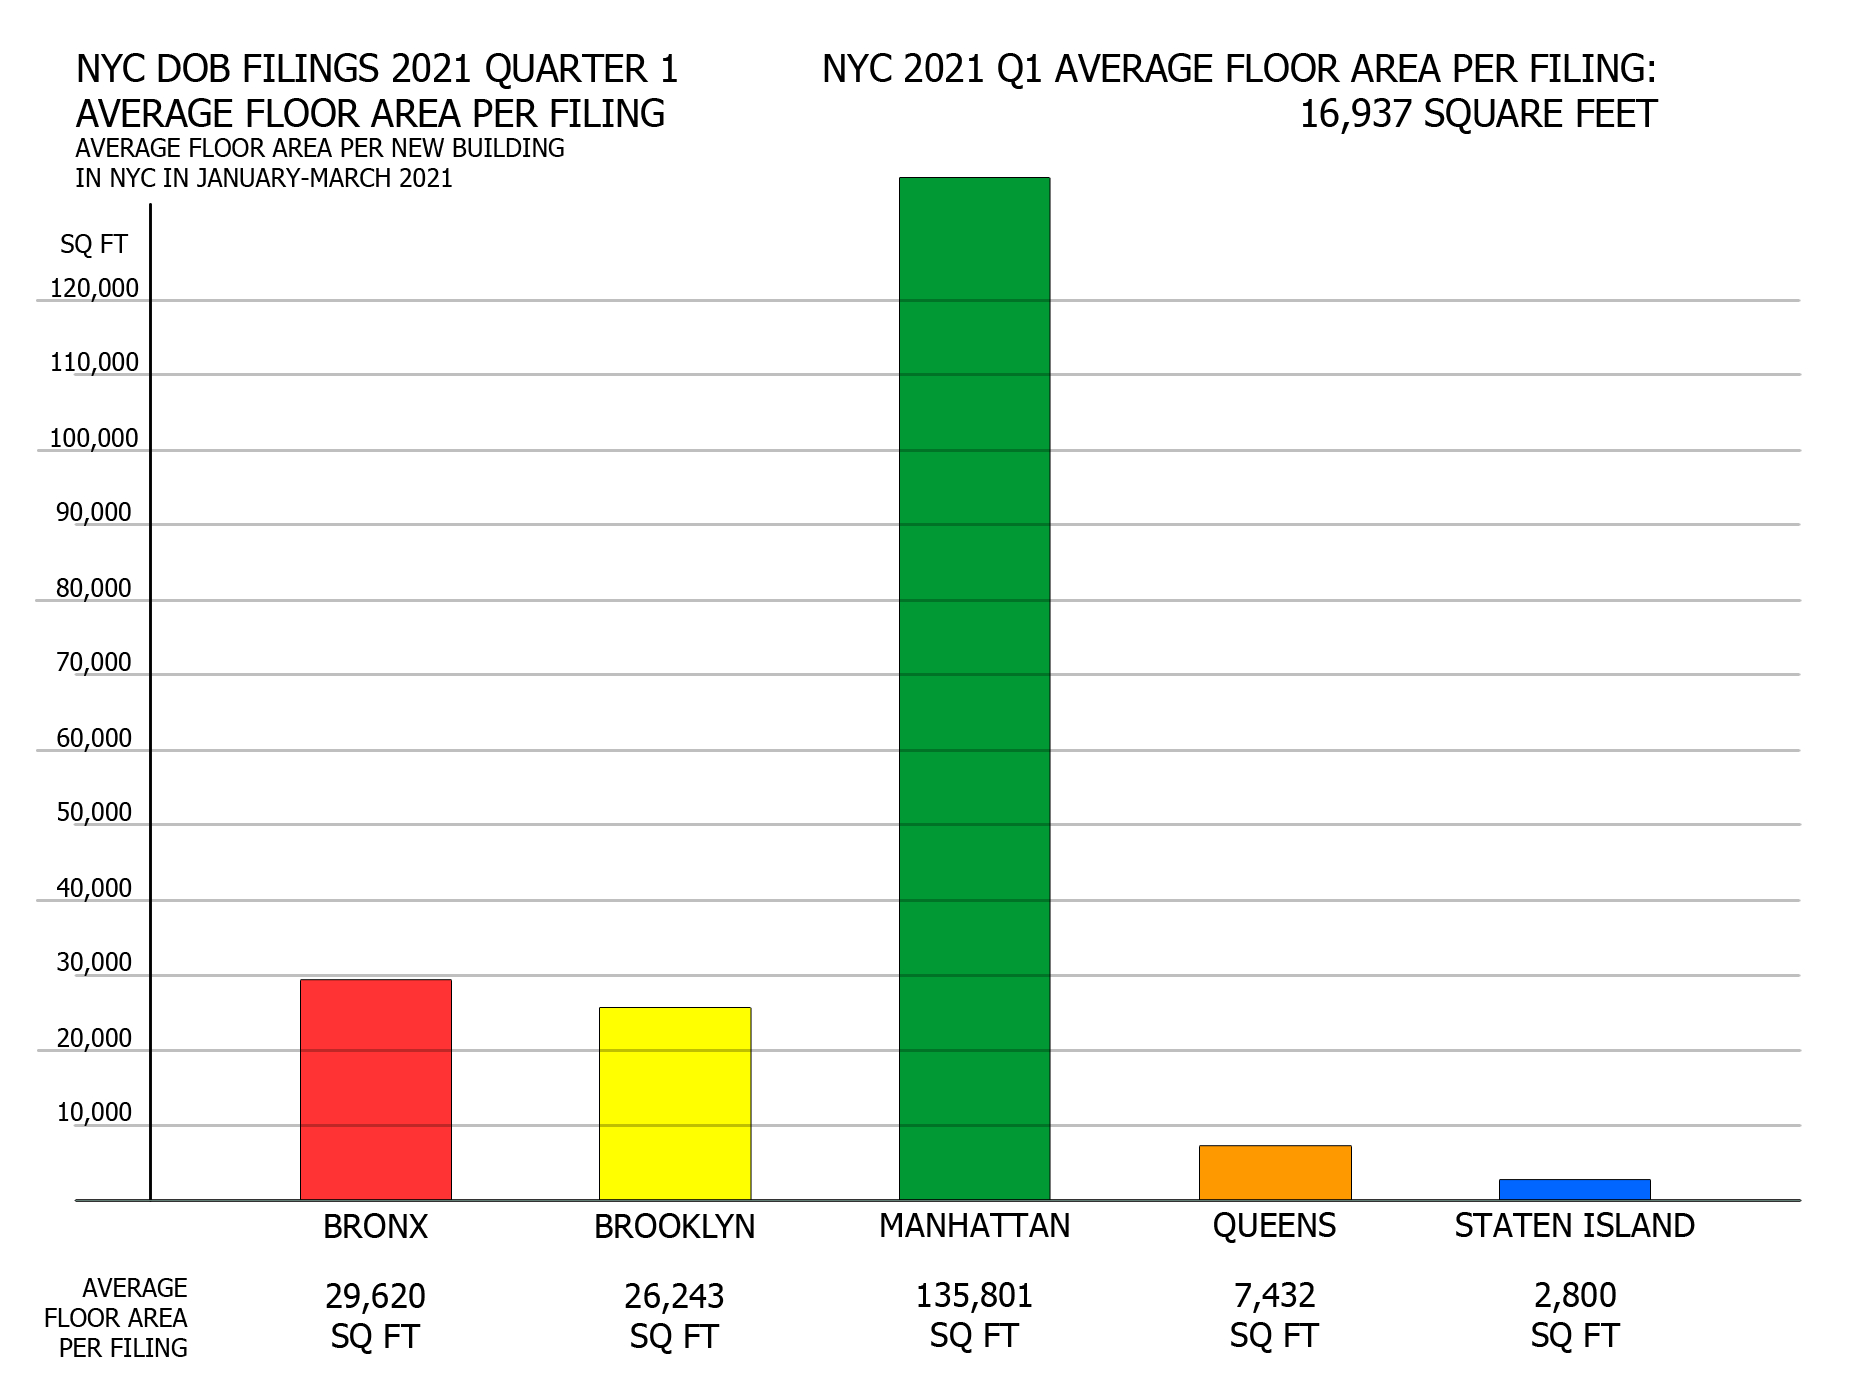
NYC DOB filings in first quarter of 2021 by average floor area per filing per borough. Credit: Vitali Ogorodnikov
Compared to an average of 32,514 square feet per filing last year, the average filing size in Q1 2021 shrank dramatically, cut almost by half down to 16,937 square feet. In terms of individual boroughs, gains and losses vary wildly.
Manhattan observed a substantial gain where the average filing size of 135,801 square feet surpasses last year’s average of 82,344 by two-thirds. Brooklyn’s total rose slightly from last year’s 23,360 square feet to 26,243 square feet so far this year.
The rest of the boroughs display much more modest numbers. The average filing size in the Bronx shrank around two and a half times in size, dropping from last year’s 72,401 square feet to 29,620 in Q1. Lack of large filings and a proportional increase in small projects is glaringly obvious in Queens’ nearly quadruple reduction from 28,532 down to 7,432 square feet, and even more so in Staten Island’s average, which plummeted nearly seven-fold from 18,832 square feet last year down to 2,800 square feet in Q1.
Staten Island is a good example of how outlying figures disrupt total averages. Without context, it may seem that the borough’s real estate market has collapsed; however, a closer look reveals that the situation is rather stable overall. Without the nearly 5-million-square-foot Amazon facility planned at 526 Gulf Avenue, the borough’s average filing size for last year would drop down to just 7,209 square feet, and would shrink further still when accounting for 19 filings that almost certainly grossly exaggerated their square footage to an apparent filing mistake, as explained in our report for last year. In other words, raw data may paint a misleading picture if it is not situated within a greater context.
145 West 47th Street. Photo by Michael Young
At face value, permit filing numbers appear dismal compared to prior quarters. However, there are plenty indicators that the situation is set to improve in the coming months. Many of the projects being filed for right now were conceived and began their development process during the most economically uncertain period of last year, so filings are certain to pick up once the local and global economies stabilize and recover. In addition, the real estate market is still adapting to new legislation, and the situation is bound to improve once developers and builders adjust to the update.
YIMBY has stood a steadfast beacon of optimism in the hardest times, when pundits and naysayers were predicting “the death of New York,” and now our predictions of a brighter future are finally beginning to pan out. We expect the city to continue looking forward and building upward.

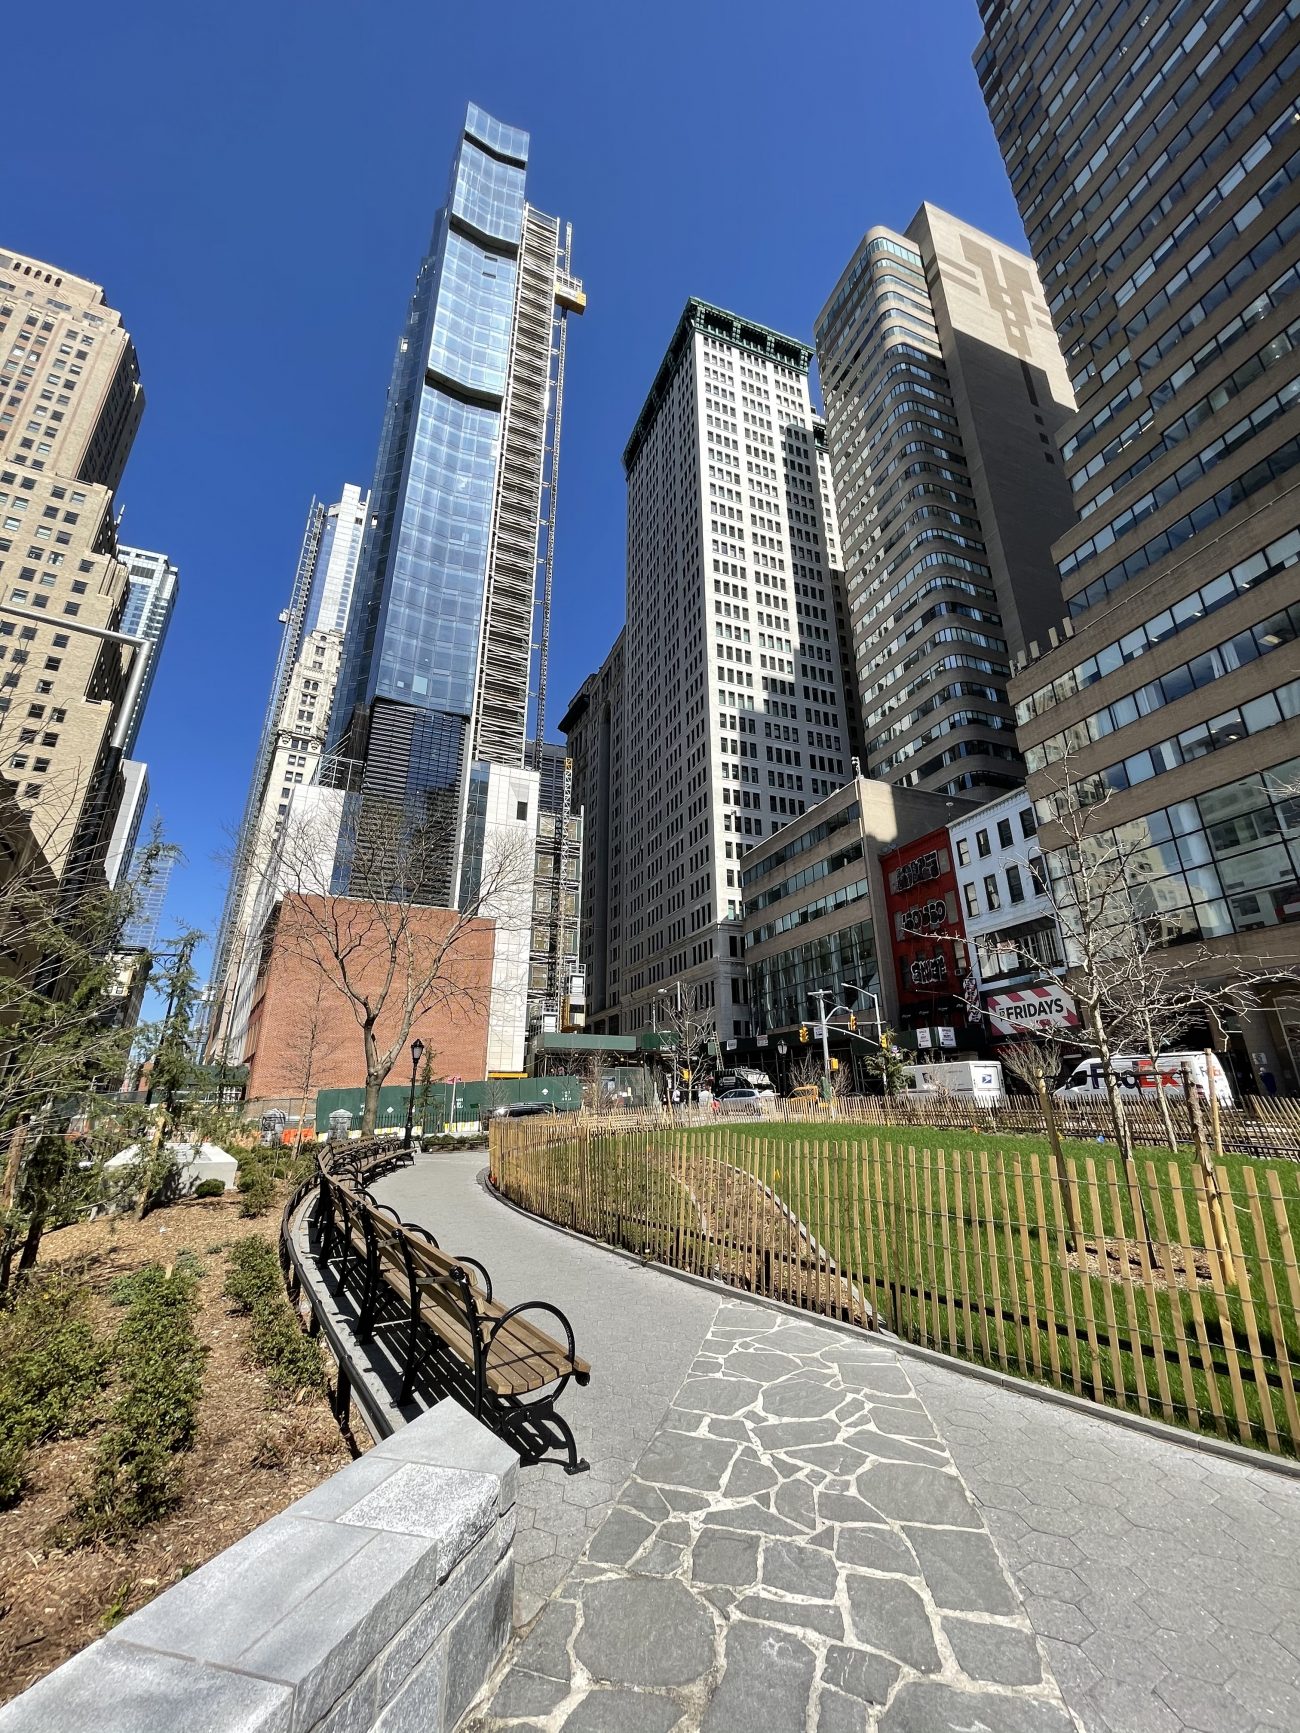
111 West 57th Street. Photo by Michael Young
Subscribe to YIMBY’s daily e-mail
![]()
Follow YIMBYgram for real-time photo updates
Like YIMBY on Facebook
Follow YIMBY’s Twitter for the latest in YIMBYnews