
Statistics for permit filings for New York City for the first quarter of 2022 are in, and YIMBY has exciting news to share. During the three months between January and March, the Department of Buildings has registered a total of 862 new building permits filings, skyrocketing past last year’s quarterly average of 504 filings. The filings add up to a total of 22.4 million square feet, nearly doubling last year’s quarterly average of 13.3 million. Among these, the filings for new residential and hotel properties yield a combined total of 19,337 units. Below we share a series of custom-made charts and analyses that break the data down into further detail. The full report is available with a subscription to YIMBY’s Building Wire service.
555 Greenwich. Rendering by Vocon
Number of permit filings per month
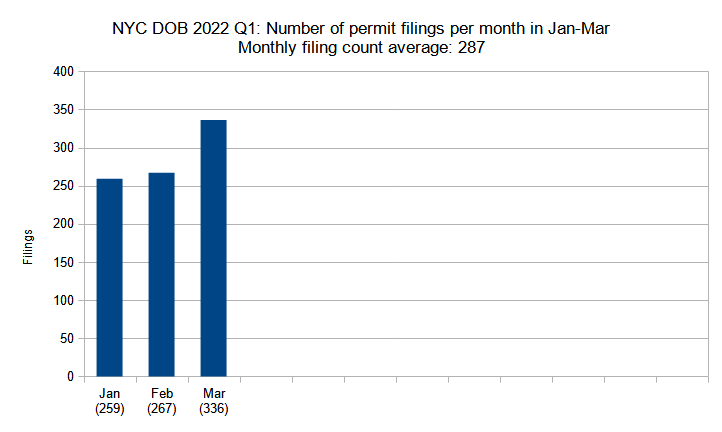
Number of new construction permits filed per month in New York City in Q1 (January through March) 2022. Data source: the Department of Buildings. Data aggregation and graphics credit: Vitali Ogorodnikov
A fine illustration of the enduring strength of New York City’s real estate market may be garnered by sorting permit filings by month. Over the first quarter of 2022, filing counts averaged at 287 per month. Not only does this figure nearly double last year’s average of 168 filings per month, but even the first quarter’s lowest monthly total (January, with 259 filings) significantly outpaces last year’s best-performing month (December, with 219 filings). In turn, the quarter’s best performing month, March with 336 filings, more than triples last year’s March total of 103 filings.
As seen in our last annual report, last year’s trendline showed a steady increase over the course of the year, with filing counts steadily increasing toward the year end. As the figures above show, the numbers for the first quarter of 2022 are a direct continuation of the linear monthly filing growth observed since last year.
341 Ninth Avenue. Photo by Michael Young
Number of permit filings by borough
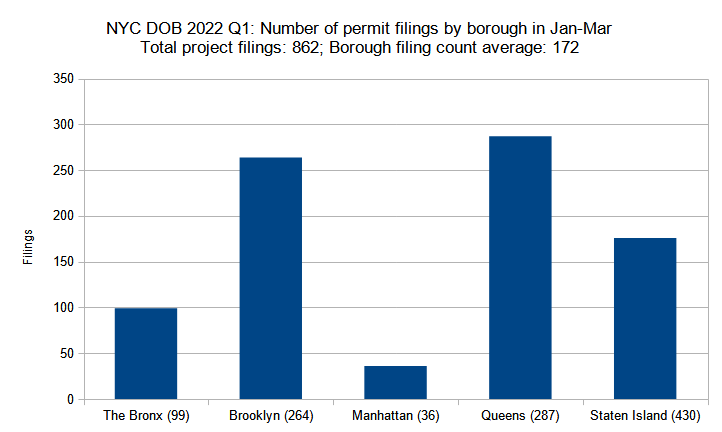
Number of new construction permits filed per borough in New York City in Q1 (January through March) 2022. Data source: the Department of Buildings. Data aggregation and graphics credit: Vitali Ogorodnikov
In a by-borough breakdown of permit filing counts, the picture for the first quarter of 2022 remains uncannily consistent with the results for 2021 and even to those of the prior year. Once again, Queens is in the lead, with a total of 287 permit filings, or one-third (33 percent) of the total, slightly down from last year’s 37-percent share yet still well above last year’s quarterly average of 186 permits for the World’s Borough.
As before, Brooklyn takes the second place, this time with 264 permits, nearly doubling last year’s quarterly average of 139 filings and claiming 31 percent of the city’s total, slightly up from last year’s 28-percent share.
Again, Staten Island takes the third place with 176 permits, which also nearly doubles last year’s average of 108 permits per quarter and accounts for one-fifth (20 percent) of the city’s total, just below last year’s share of 21 percent.
The Bronx is still in the fourth place, with a total of 99 filings, which account for 11 percent of the city’s total, slightly above last year’s ten percent. But despite its seemingly low intra-borough filing count, The Bronx’s Q1 2022 count more than doubles last year’s quarterly average of 49 filings.
In step with prior trends, Manhattan trails the pack with 36 filings in the first quarter of 2022, though the figure still accounts for an impressive half-again increase from last year’s quarterly average of 23 filings. This time around, the borough’s total permits account for just four percent of the city’s total, matching last year’s share.
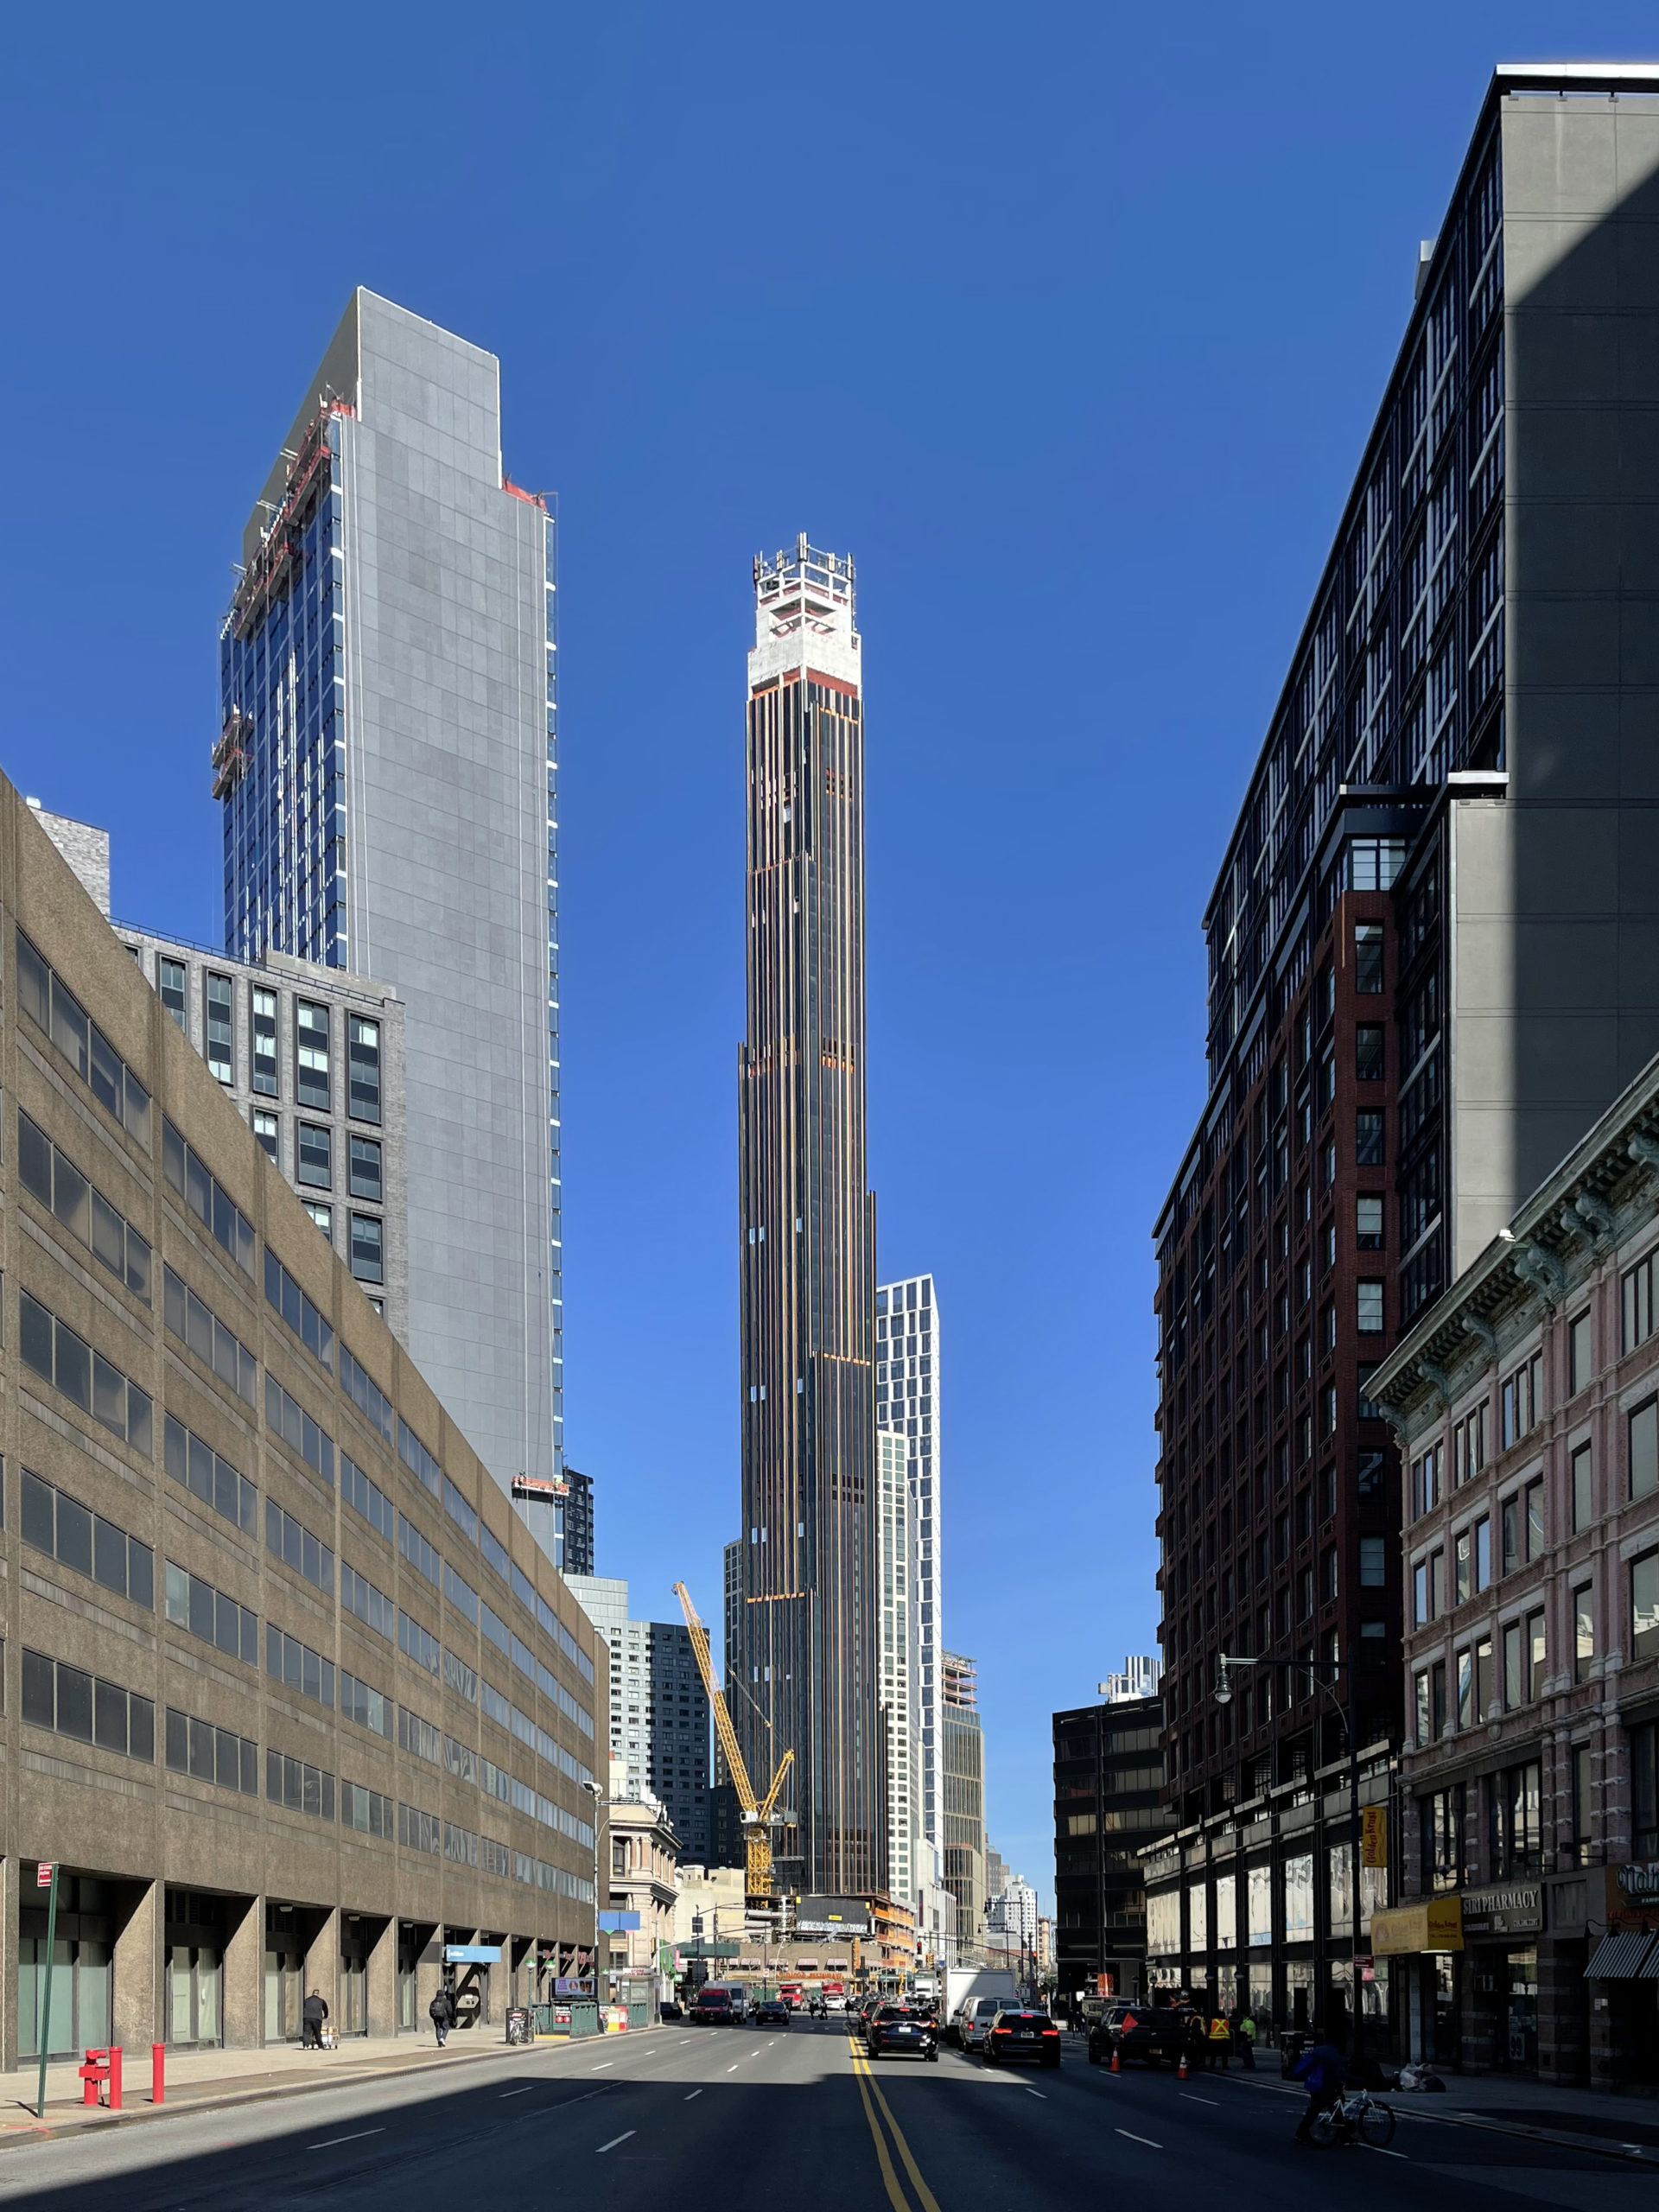
The Brooklyn Tower. Photo by Michael Young
Residential and hotel unit filings per borough
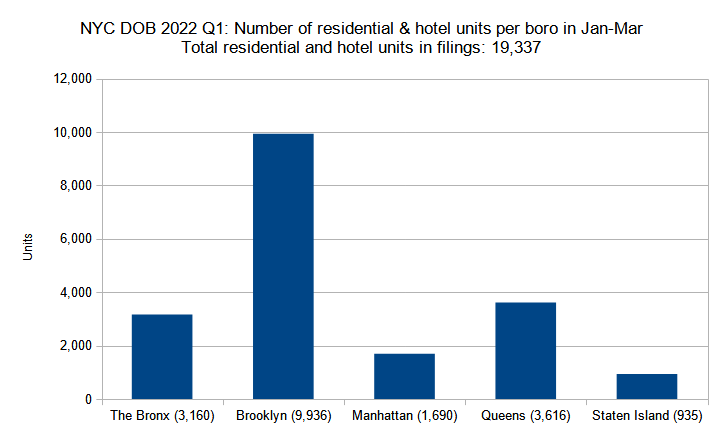
Number of residential and hotel units in new construction permits filed per borough in New York City in Q1 (January through March) 2022. Data source: the Department of Buildings. Data aggregation and graphics credit: Vitali Ogorodnikov
Since last year, the data from the Department of Buildings aggregates both residential and hotel units as a single data entity, which complicates data analysis for those that wish to see the numbers separated by either category (though we can still make some general inferences such as expectations of Manhattan having a greater share of hotel rooms among the total and Staten Island having far fewer lodging filings).
In either case, here is where the data deviation from last year starts to become quite noticeable. Similar to last year, Brooklyn leads the pack in terms of unit count with 9,936 units, even further increasing its dominance as it now accounts to 51 percent of the total, up from last year’s 37 percent. The overall unit count for Q1 is even more impressive, as it accounts for more than half of the borough total of 16,515 units for the entirety of last year.
By contrast, Manhattan’s unit count has dropped from last year’s quarterly average of 2,876 units down to 1,690 units in the first quarter of 2022. In turn, the borough’s share of the city’s total unit filings has slipped from 26 percent last year down to nine percent in Q1.
In the past quarter, Queens has tallied 3,626 unit filings, significantly up from last year’s quarterly average of 2,358. The Bronx registered 3,160 unit filings, a dramatic increase from last year’s average of 1,680 unit filings per quarter. The biggest positive surprise, however, comes from Staten Island, where the Q1 2022 total of 935 unit filings actually beats the 850 units that were filed over the course of the entire last year combined.
The XI. Photo by Michael Young
Permits by unit count per filing
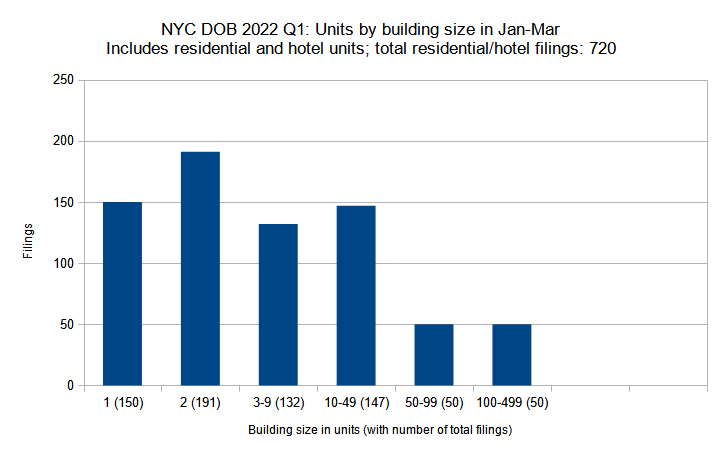
New residential and hotel construction permits filed in New York City in Q1 (January through March) 2022 grouped by unit count per filling. Data source: the Department of Buildings. Data aggregation and graphics credit: Vitali Ogorodnikov
The above chart shows new residential and hotel construction permits filed in New York City in Q1 (January through March) 2022 grouped by unit count per filling. As the numbers show, the first quarter has not registered any permit filings with 500 or more units, though a total of nine permits for such buildings were filed last year. In the rest of the categories, however, the numbers for the first quarter of 2022 are rather impressive.
The first quarter of 2022 tallied a total of 50 buildings that hold anywhere between 100 and 499 units, more than doubling last year’s quarterly average of 24 filings. This quarter, such buildings account for a total of 11,075 units.
The number of new filings for buildings with 50 to 99 units also sits at 50, eclipsing the entire total for last year, which registered at 49. The quarter’s total unit count in this category is 3,614.
Similarly, the count of Q1 2022 filings for buildings holding ten to 49 units sits at 147, more than doubling last year’s quarterly average of 62. The total number of units in this category sits at 3,392.
A similar trend is observed with the near-doubling of Q1’s count of buildings with three to nine units to 132, compared to last year’s quarterly average of 70. The total unit count in this group in Q1 2022 is 724.
Once again, the number of two-unit building filings nearly doubled in Q1 2022 as compared to the average quarter last year, rising from an average of 113 per quarter last year to a total of 191 in Q1. The category accounts for a total of 382 units.
Finally, in Q1 2022, the single-unit category tallied a total of 150 entries, nearly 50 percent more than last year’s quarterly average of 105.

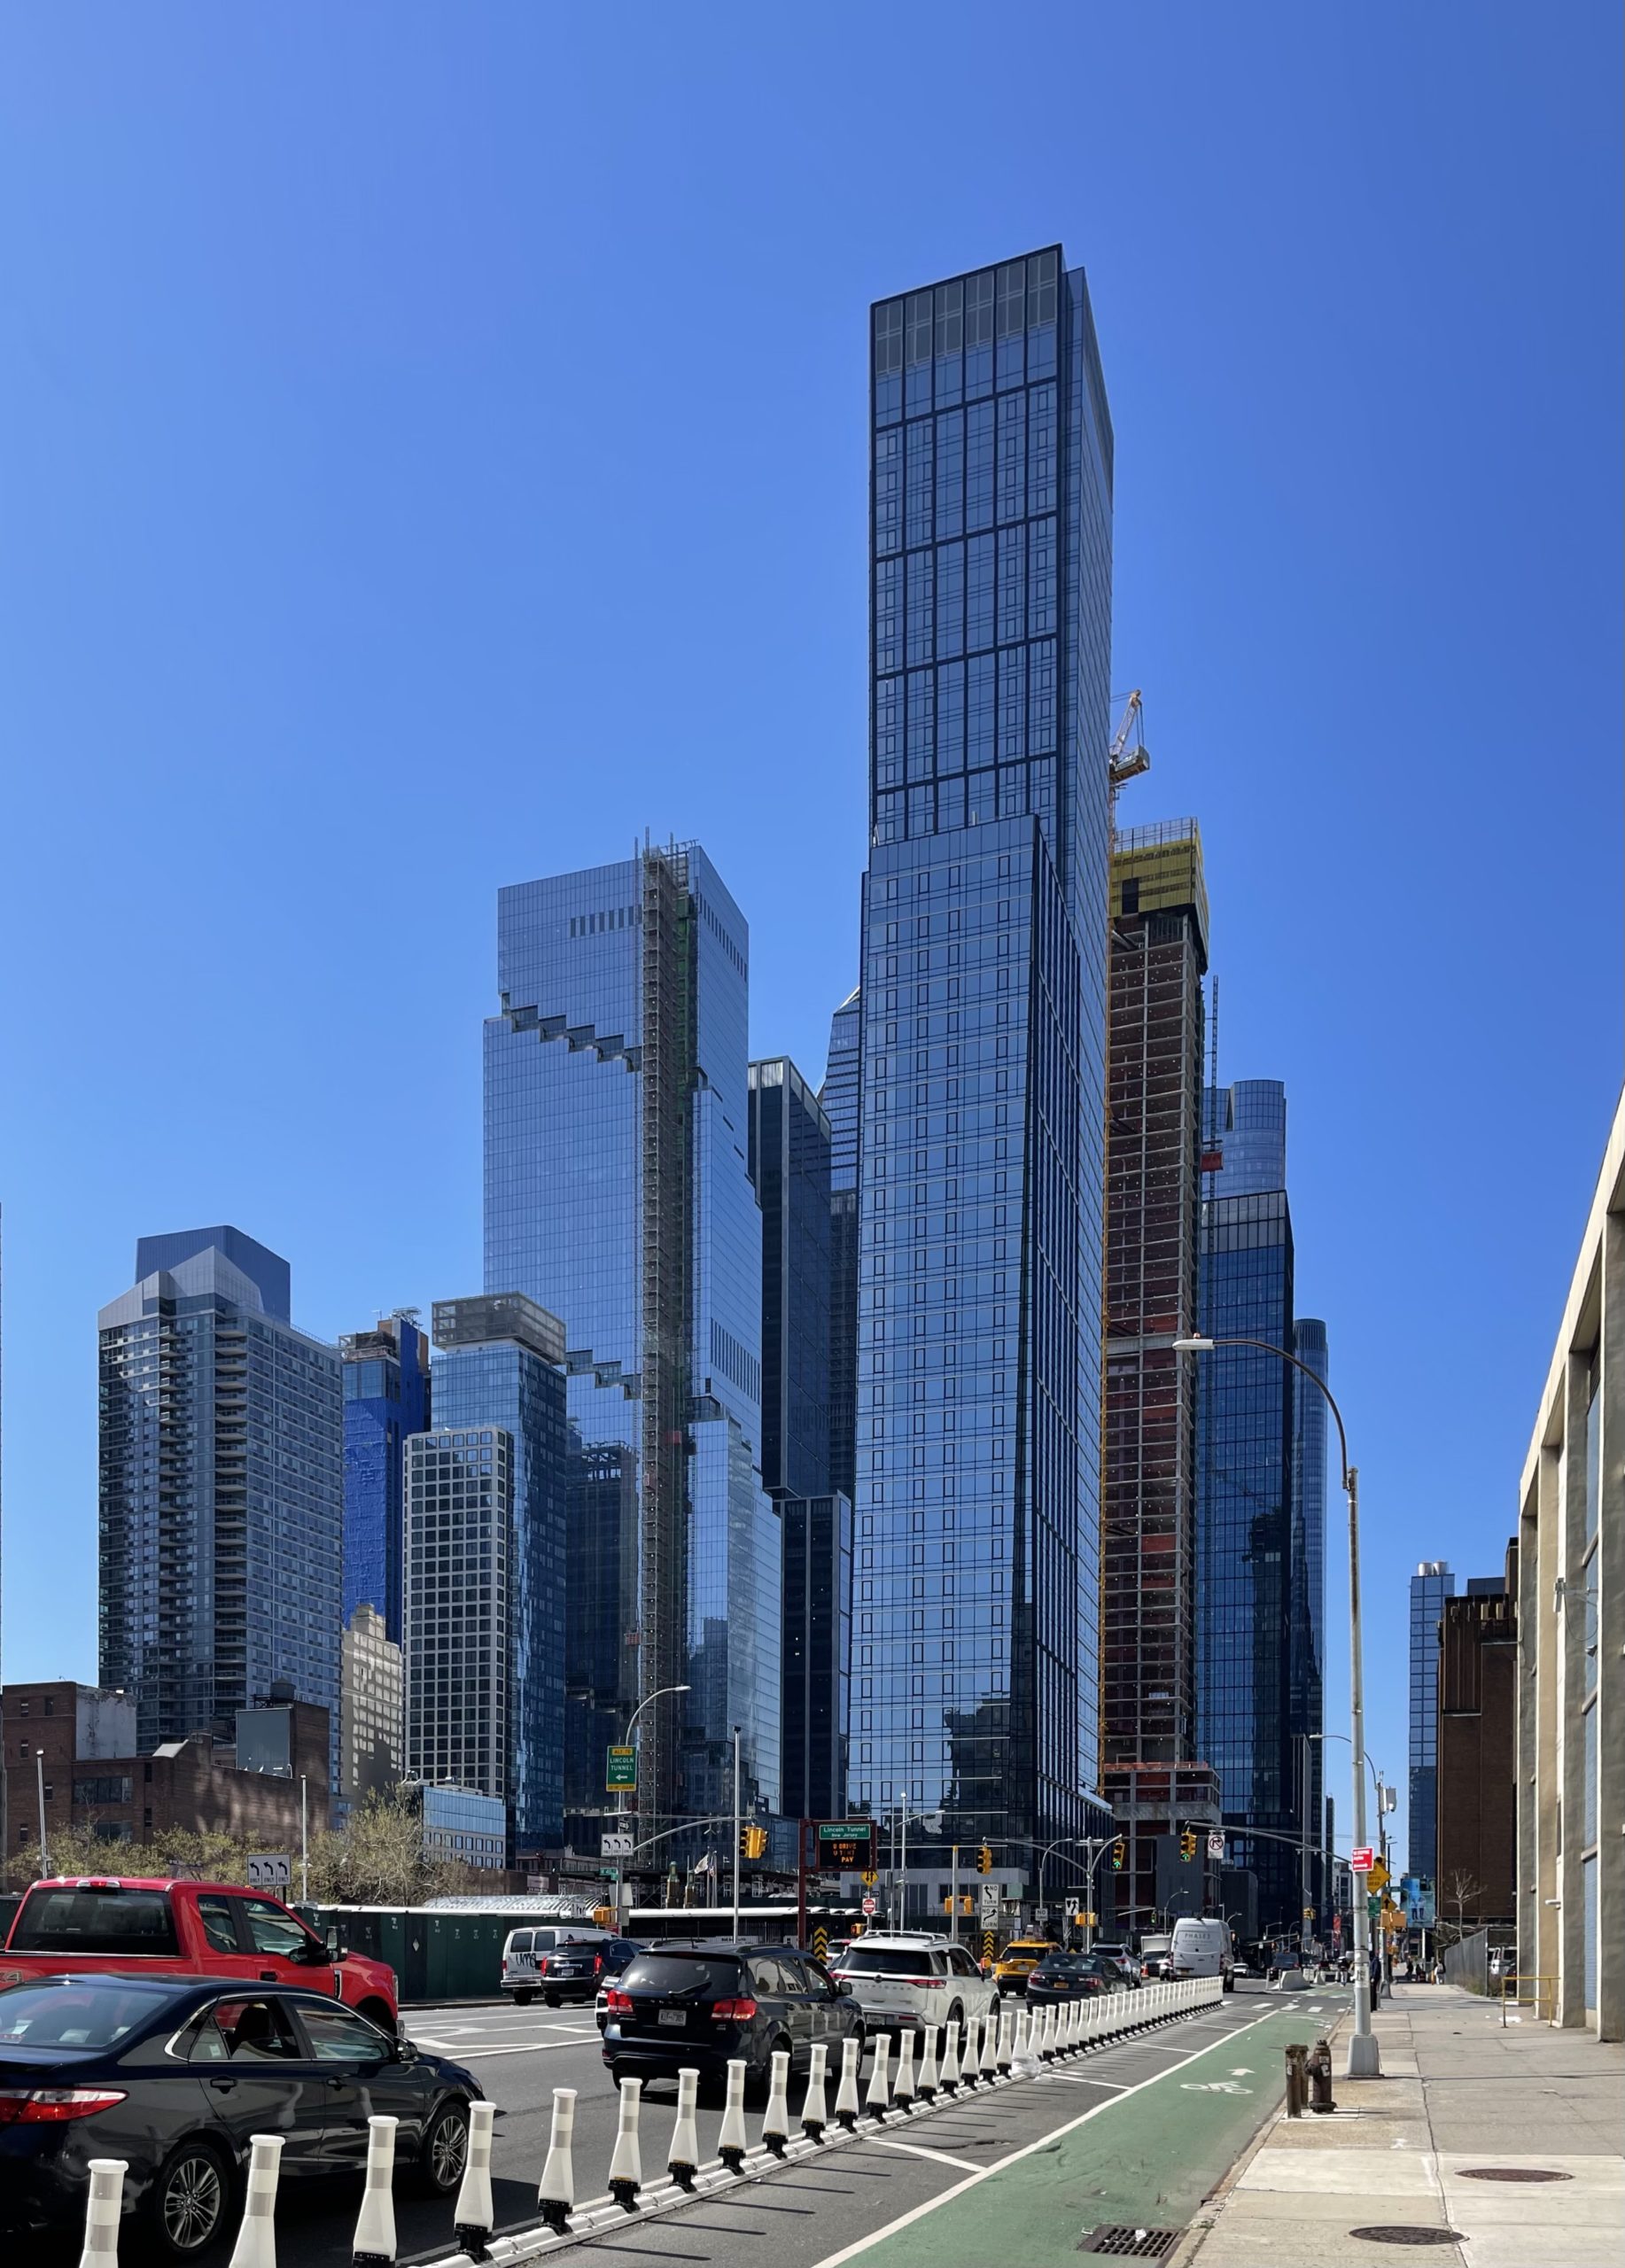
241 West 28th Street. Photo by Michael Young
Permit filings by floor count groups
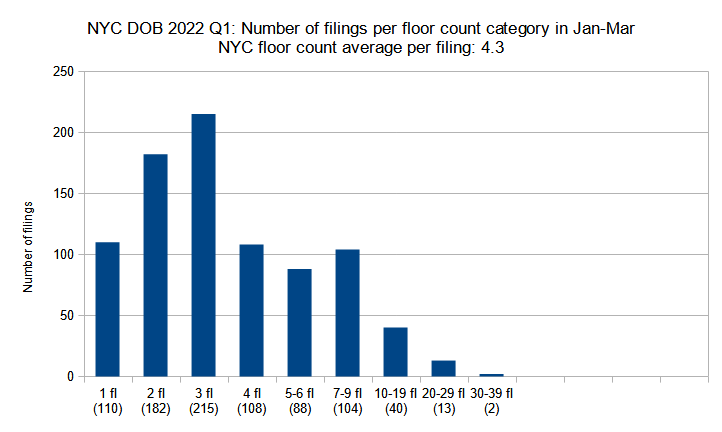
New construction permits filed in New York City in Q1 (January through March) 2022 grouped by floor count. Data source: the Department of Buildings. Data aggregation and graphics credit: Vitali Ogorodnikov
While permit filings for the first quarter of 2022 significantly surpass last year’s averages in many categories, sheer skyline height is not one of them. The first quarter of 2022 has failed to register any building filings with 40 or more stories, as compared to last year’s average of four per quarter within the category. Two buildings are planned to rise between 30 and 39 stories, matching last year’s average for the category.
However, the numbers improve in the lower categories. Q1 has tallied a total of 13 buildings in the 20-29-story range, more than doubling last year’s quarterly average of six, similar to the near-doubling of the 10-19-story filings to 40, up from last year’s quarterly average of 19.
Buildings in the lower height categories, which we classify as mid- and low-rise, also generally showed similarly impressive improvements in the total tally.
555 West 38th Street. Photo by Michael Young
Average number of floors per filing
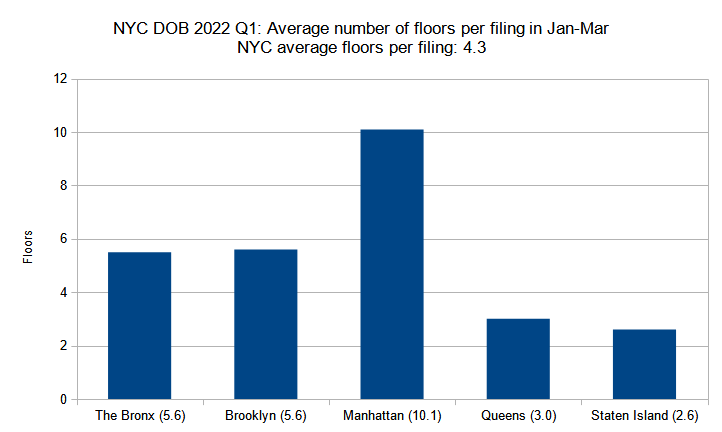
Average number of floors per new construction permit per borough filed in New York City in Q1 (January through March) 2022. Data source: the Department of Buildings. Data aggregation and graphics credit: Vitali Ogorodnikov
In terms of overall numbers, the average floor count per filing throughout the city has dipped ever so slightly in the first quarter of 2022 from the 2021 quarterly average, slipping from 4.4 to 4.3 floors. Also, as discussed in the analysis above, the number of filings for the taller categories of skyscrapers has decreased in the first quarter of 2022 when compared to last year. This may partially explain why the average floor count per filing in Manhattan, the borough with the tallest buildings in the city, has plummeted from last year’s quarterly average of 15.1 down to 10.1 in the first quarter of 2022.
By contrast, the rest of the boroughs have shown slight increases, with Brooklyn’s floor counts per filing rising from last year’s quarterly average of 5.3 to 5.6 in Q1 2022, The Bronx rising from 5.2 to 5.6, and Staten Island coming in a relatively impressive increase from 2.3 to 2.6. The tally for Queens remains steady at three.
1 Bell Slip in Greenpoint, Brooklyn via NYC Housing Connect
Total floor area filed by borough
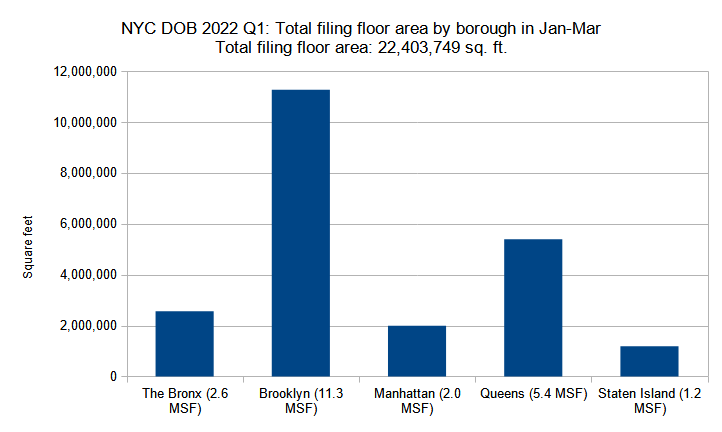
Combined floor area of new construction permits filed per borough in New York City in Q1 (January through March) 2022. Data source: the Department of Buildings. Data aggregation and graphics credit: Vitali Ogorodnikov
In the first quarter of 2022, the total floor area filed for in Brooklyn, which registers at 11,270,172 square feet, roughly equals the total area of the filings for the rest of the boroughs combined. Queens takes nearly half of the remainder with 5,396,268 square feet. The Bronx, Manhattan, and Staten Island trail the pack with totals of 2,563,362 square feet, 1,991,362 square feet, and 1,182,586 square feet, respectively.
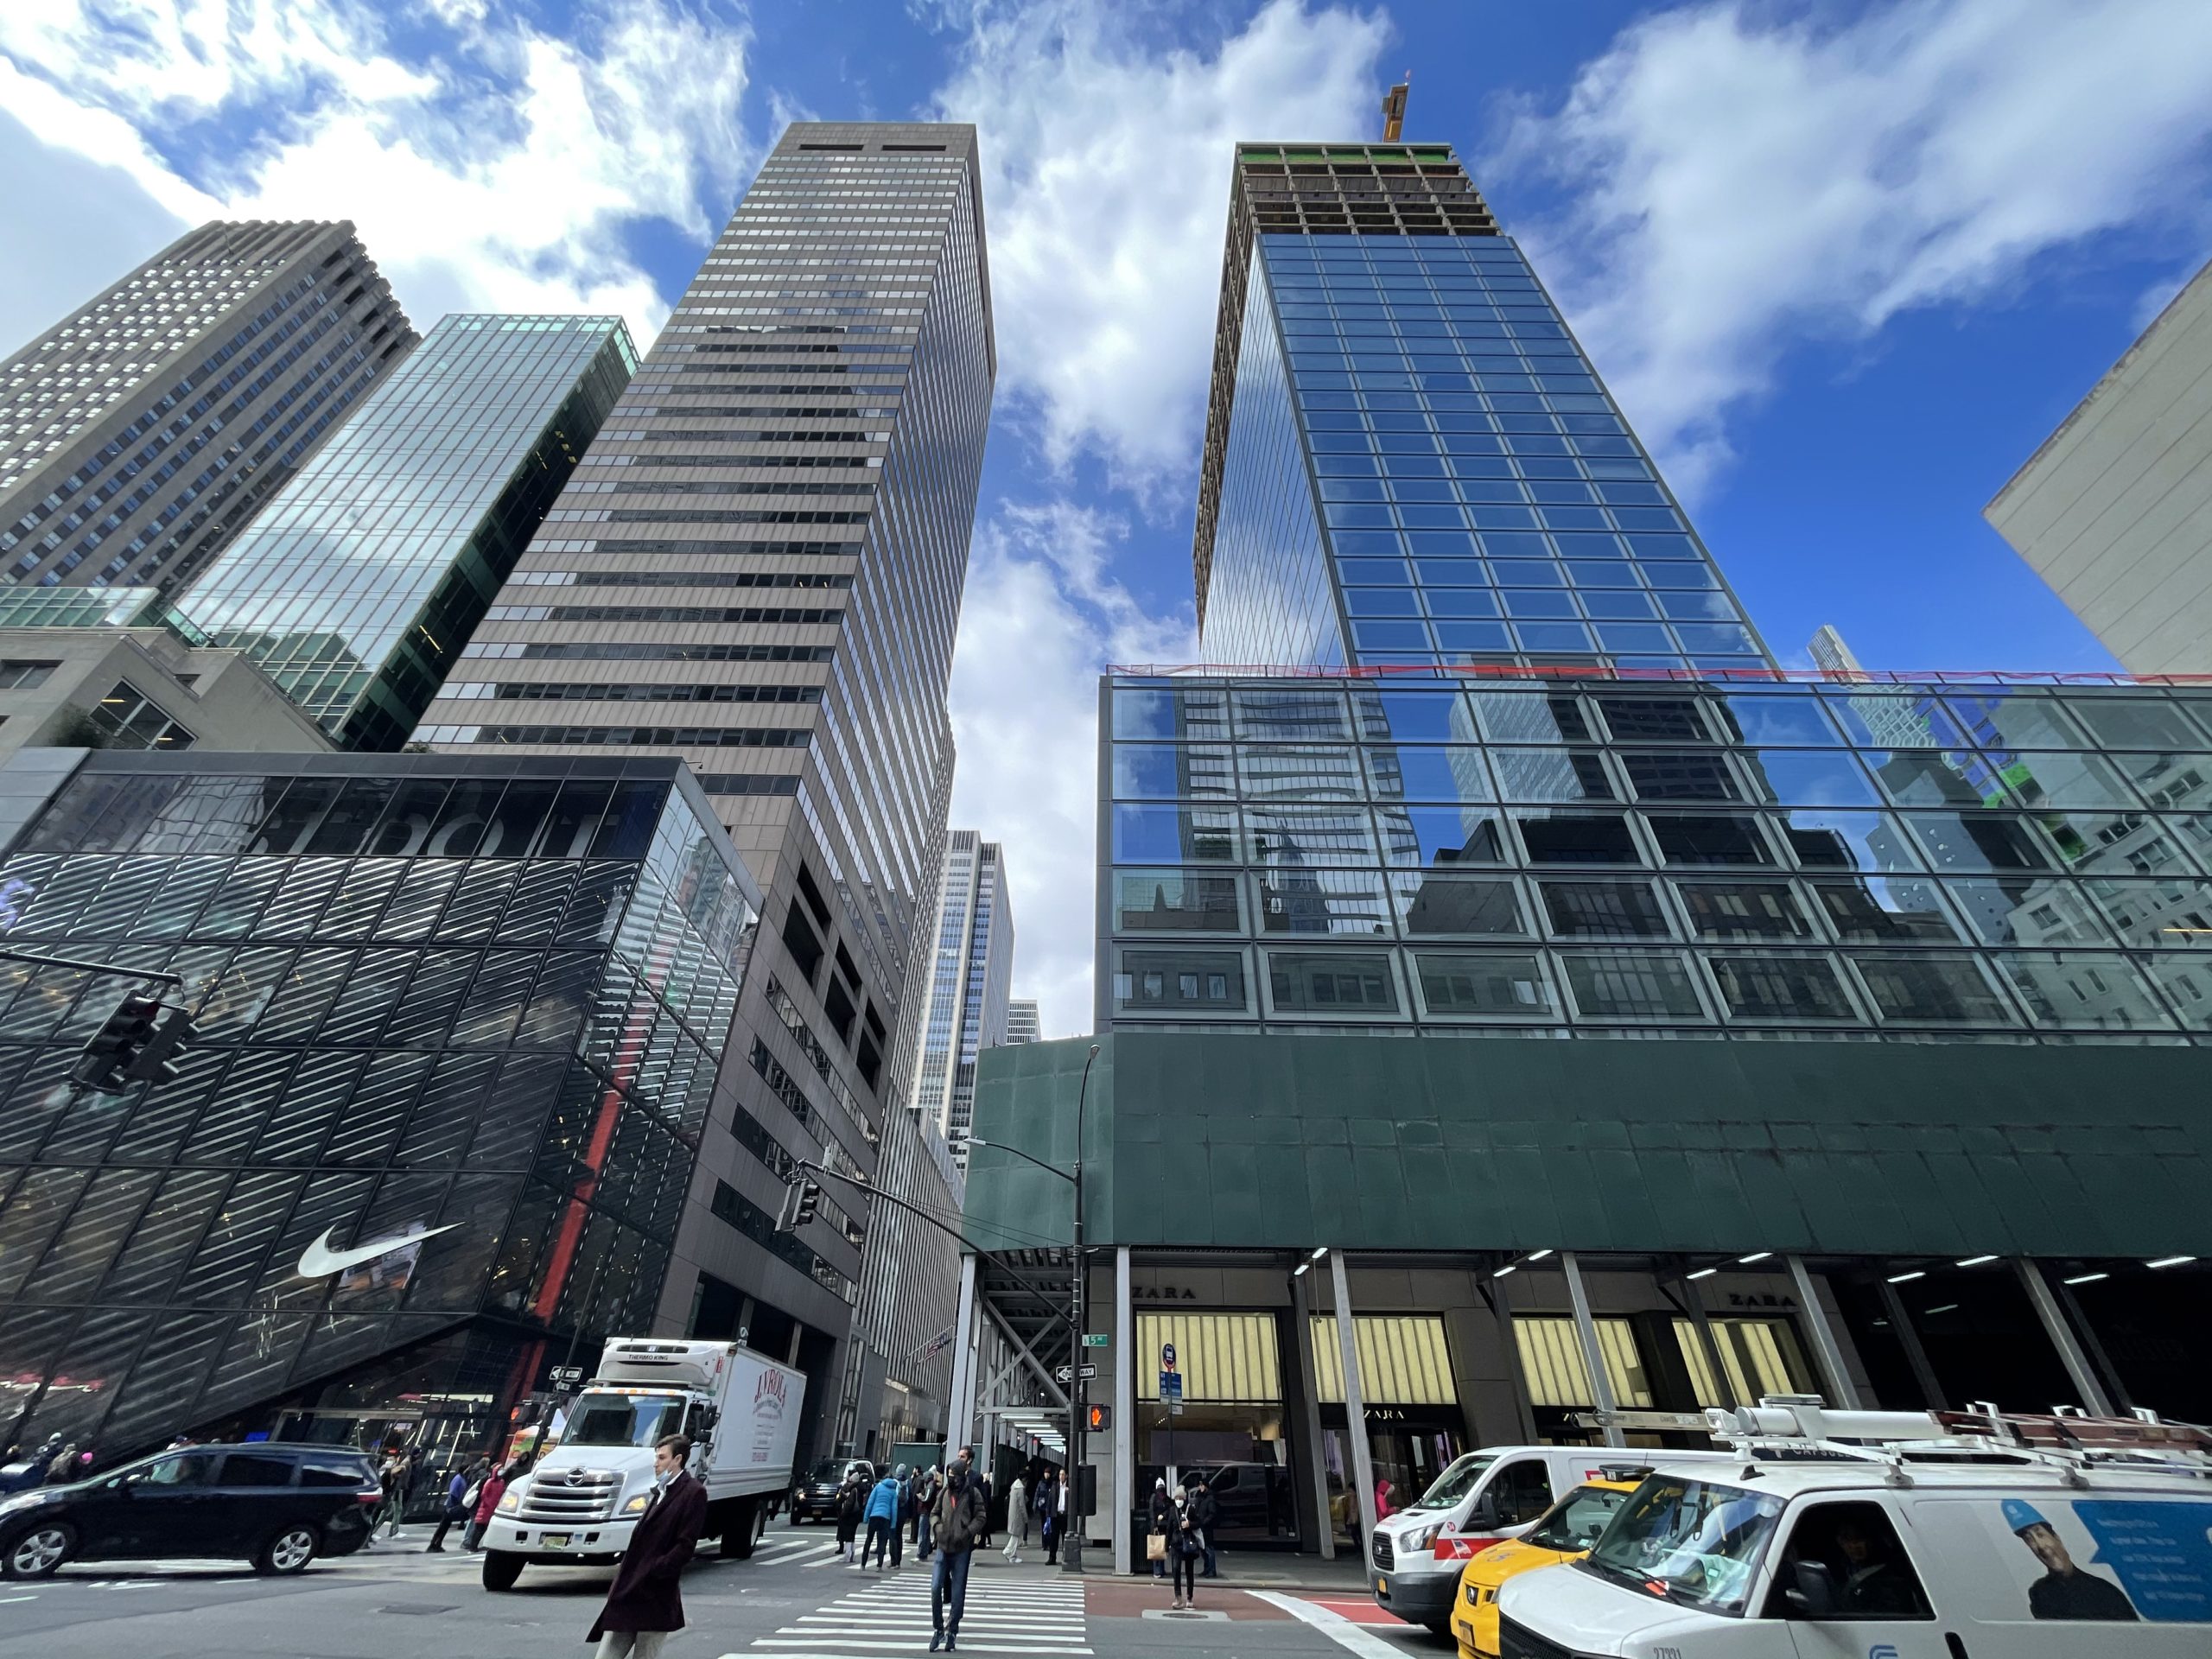
660 Fifth Avenue. Photo by Michael Young
Average floor area per permit filing by borough
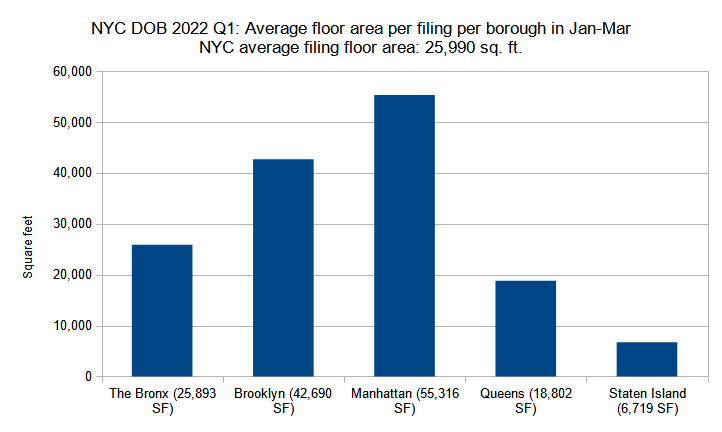
Average floor area per new construction permit per borough filed in New York City in Q1 (January through March) 2022. Data source: the Department of Buildings. Data aggregation and graphics credit: Vitali Ogorodnikov
While Manhattan may have fewer total permit filings than the rest of the boroughs for the first quarter of 2022, and its average floor area has dropped by more than half compared to last year’s average of around 128,176 square feet, it still registers the largest average filing size in Q1 of this year at 55,316 square feet per average filing.
The Bronx registers at a relatively close second place with an average of 42,690 square feet per filing in Q1 2022, a slight increase from last year’s average of 37,311 square feet. Brooklyn comes at a distant third place with an average of 25,893 square feet per filing, well below last year’s 36,883 square feet, and closer to the borough’s average from 2020.
Queens rose slightly from last year’s average of 15,681 square feet up to 18,802 square feet in Q1 2022. Staten Island saw the city’s largest relative boost, rising from last year’s average of 4,628 square feet to 6,719 square feet in the first quarter of 2022.
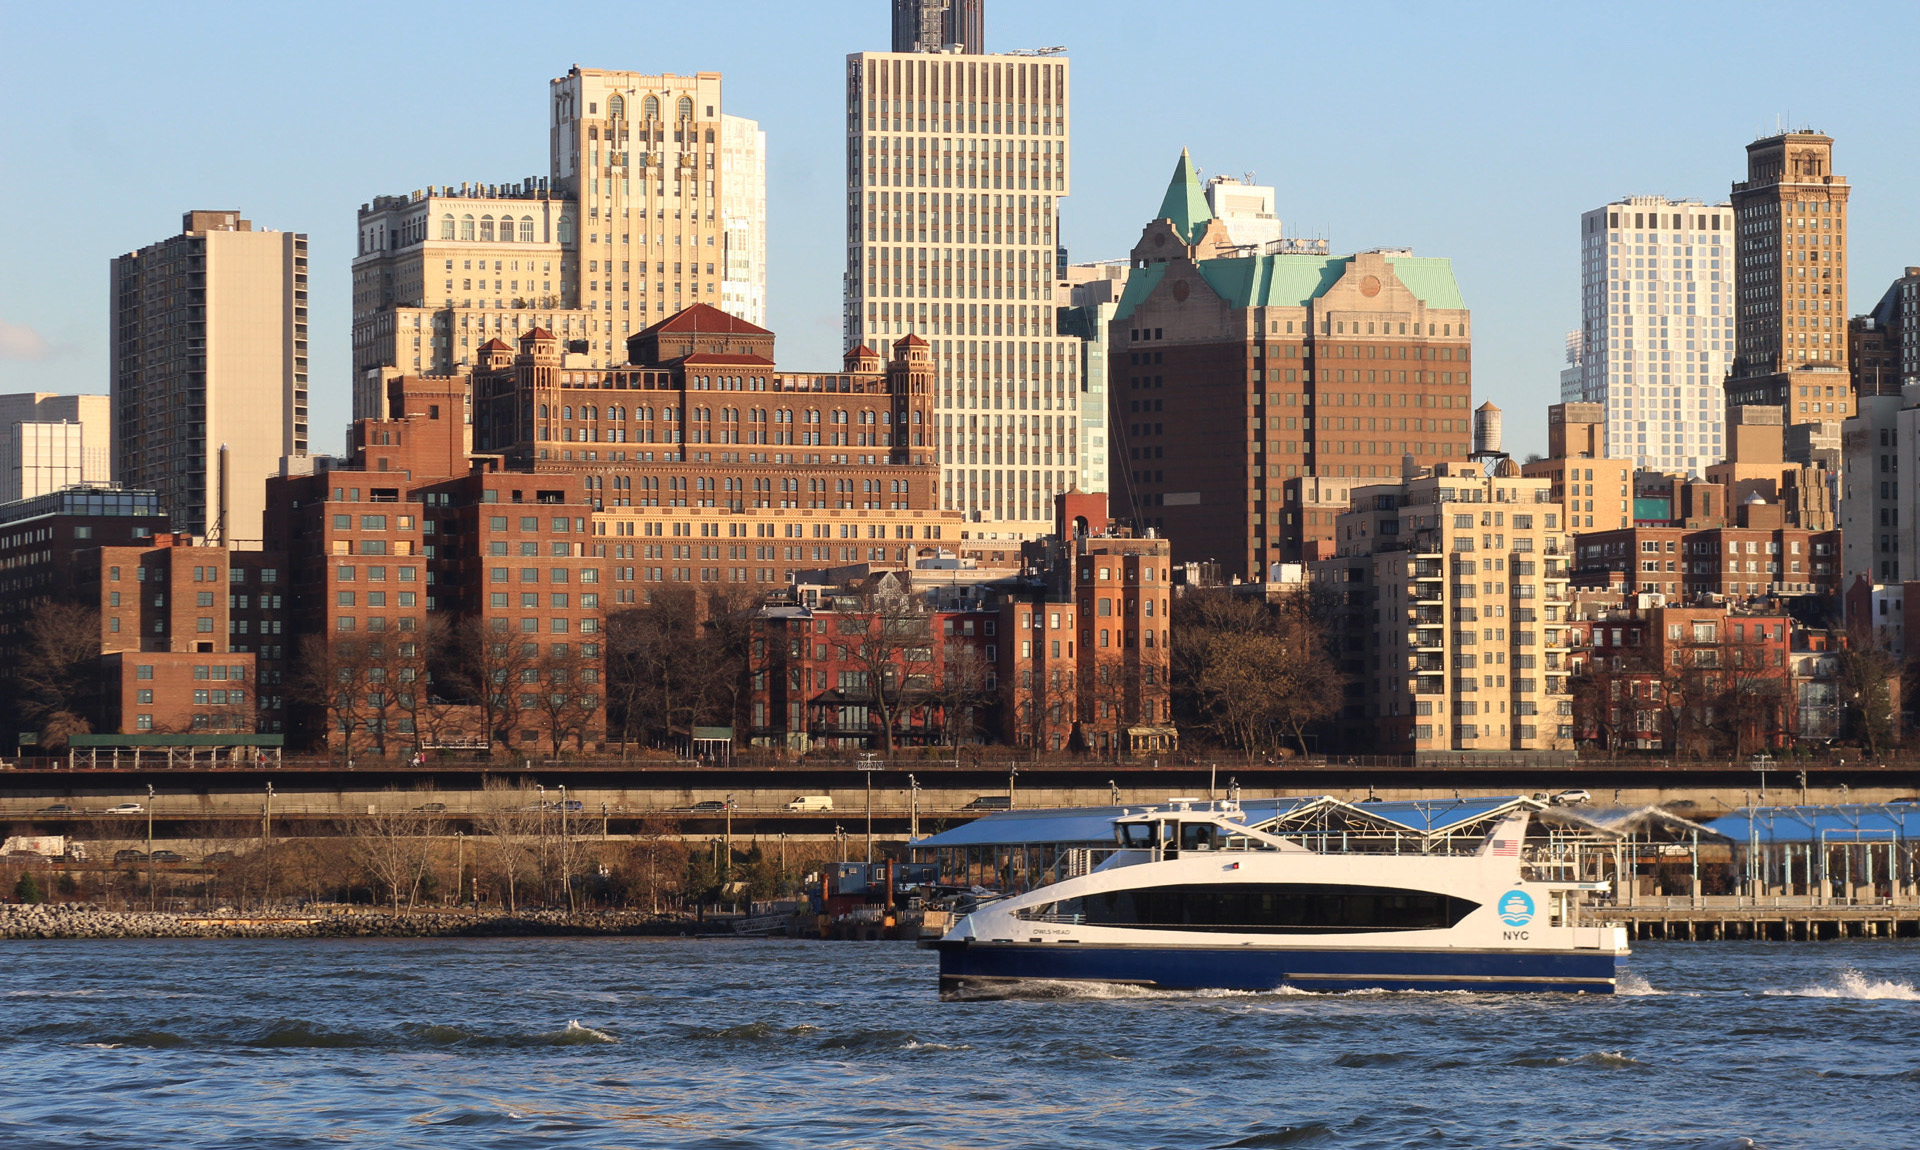
One Clinton. Photo by Michael Young
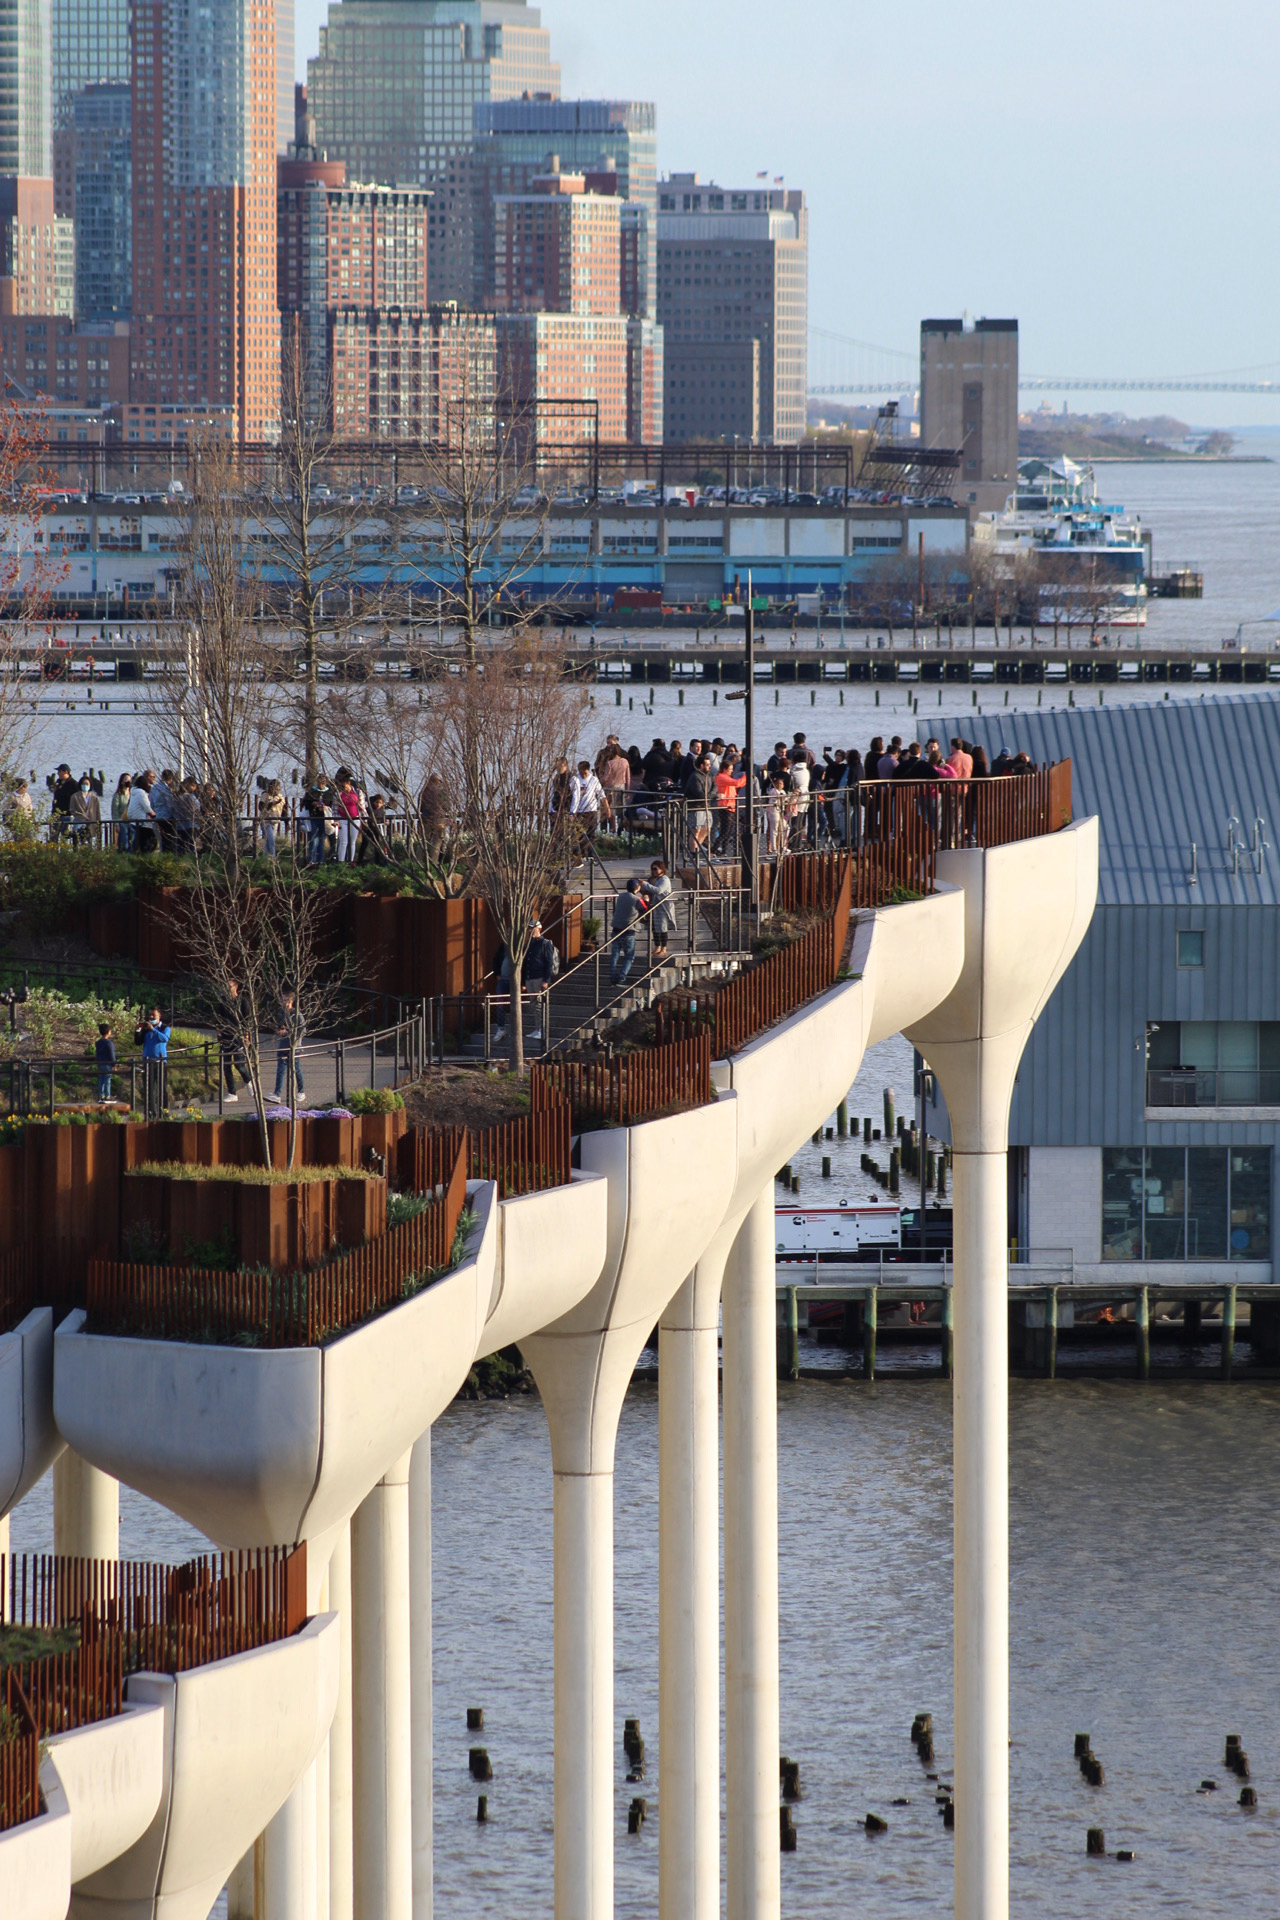
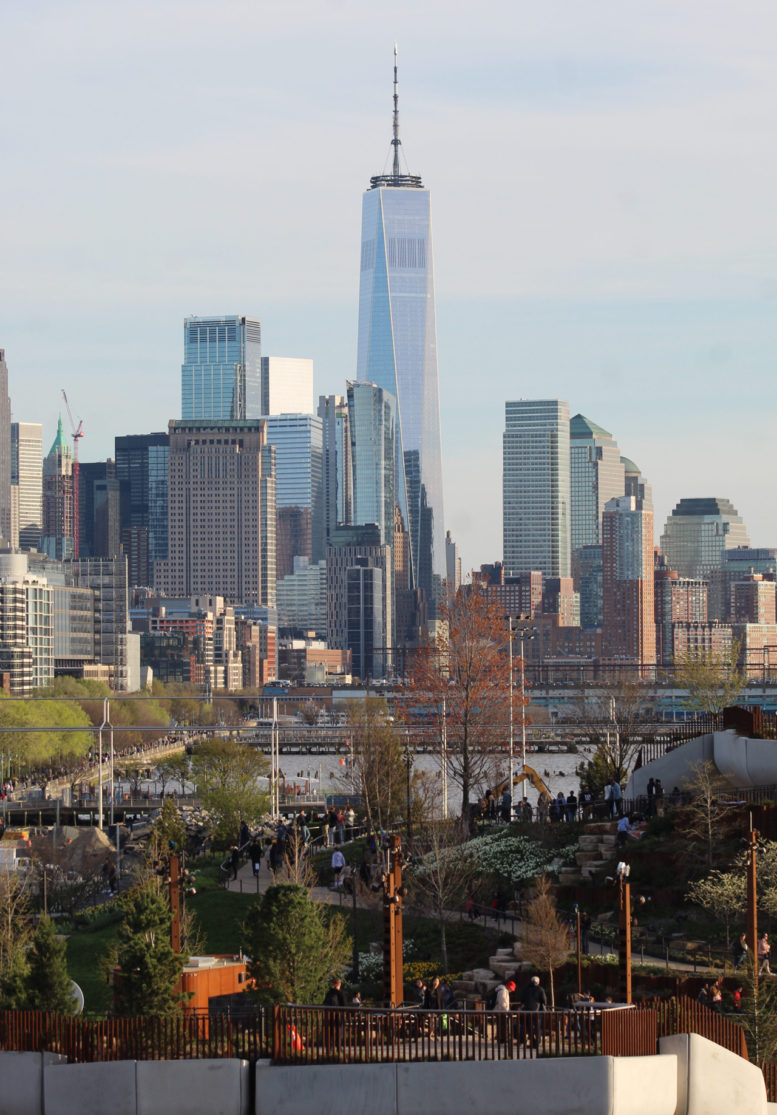
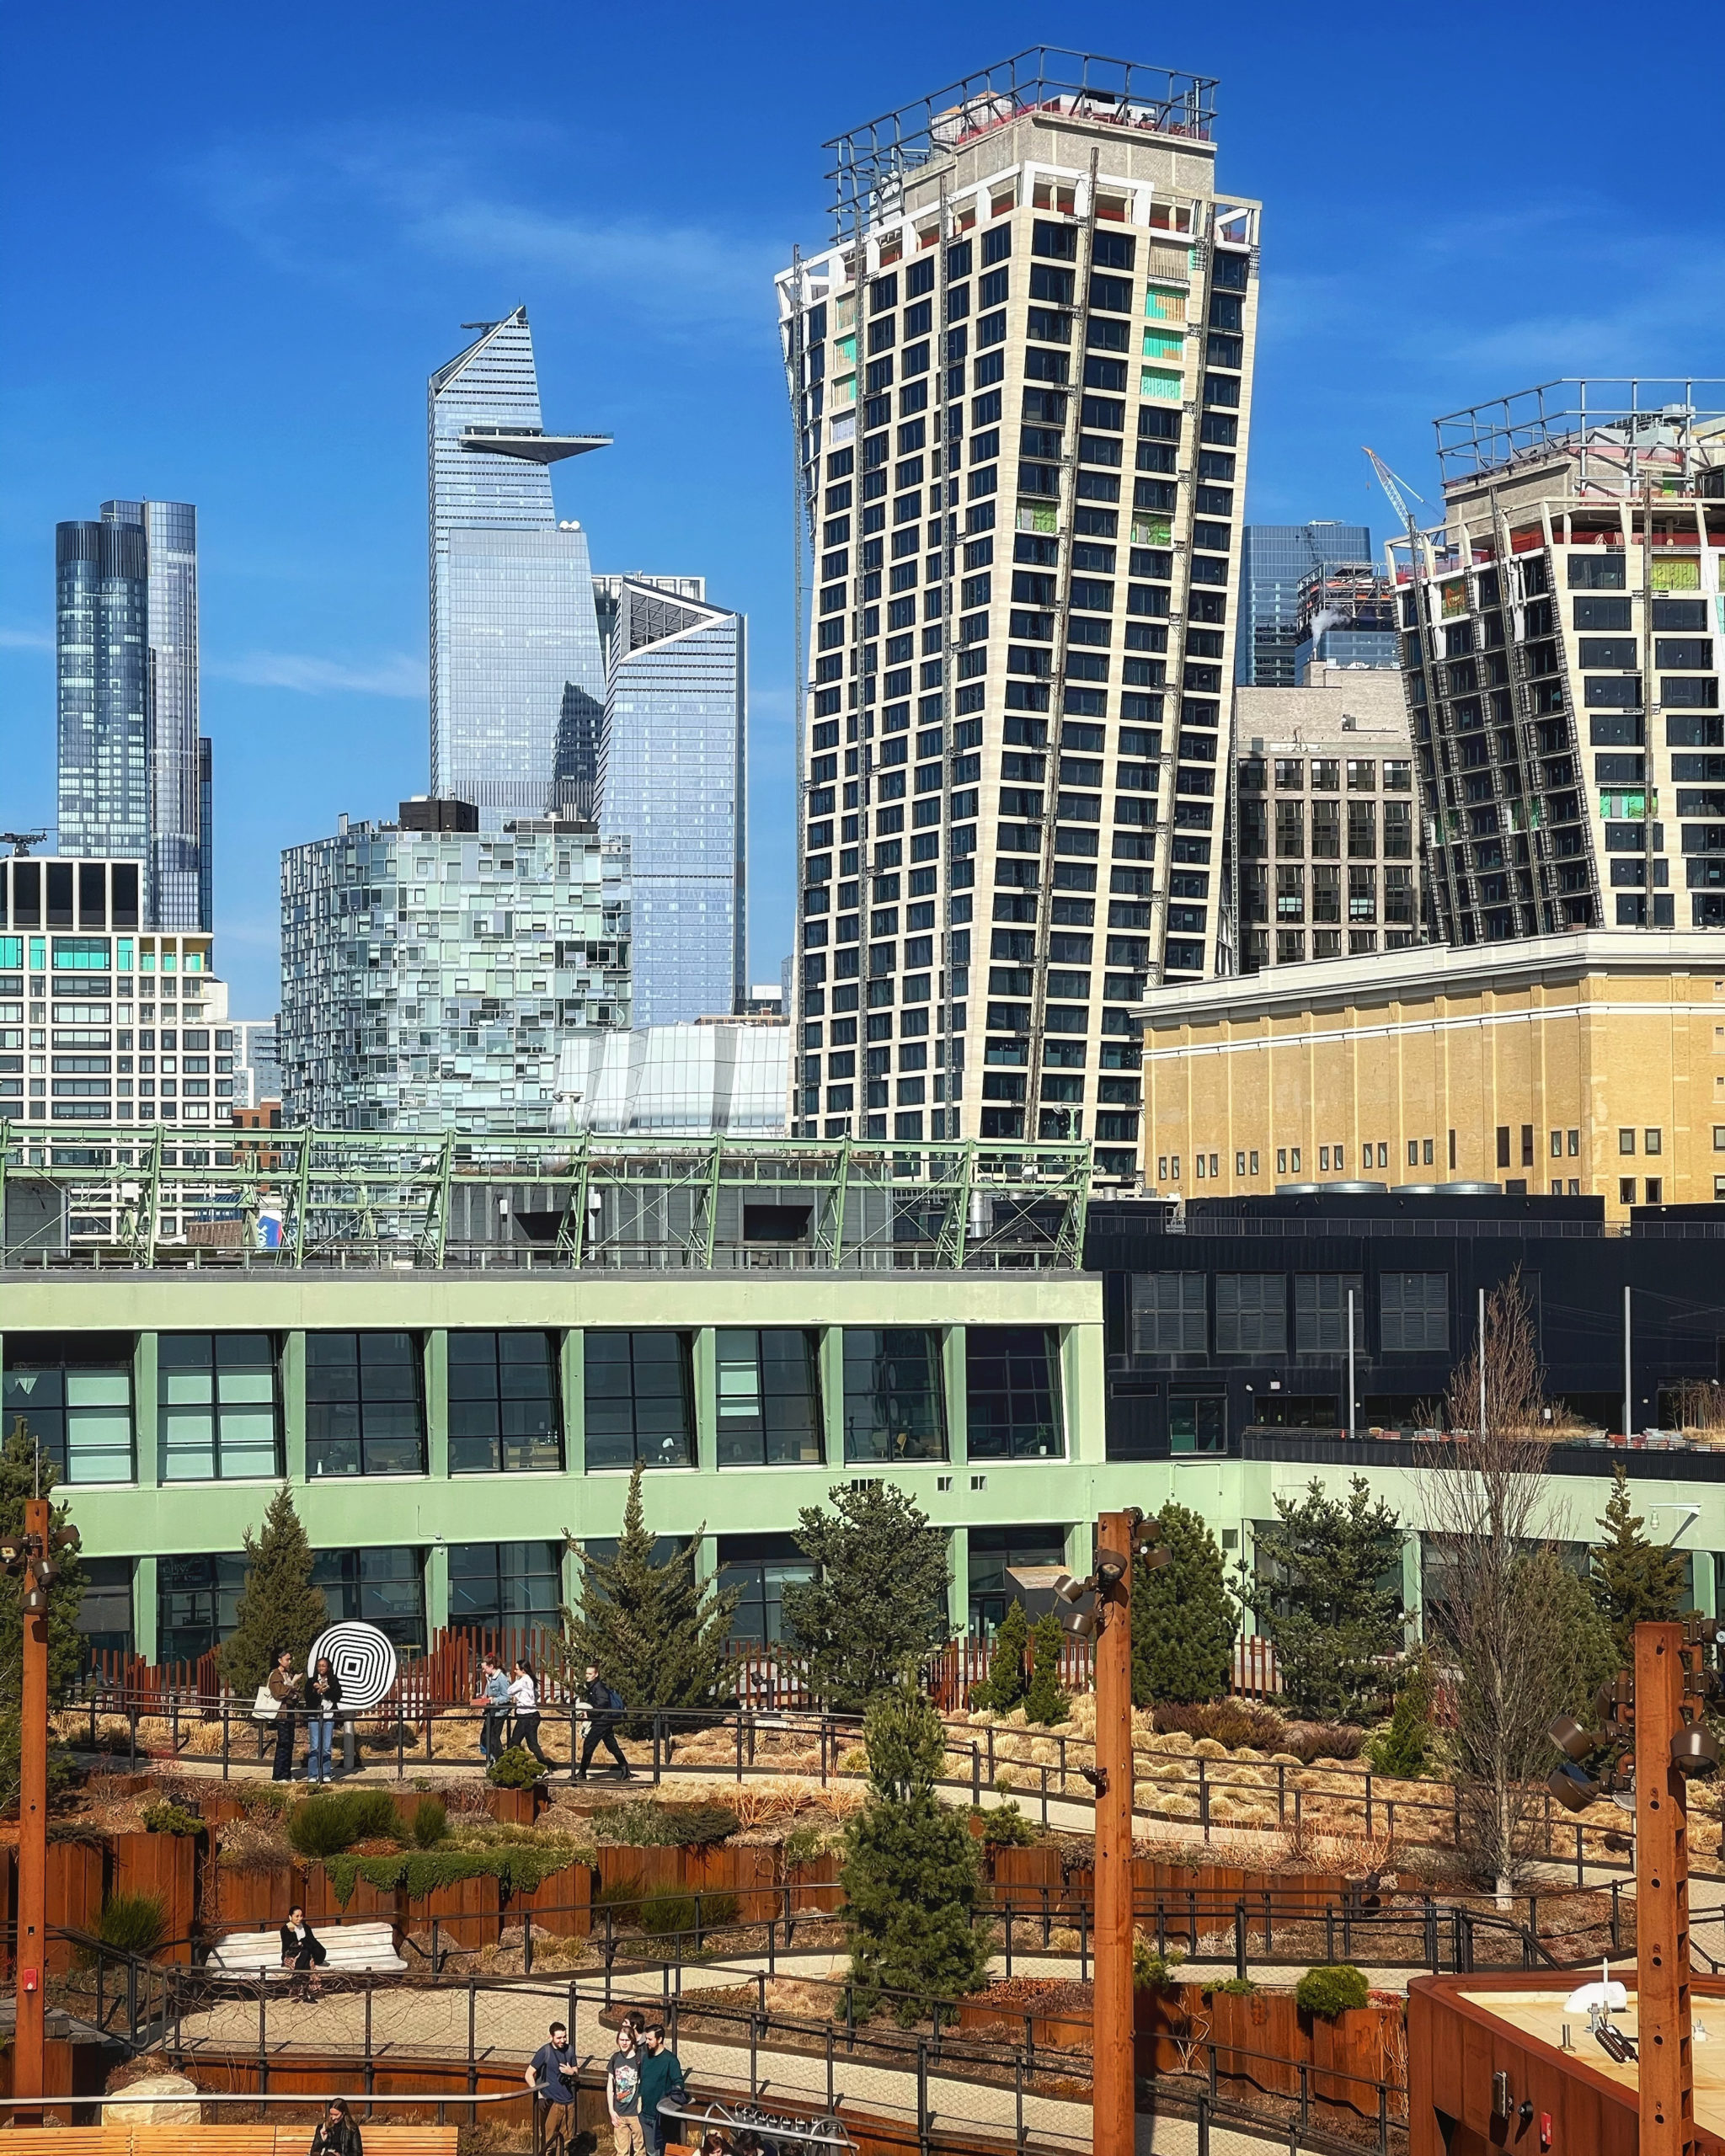
Pier 57. Photo by Michael Young

Pier 57. Photo by Michael Young
In our previous reports, through tough times and improving fortunes alike, YIMBY had remained steadfast in our confidence in the continuing strength of New York City’s construction and real estate markets. The dramatic increases in permit filings in virtually every category in the first quarter of this year continue to validate our previous predictions. As such, given the city’s persistently urgent need for housing, preeminent status as a global business leader, and a resurging tourism industry, we continue to maintain a bright outlook into the future of the city’s development industry and the upward motion of both construction statistics and the skyline itself.

Journal Squared. Photo by Michael Young
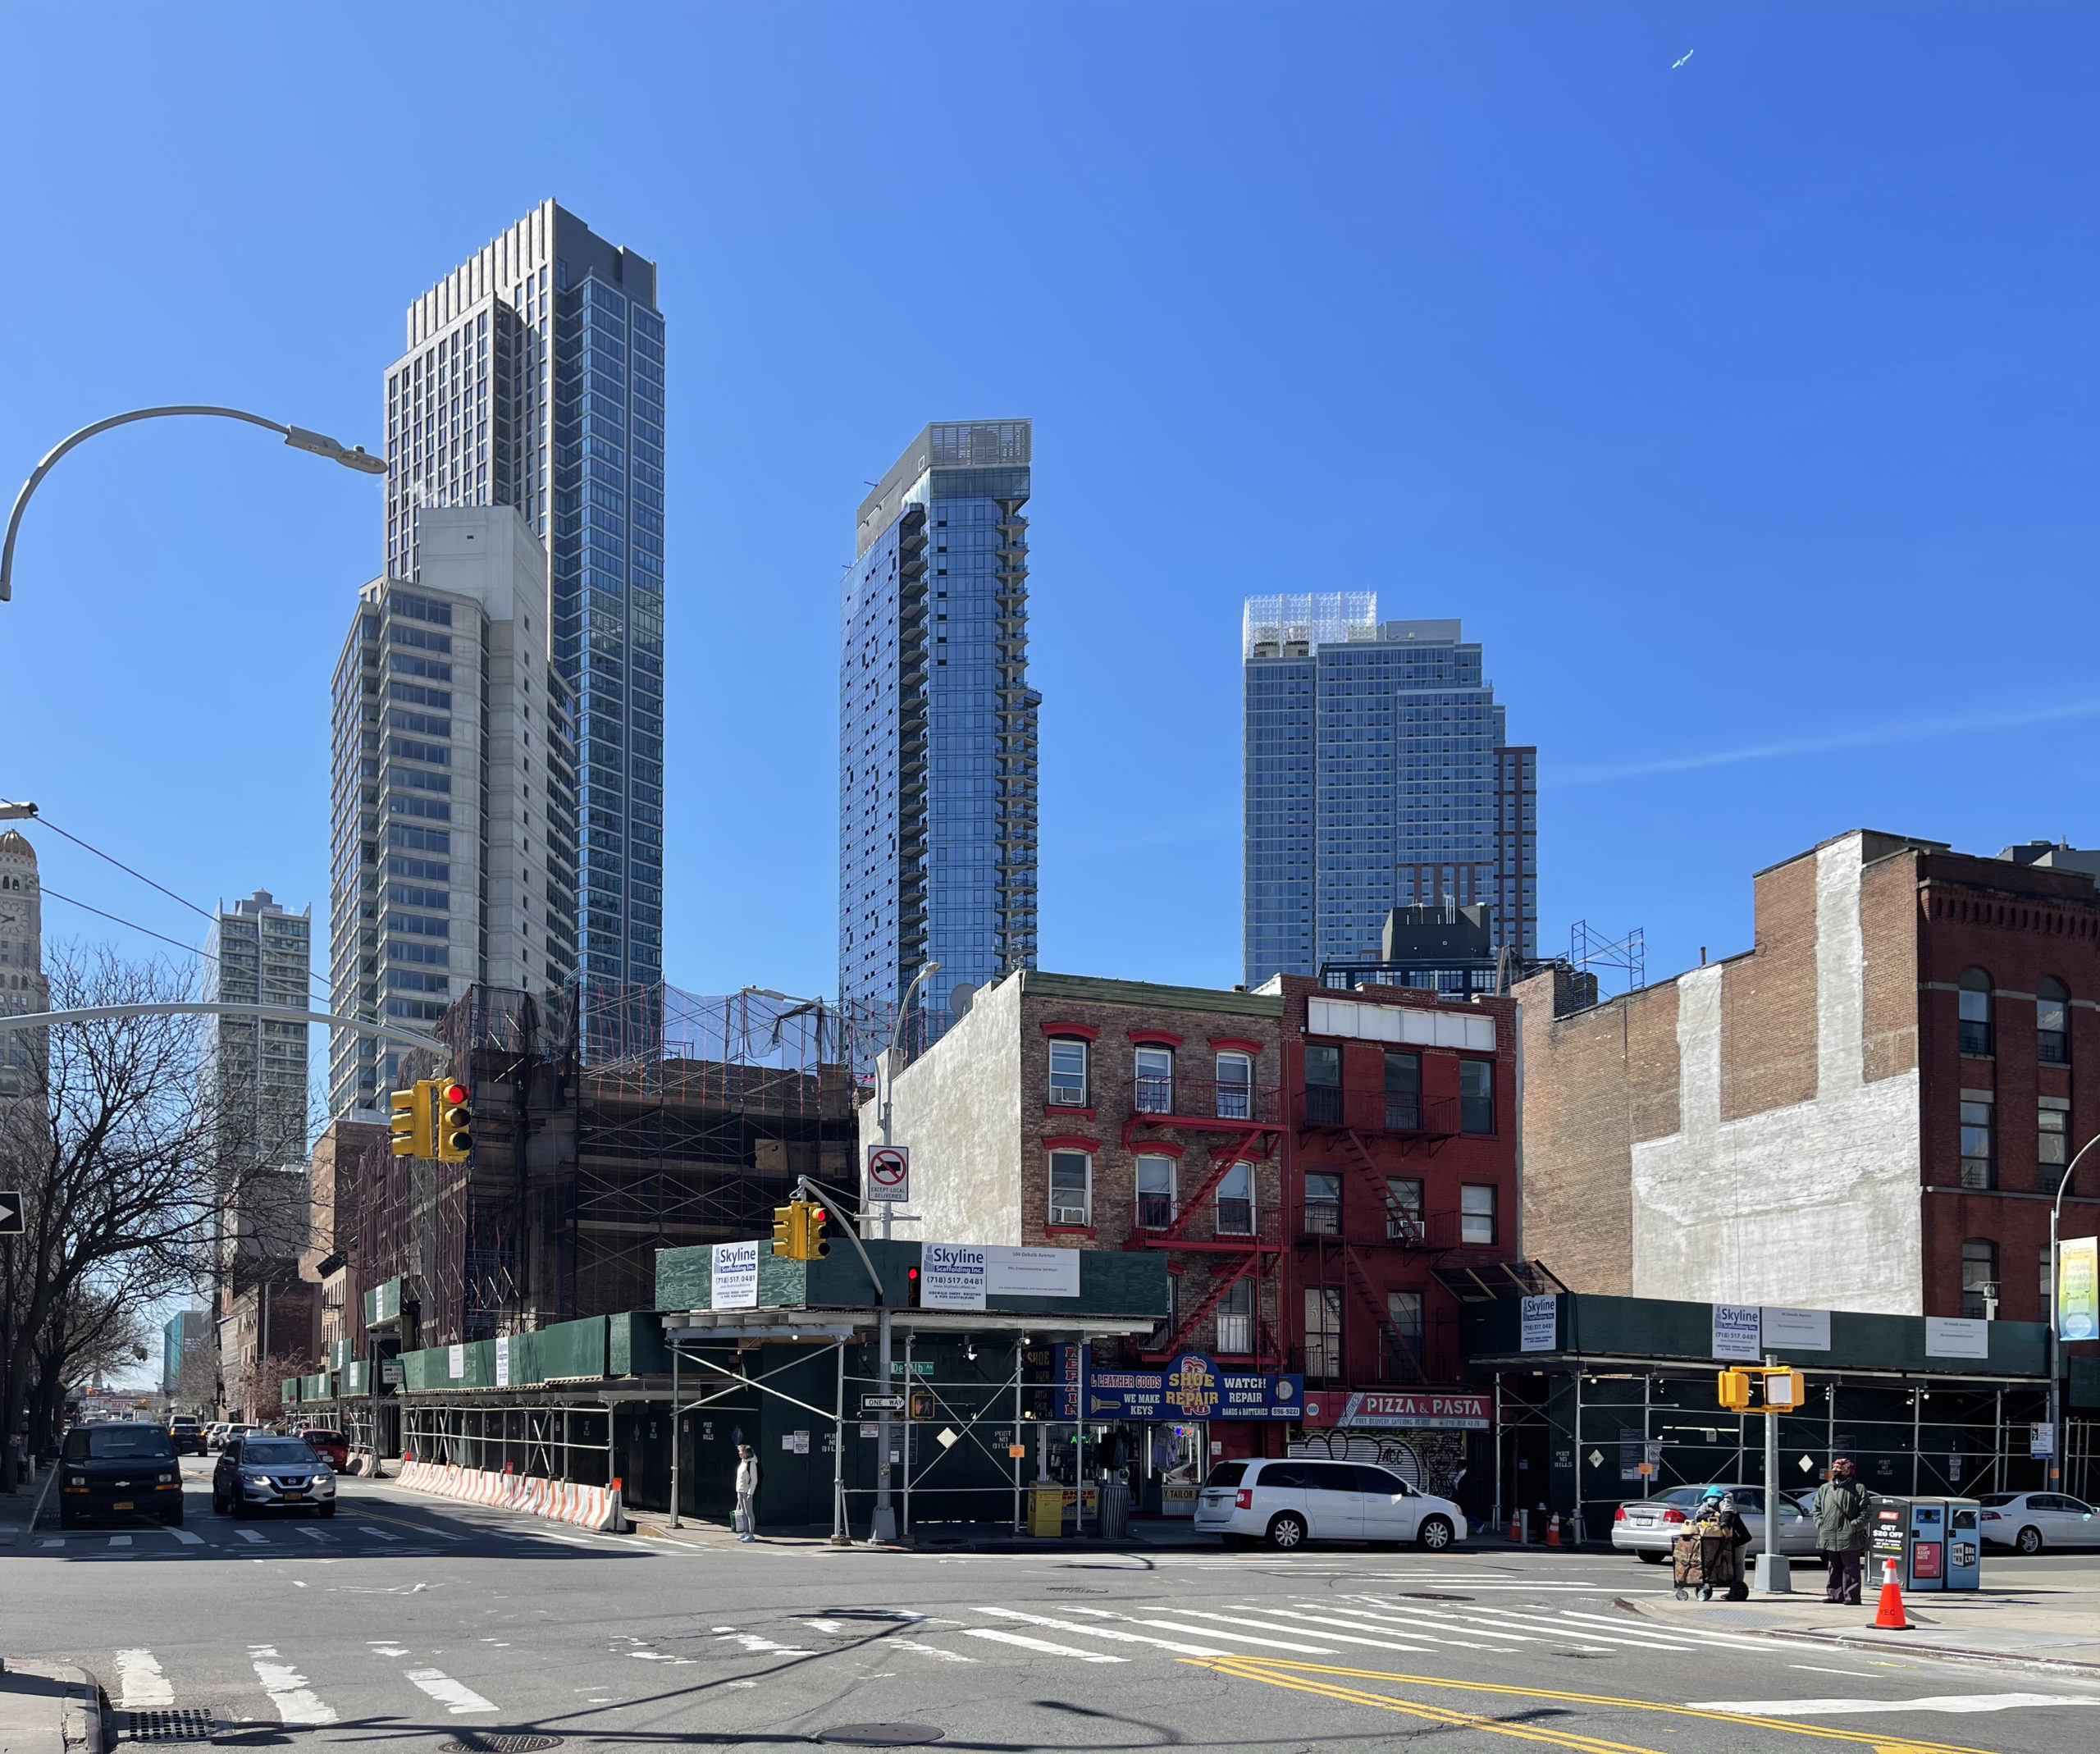
98 DeKalb Avenue. Photo by Michael Young
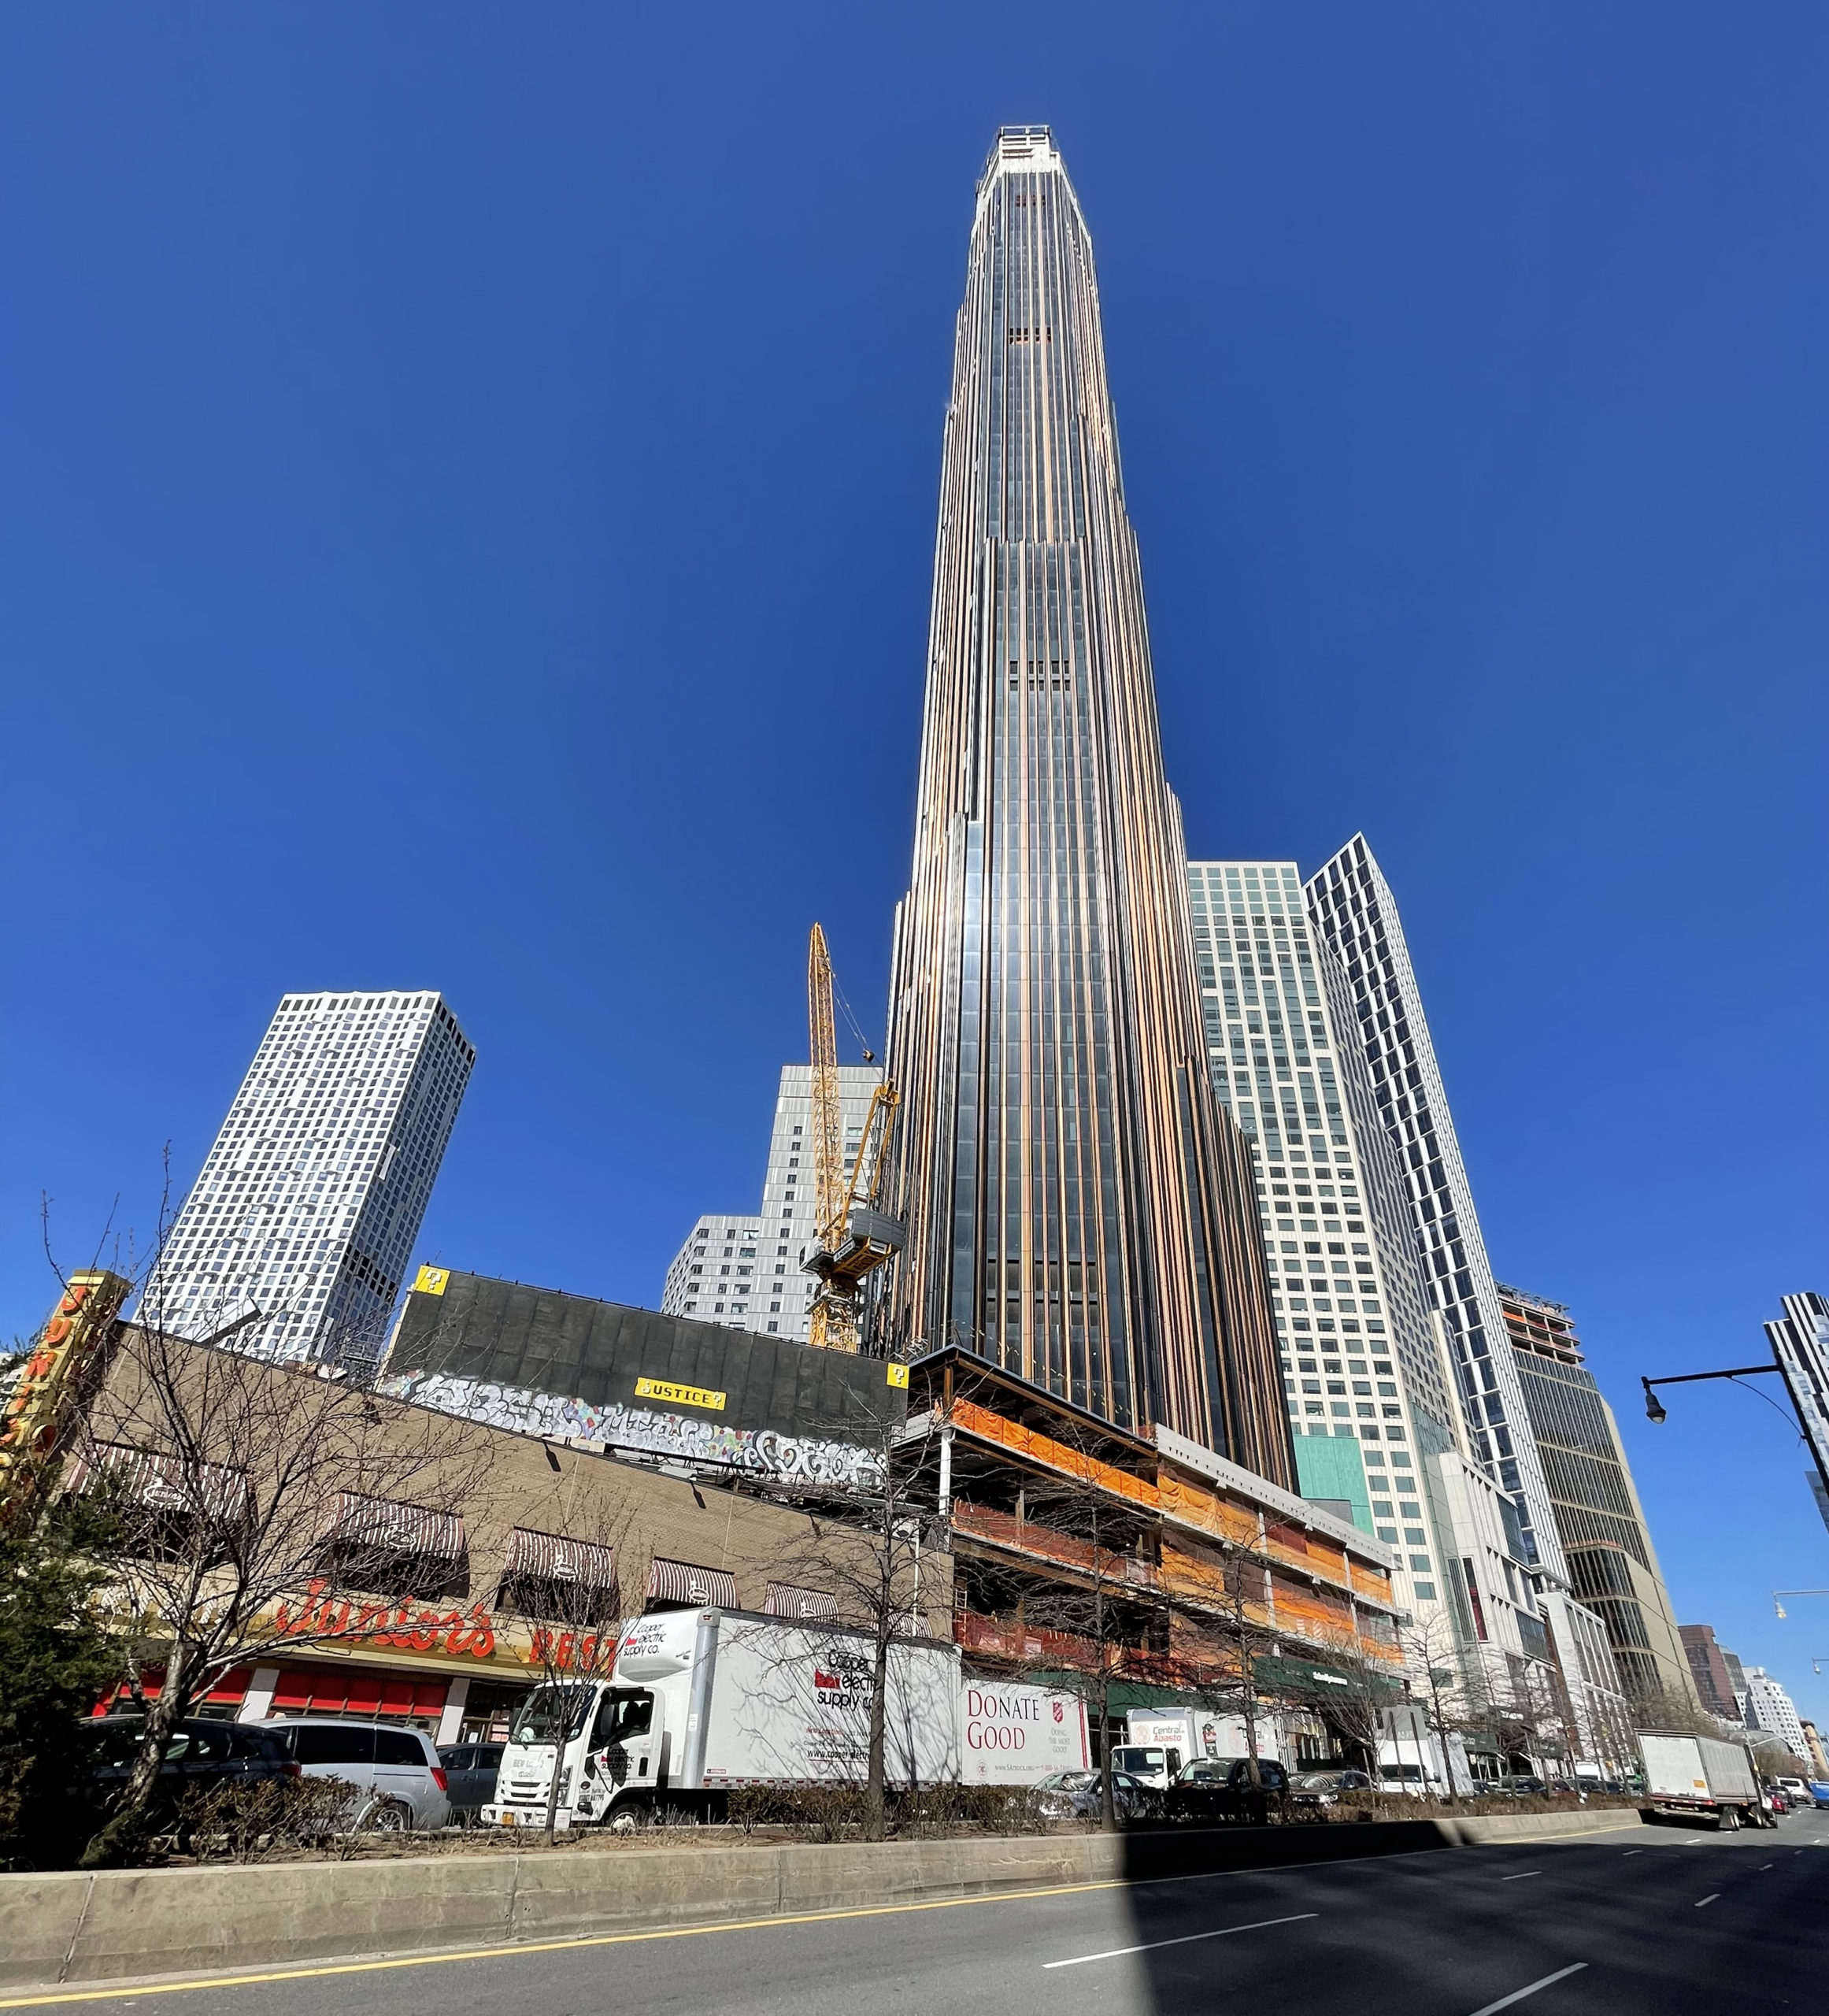
The Brooklyn Tower. Photo by Michael Young

341 Ninth Avenue. Photo by Michael Young
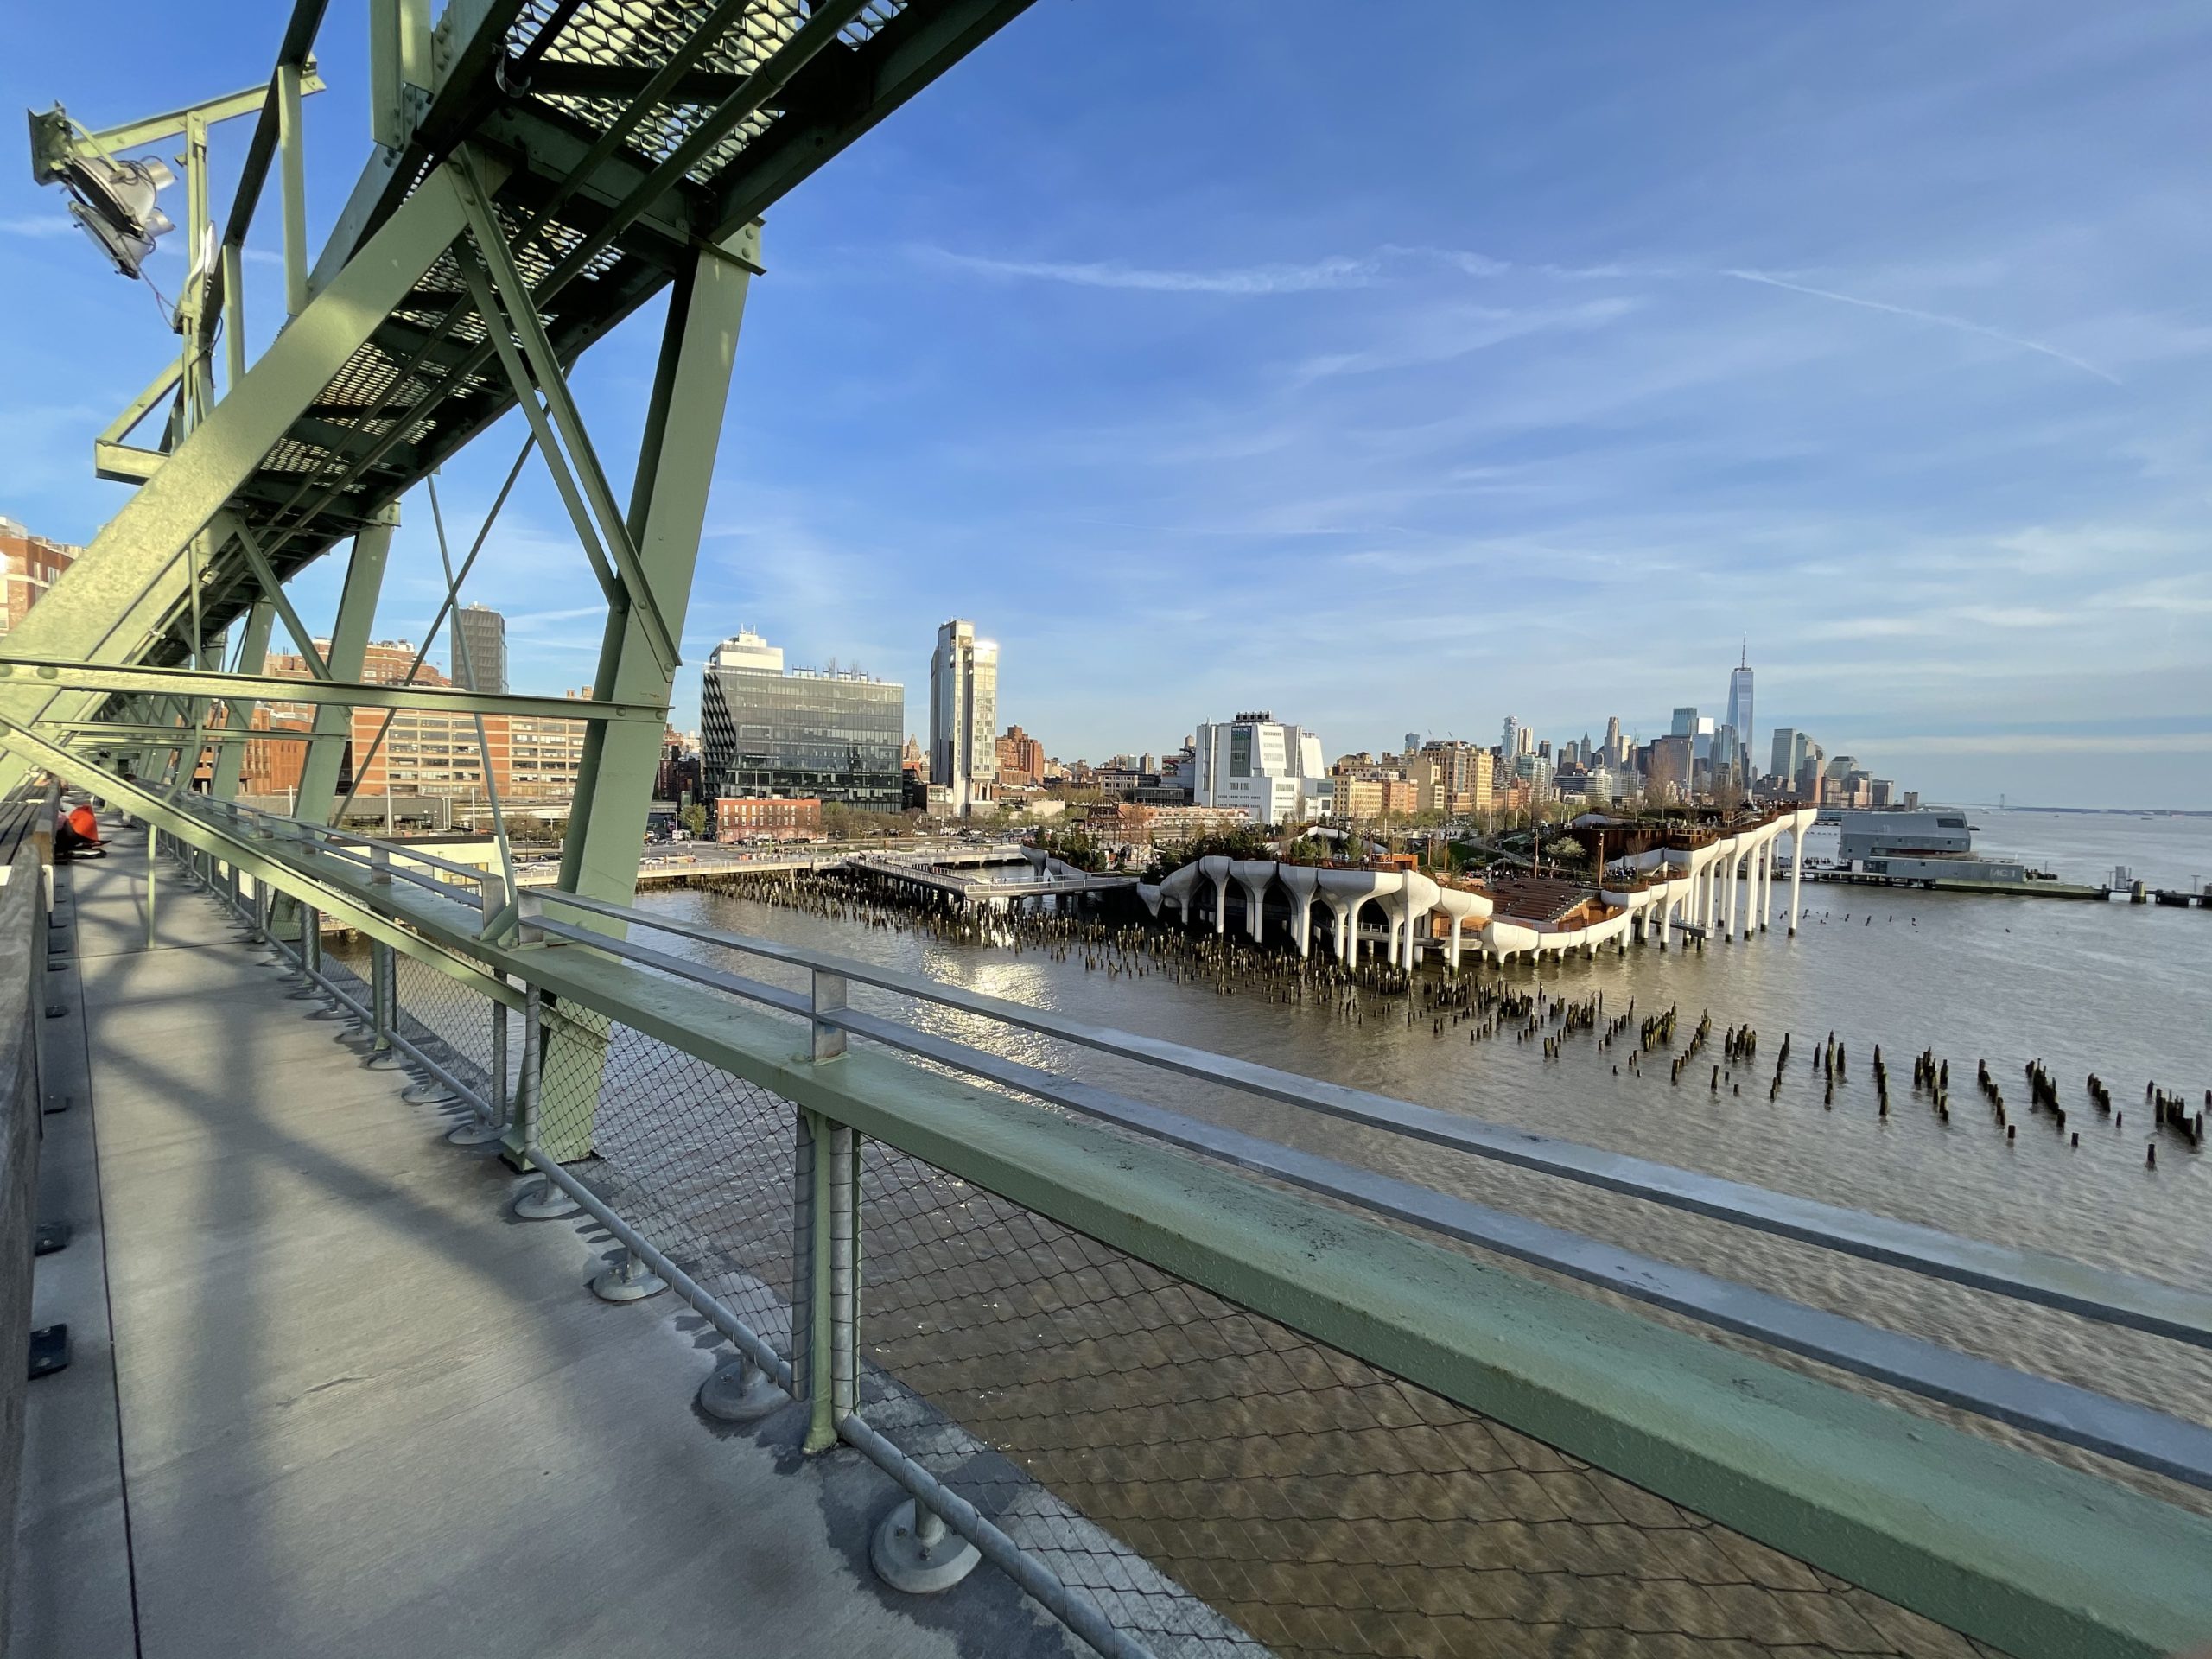
Pier 57. Photo by Michael Young
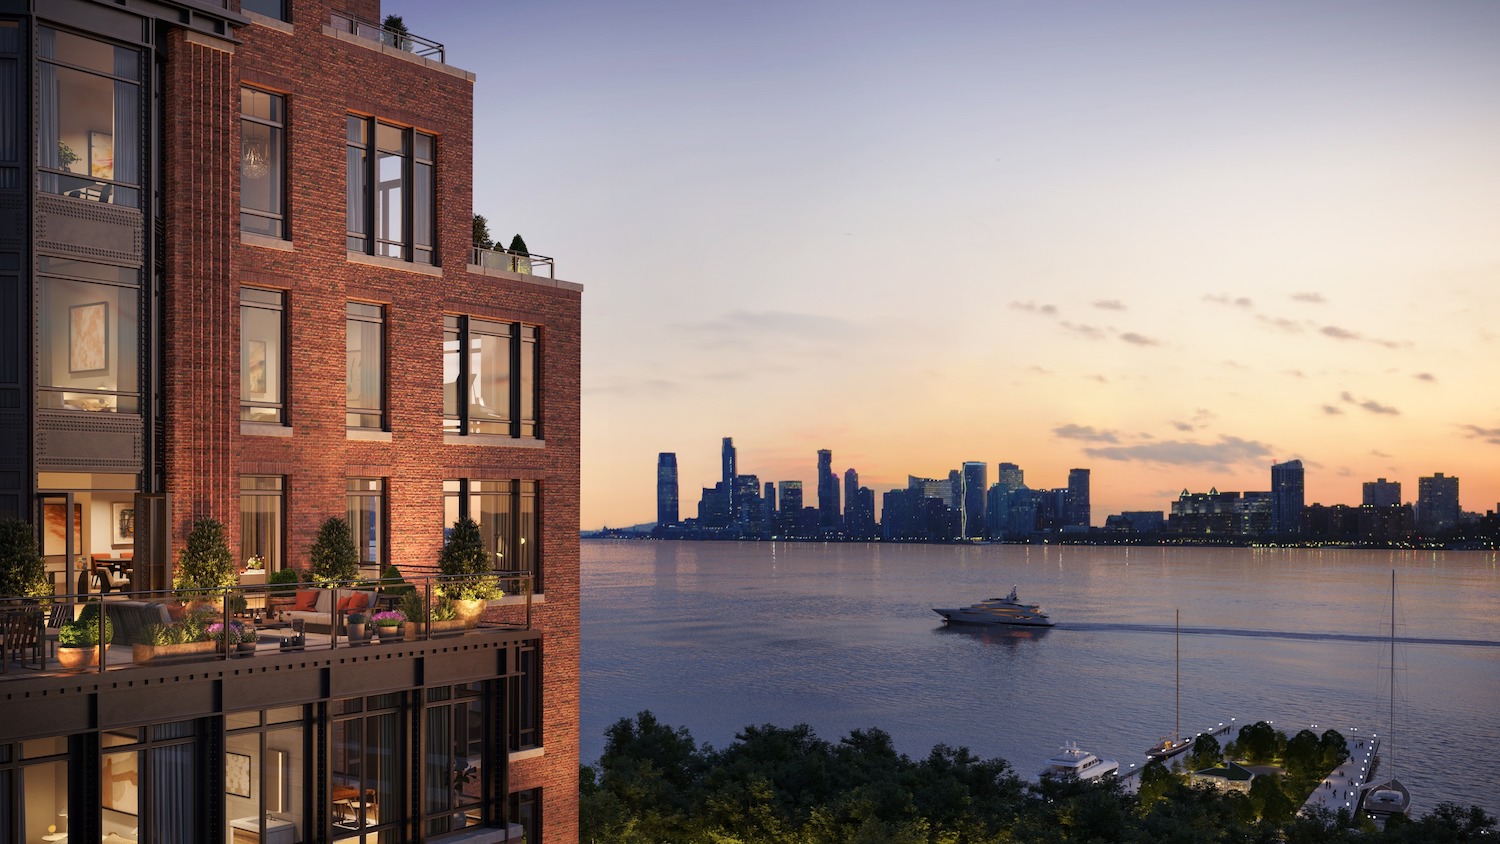
The Cortland. Courtesy of Related
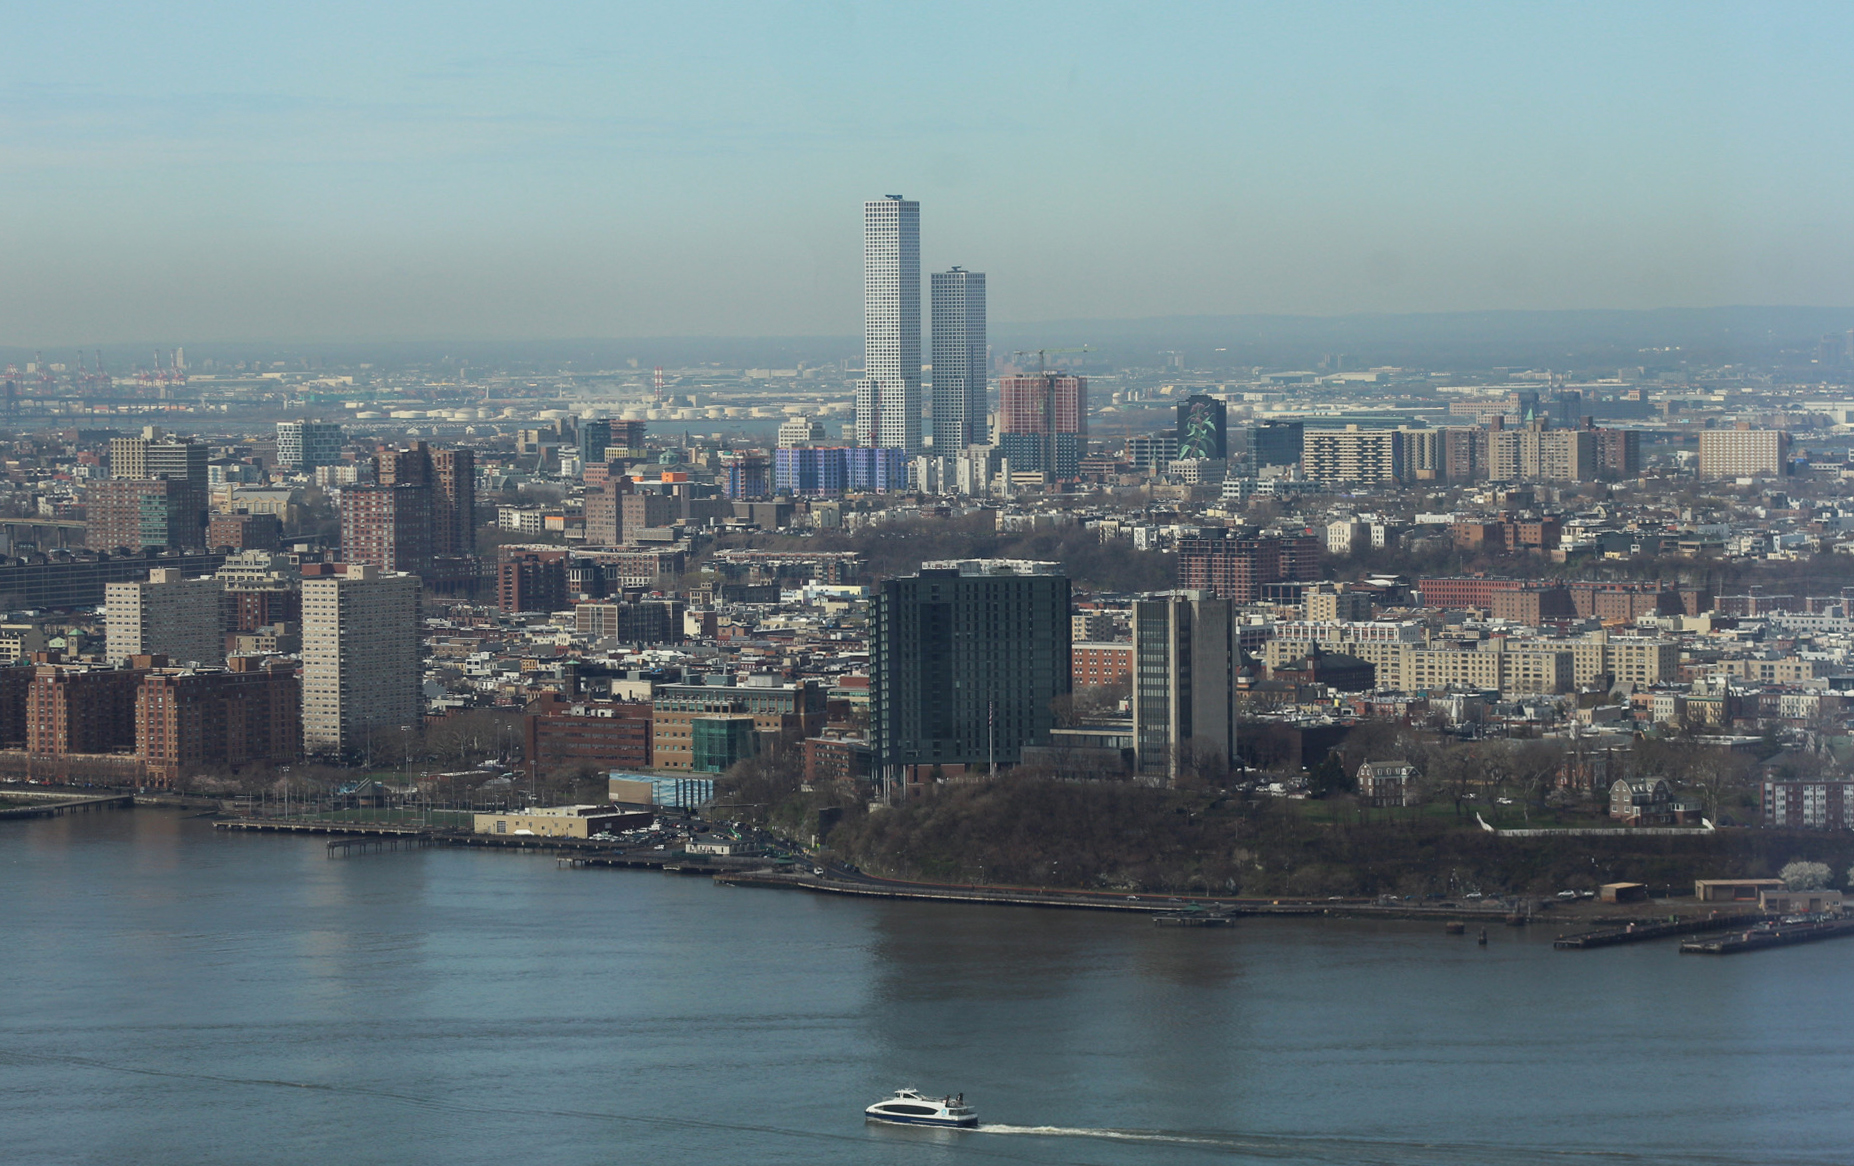
Journal Squared. Photo by Michael Young
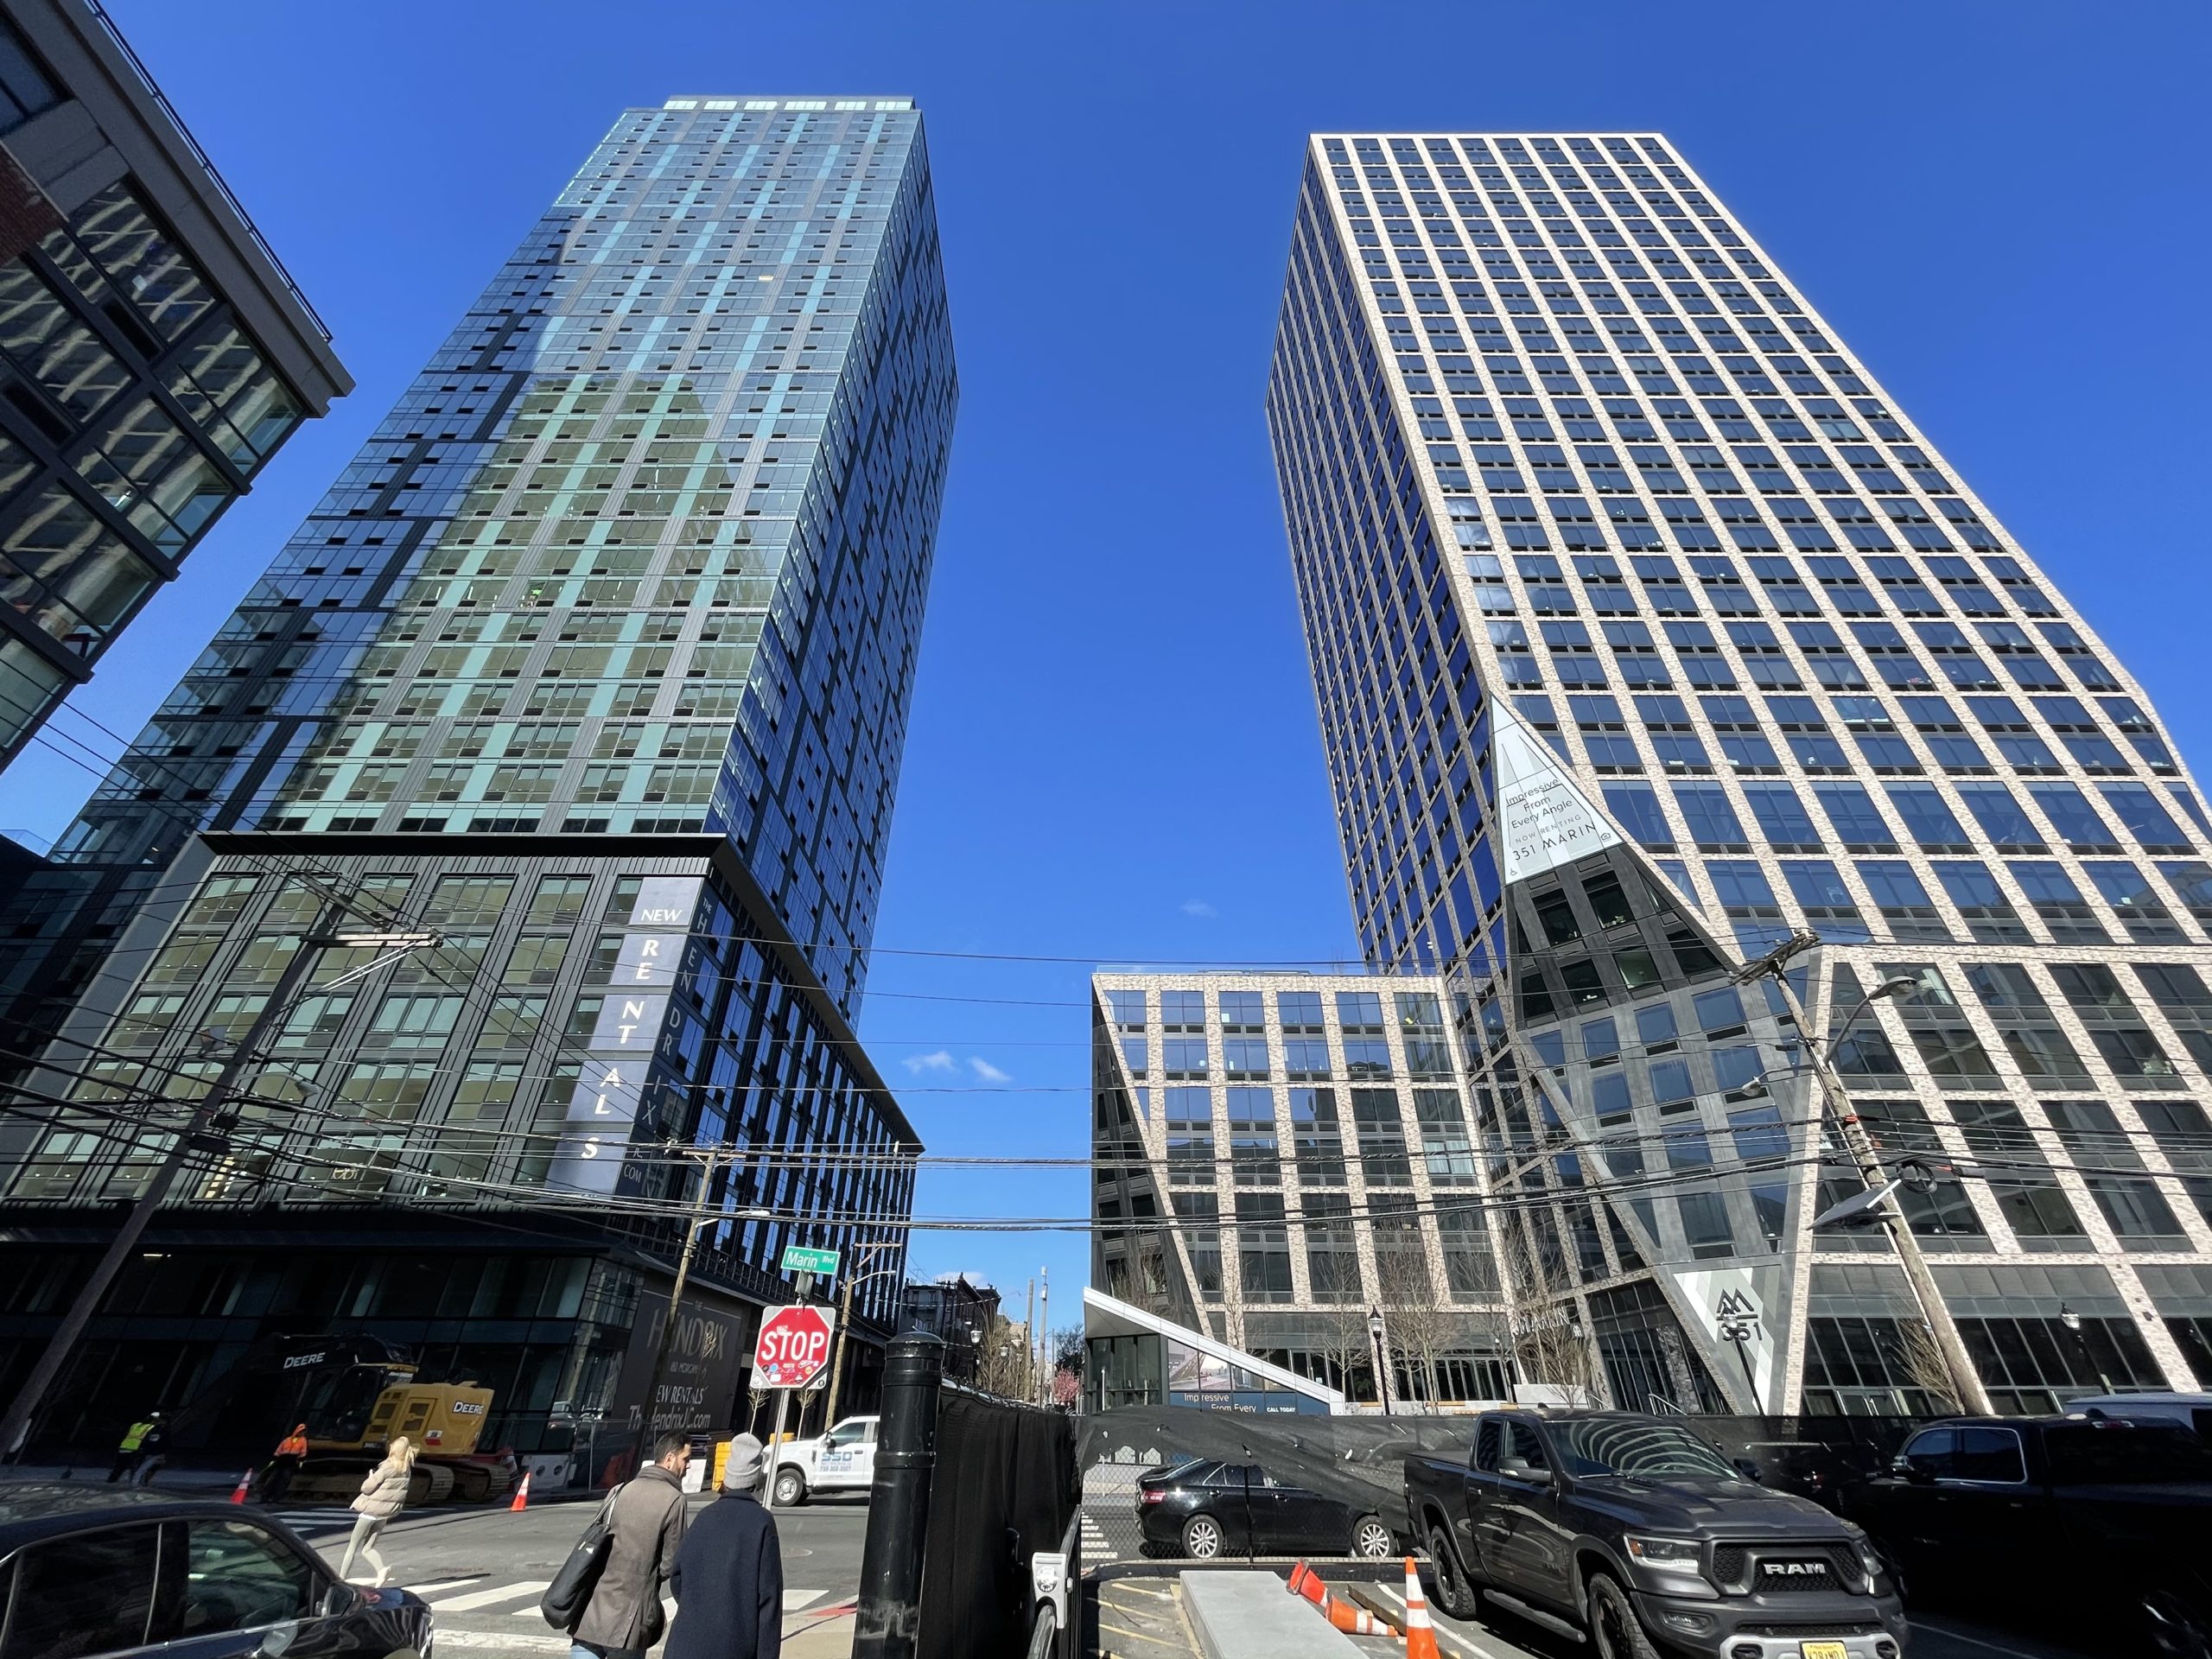
331 Marin Boulevard (left) and 351 Marin Boulevard (right). Photo by Michael Young
270 Park Avenue. Rendering © DBOX for Foster + Partners
Subscribe to YIMBY’s daily e-mail
![]()
Follow YIMBYgram for real-time photo updates
Like YIMBY on Facebook
Follow YIMBY’s Twitter for the latest in YIMBYnews
Keep it up, NYC!
Good to see some positive photos of the city
But we have to clean the streets and subways stations up
Peeling paint flooding
This is simply astonishing, and great news for New York City and its people.
Simply put, the sky is not falling, and rumors of this City’s death have been greatly exaggerated.
There is nothing “astonishing” about this and people who have called New York home since the 20th century don’t get excited about adding more tourists or mind numbingly boring people such as yourself.
It IS astonishing, given what the City has been put though. The City – like all cities – would like more tourists, for obvious reasons. And I see nothing “boring” in Paul’s comments.
What a sad frustrated person you must be. Pitiful.
“Mind-numbingly boring people?” How dare you act so pompous and arrogant towards Paul and his comment. There’s freedom of speech, but this is simply egregious and an abuse of words to him and everyone here on this site.
I suspect a contributing factor to the Q1 strength is the rush to file and permit before the 421a expiry in June 2022. Q2 may have similarly strong numbers, but Q3…
More expensive boxes 🙂 without water less toilets?
Keep building!
All these new units and buildings and still not a damn one I can afford.
Still way too few new units.
Queens in particular should have a lot more larger construction.
Great post, always a good research.
All these permits have an underlying ulterior motive.
Last year, the “all-knowing” City Council passed a “law” mandating that ALL buildings built after a certain year will be “environmentally friendly,” specifically mandating that those buildings be powered and heated by electrical power ONLY, which, of course, is nothing more than a pipe dream.
So developers quickly moved their projects from the drawing board and put in for the permits to get in under the wire of the mandate of the council’s dictatorial madness.
However, under the city’s..and state’s….present and pending political collapse, there’s a great deal of doubt if these elaborate developments will ever see the light of day.