
In December 2024, the New York City Council passed The City of Yes for Housing Opportunity, a sizable zoning amendment meant to facilitate and encourage much-needed residential construction in the housing-starved megapolis. A year later, the legislative measure already appears to yield much-welcome positive results. A data sheet that provides detailed information on each proposed project and their development teams is available with a subscription to YIMBY’s Building Wire.
YIMBY’s permit filing report for the first quarter of 2026, which tallies new building permit filings for the three-month period spanning from January through March, tallied an impressive total of 28,773 proposed residential (primarily) and hotel units, an impressive upgrade from the previous year’s average quarterly tally of 14,338. Similarly, the total number of filed permits increased from 686 per average quarter in 2025 to 793 in the first quarter of 2026. The filed-for squared footage rose from 16.9 million per average quarter last year to 34.6 million square feet in Q1 2026. Below, YIMBY breaks down these promising statistics into greater detail that look at building floor counts, floor area, location, and beyond.
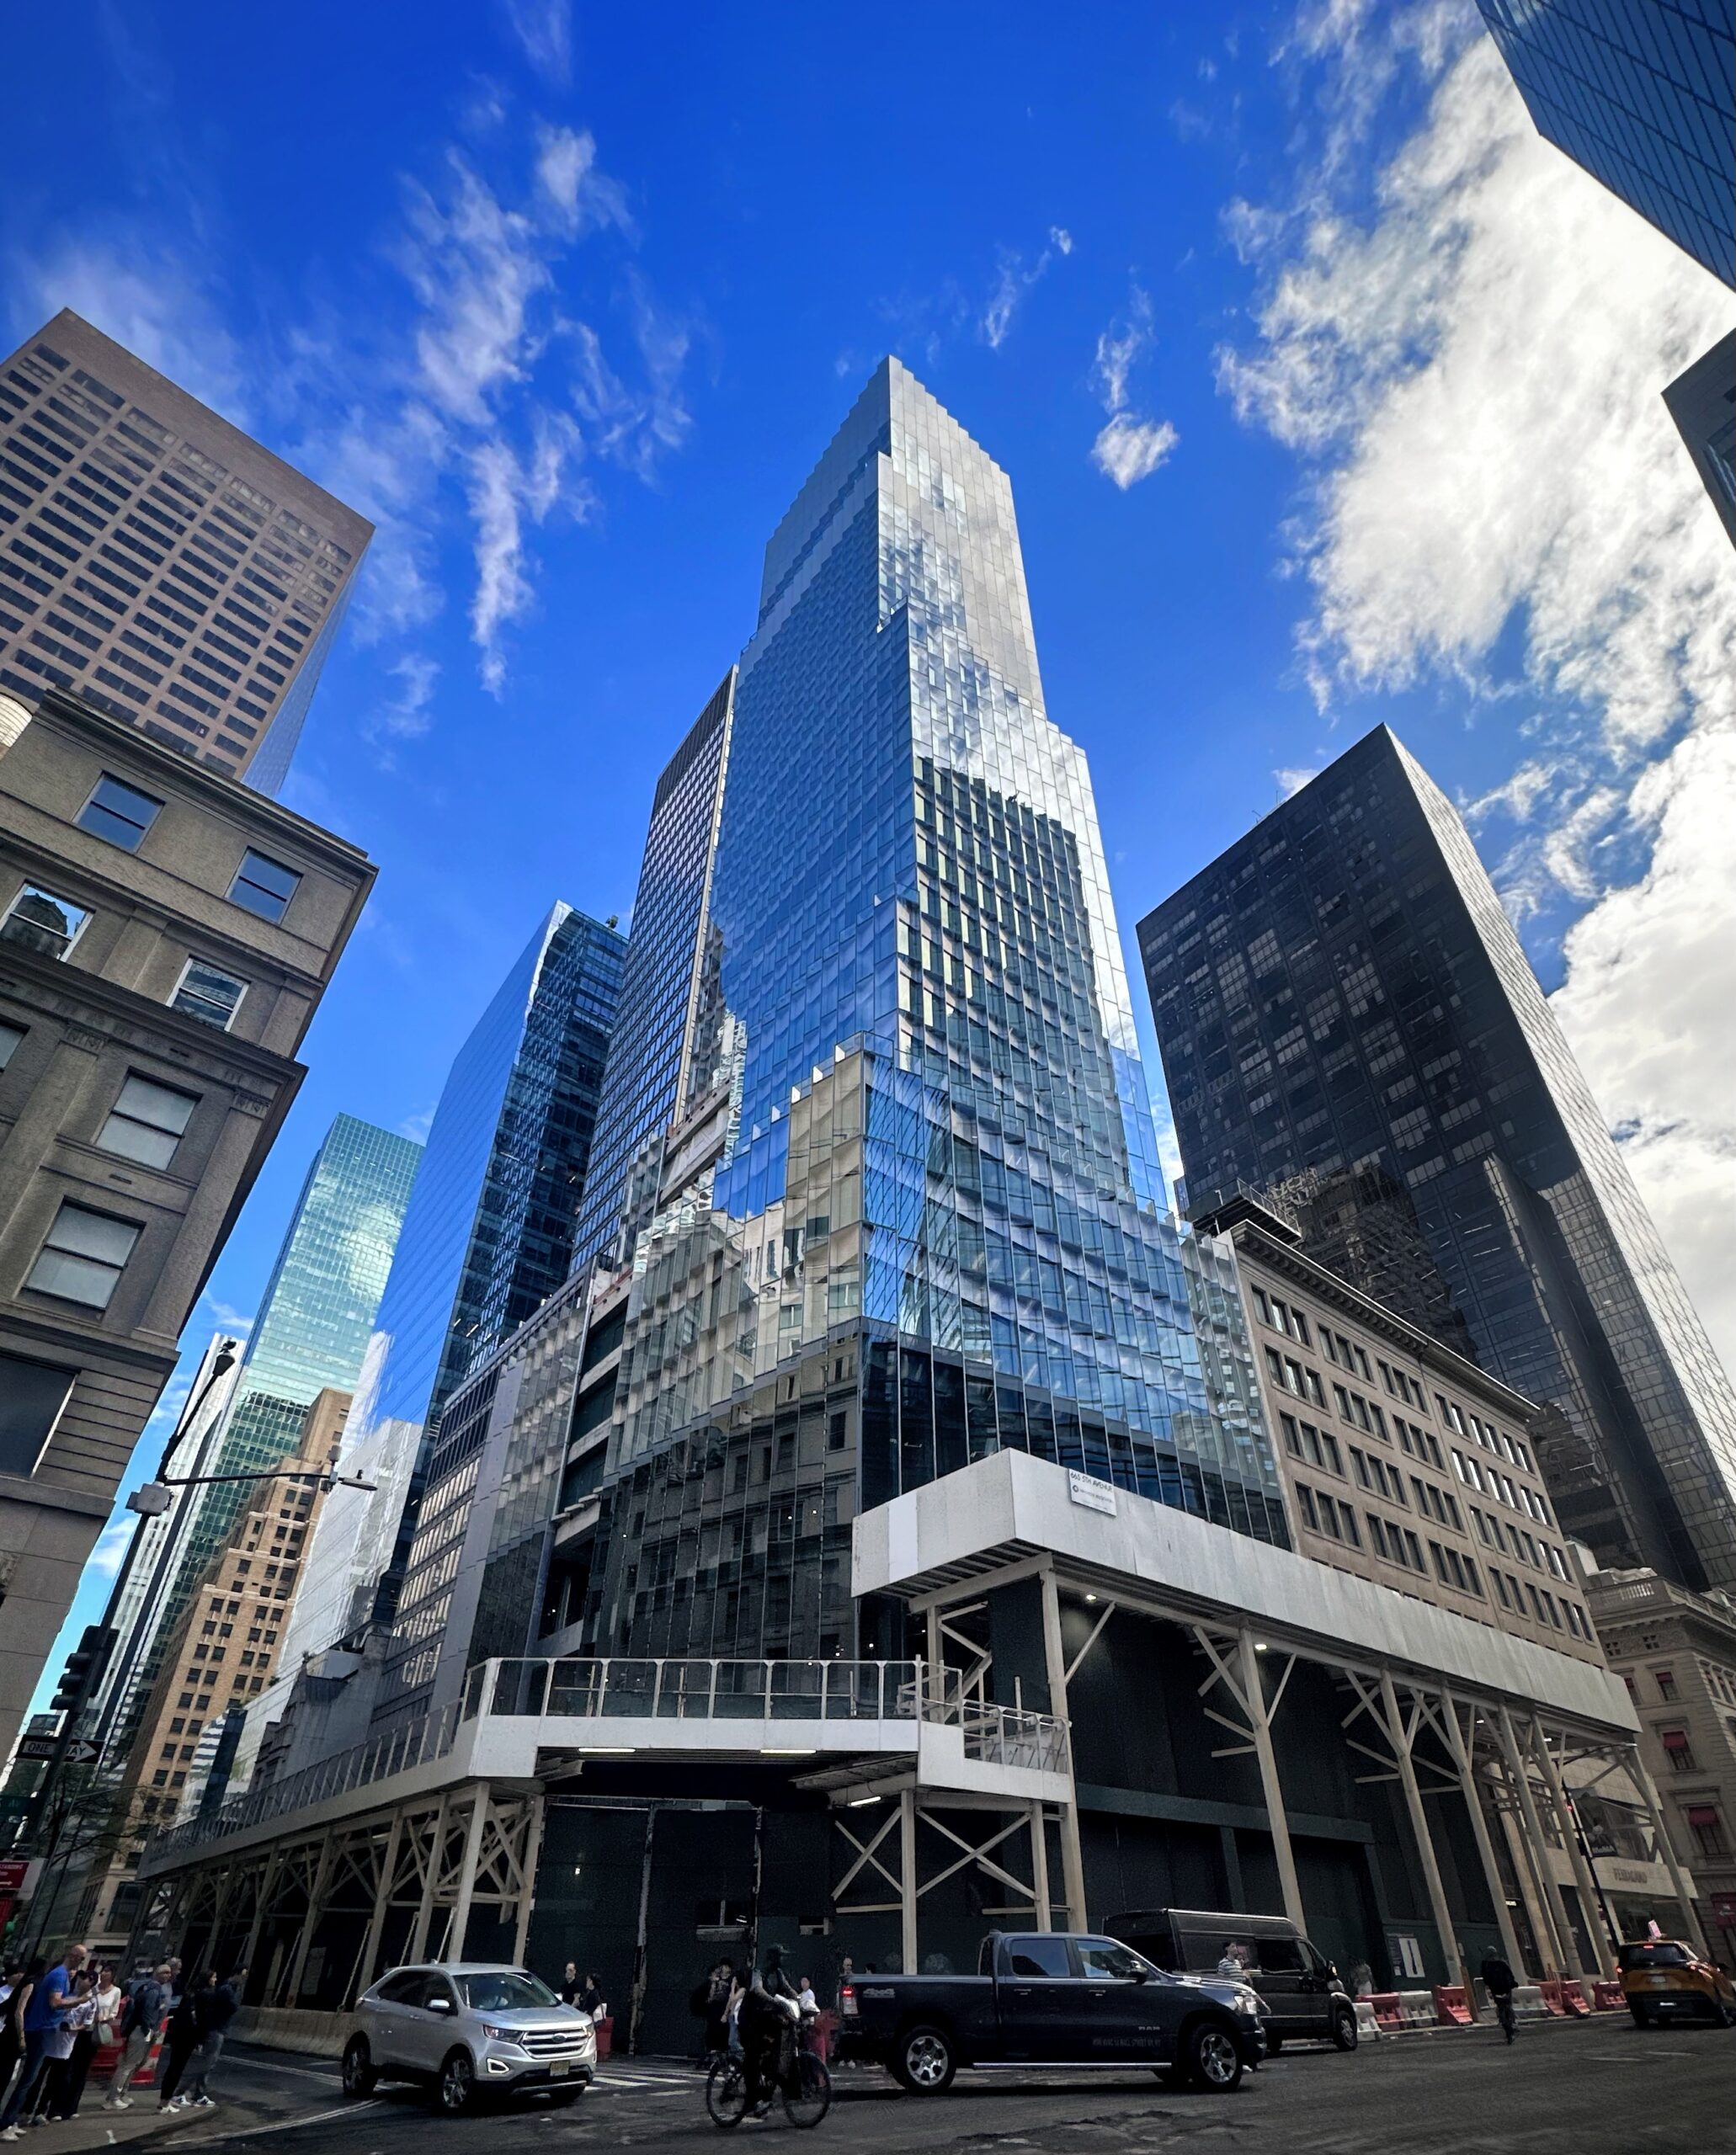
665 Fifth Avenue. Photo by Michael Young.
Number of permit filings per month
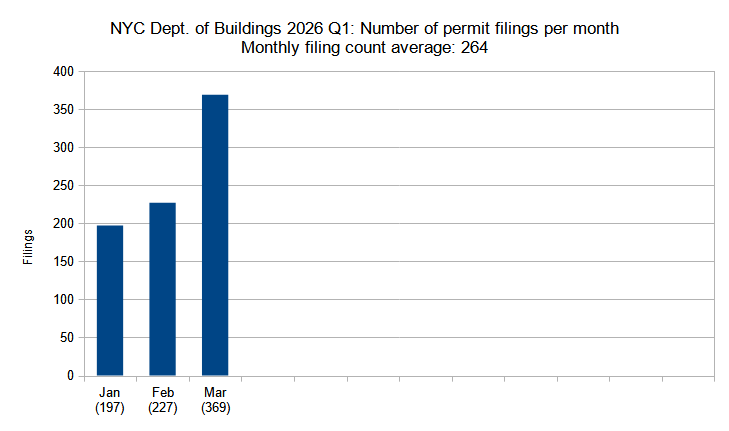
Number of new construction permits filed per month in New York City in the first quarter (Q1) of 2026. Data source: the Department of Buildings. Data aggregation and graphics credit: Vitali D. Ogorodnikov.
YIMBY’s first batch of new building permit filing data shows that 2026 is already off to an impressive start. Each month during the three-month period showed a significant increase from the previous year: 71 percent in January (from 115 in 2025 to 197 in 2026), 49 percent in February (from 152 to 227), and nearly double (99 percent, from 185 to 369) in March.
So far, the lowest-performing month, January, nearly eclipsed last year’s best-performing month (December, with 206 filings). In turn, the best-performing month, March, more than doubled the monthly filing average of 164 for last year, with a total of 369 filings. This year’s current monthly permit average sits at an impressive 264 permits.
The Village West. Photo by Michael Young.
Number of permit filings by borough
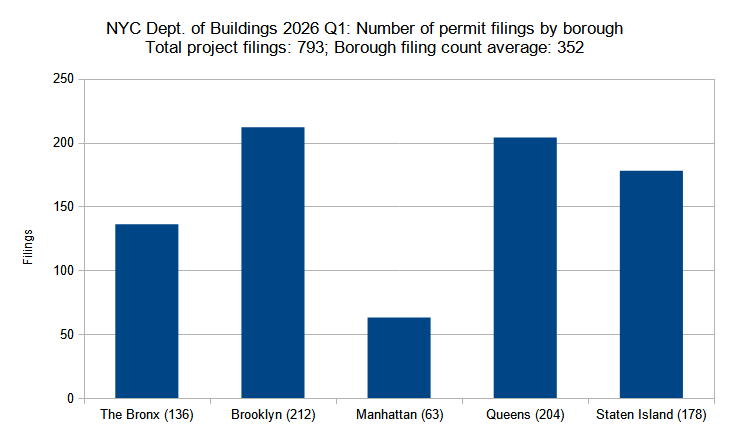
Number of new construction permits filed per borough in New York City in the first quarter (Q1) of 2026. Data source: the Department of Buildings. Data aggregation and graphics credit: Vitali D. Ogorodnikov.
Below is the breakdown of borough statistic changes compared to the prior year’s quarterly averages:
- The Bronx – 56-percent increase (87 to 136 permits)
- Brooklyn – 65-percent increase (128 to 212)
- Manhattan – 133-percent increase (27 to 63)
- Queens – 20-percent increase (170 to 204)
- Staten Island – 120-percent increase (81 to 178)
In the first quarter of 2026, the general trend of permit filings per borough remained steady, where the total number of permit filings is generally inversely proportional to the number of filings in said borough (in other words, the larger the newly proposed buildings are, the fewer of them there are per borough). What is notable is the across-the-board increase.
Each borough observed growth compared to an average quarter from 2025, ranging from 20 percent in Staten Island to a nearly two-and-a-half (133 percent) surge in Manhattan (though the latter, given its large permit filing size average, still trails well behind its counterparts).
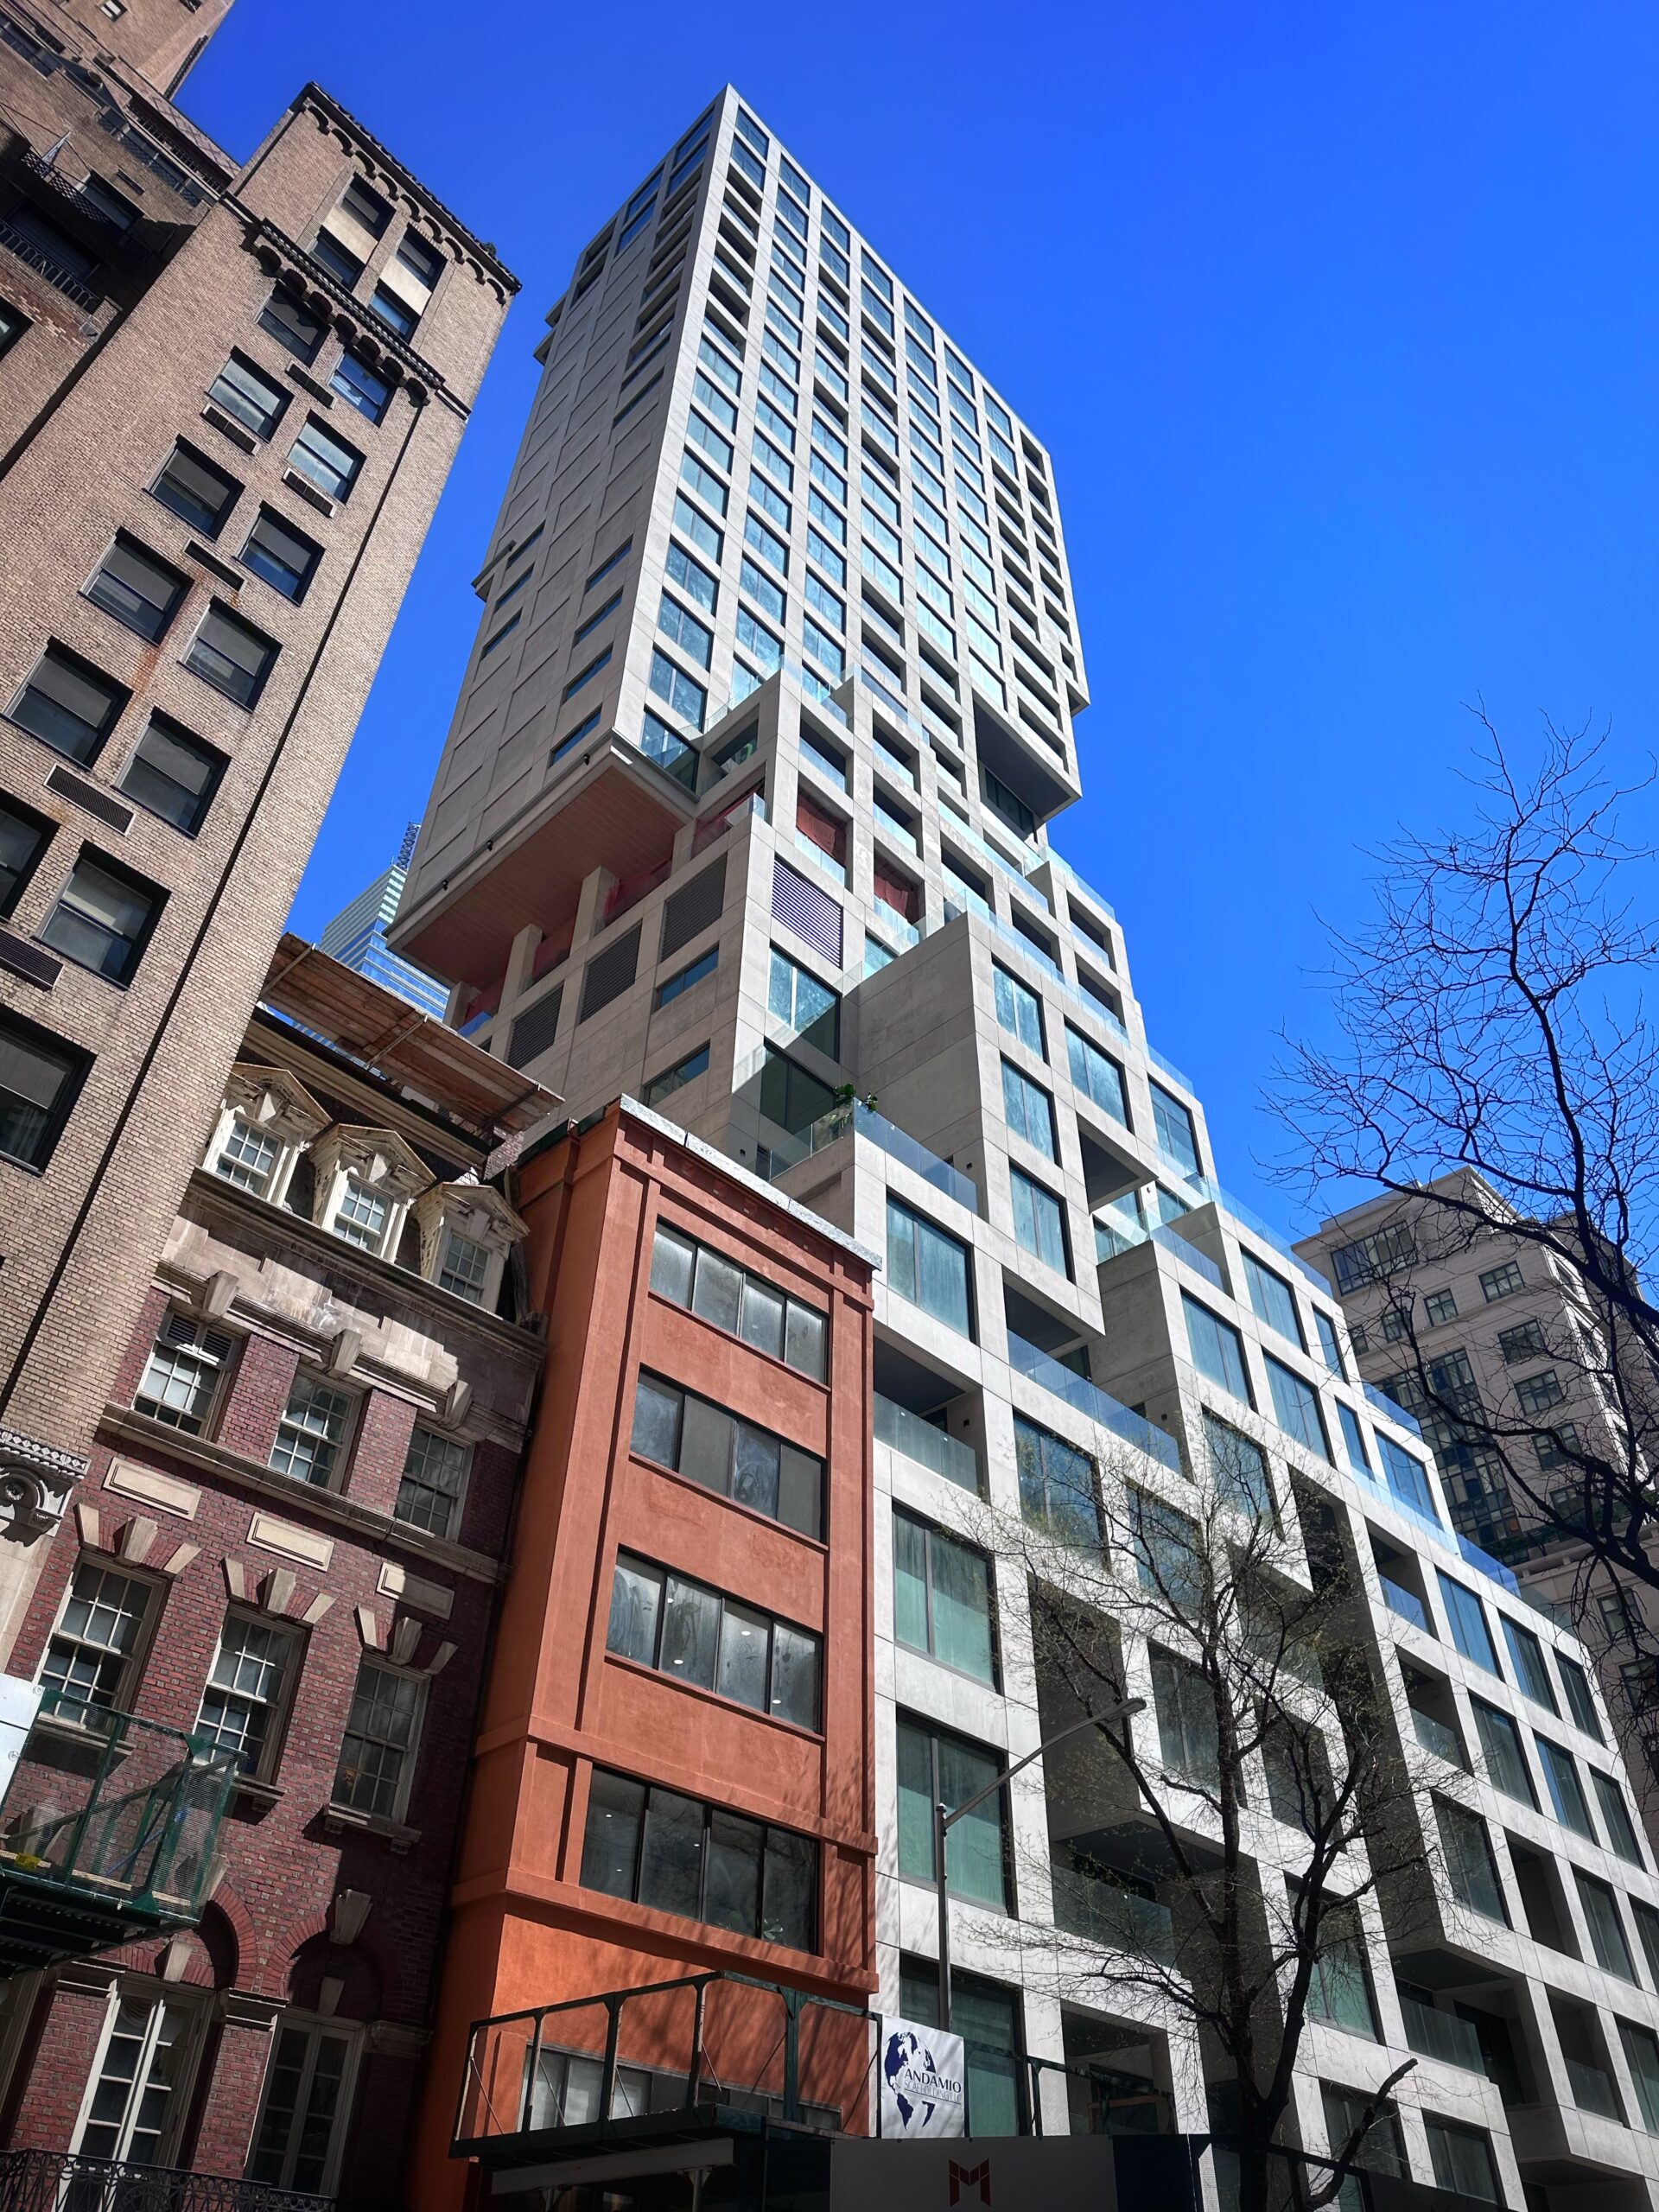
126 East 57th Street. Photo by Michael Young.
Permits listed by unit count per filing
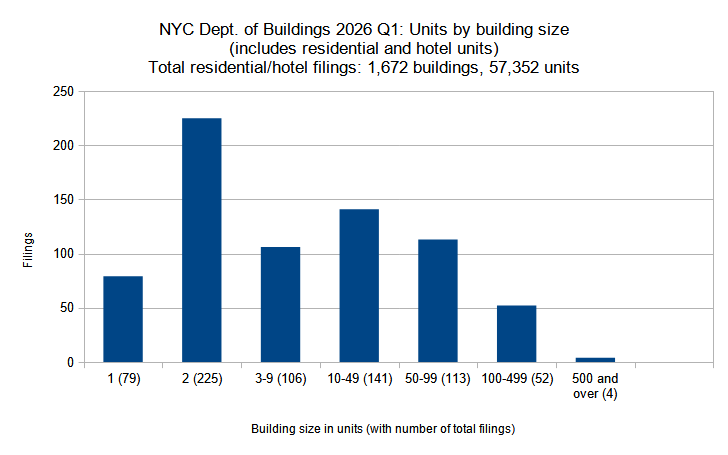
New residential and hotel construction permits filed in New York City in the first quarter (Q1) of 2026, grouped by unit count per filling. Data source: the Department of Buildings. Data aggregation and graphics credit: Vitali D. Ogorodnikov.
Below, the filing size categories are compared to the prior year’s quarterly averages:
- Single-family – 68-percent increase (47 to 79 units)
- Two-family – 80-percent increase (125 to 225)
- Three to nine units – 56-percent increase (68 to 106)
- Ten to 49 units – 57-percent increase (90 to 141)
- 50 to 99 units – 88-percent increase (60 to 113)
- 100 to 499 units – 102-percent increase (26 to 52)
- 500 to 599 units – 100-percent increase (2 to 4)
The first quarter of 2026 registered permit filings for 1,672 new residential (primarily) and hotel buildings, an incredible figure that nearly matches last year’s combined 12-month total of 1,972. As such, it is unsurprising to see a surge in totals when broken down by floor count category, where each category shows half-again to doubling growth compared to the previous year’s averages. Notably, the numbers approximately doubled in every category with 50 units and more.
Below are the top ten permit filings with the highest unit counts for the quarter:
- 548 West 36th Street in Hudson Yards, Manhattan (1,458 units)
- 495 Eleventh Avenue in Hudson Yards, Manhattan (1,023 units)
- 18 India Street in Greenpoint, Brooklyn (834 units)
- 6202 8th Avenue in Sunset Park, Brooklyn (549 units)
- 2560 Boston Road in Allerton, The Bronx (483 units)
- 484 Eighth Avenue in Midtown South, Manhattan (481 units)
- 407 West 206th Street in Inwood, Manhattan (474 units)
- 460 Tenth Avenue in Hudson Yards, Manhattan (456 units)
- 170 West 48th Street in Midtown, Manhattan (419 units)
- 498 Columbia Street in Red Hook, Brooklyn (369 units)
The year’s first quarter saw a resurgence of activity in somewhat-dormant Hudson Yards, where three of the top-ten largest unit count filings, including the two largest ones, are found. The entire top-ten list is split between Manhattan and Brooklyn, with the fourth-largest filing found in the burgeoning Central Brooklyn community of Sunset Park (at 6202 8th Avenue, along Brooklyn Chinatown’s bustling commercial corridor), a thriving immigrant-dominated hub long overdue for greater housing density.
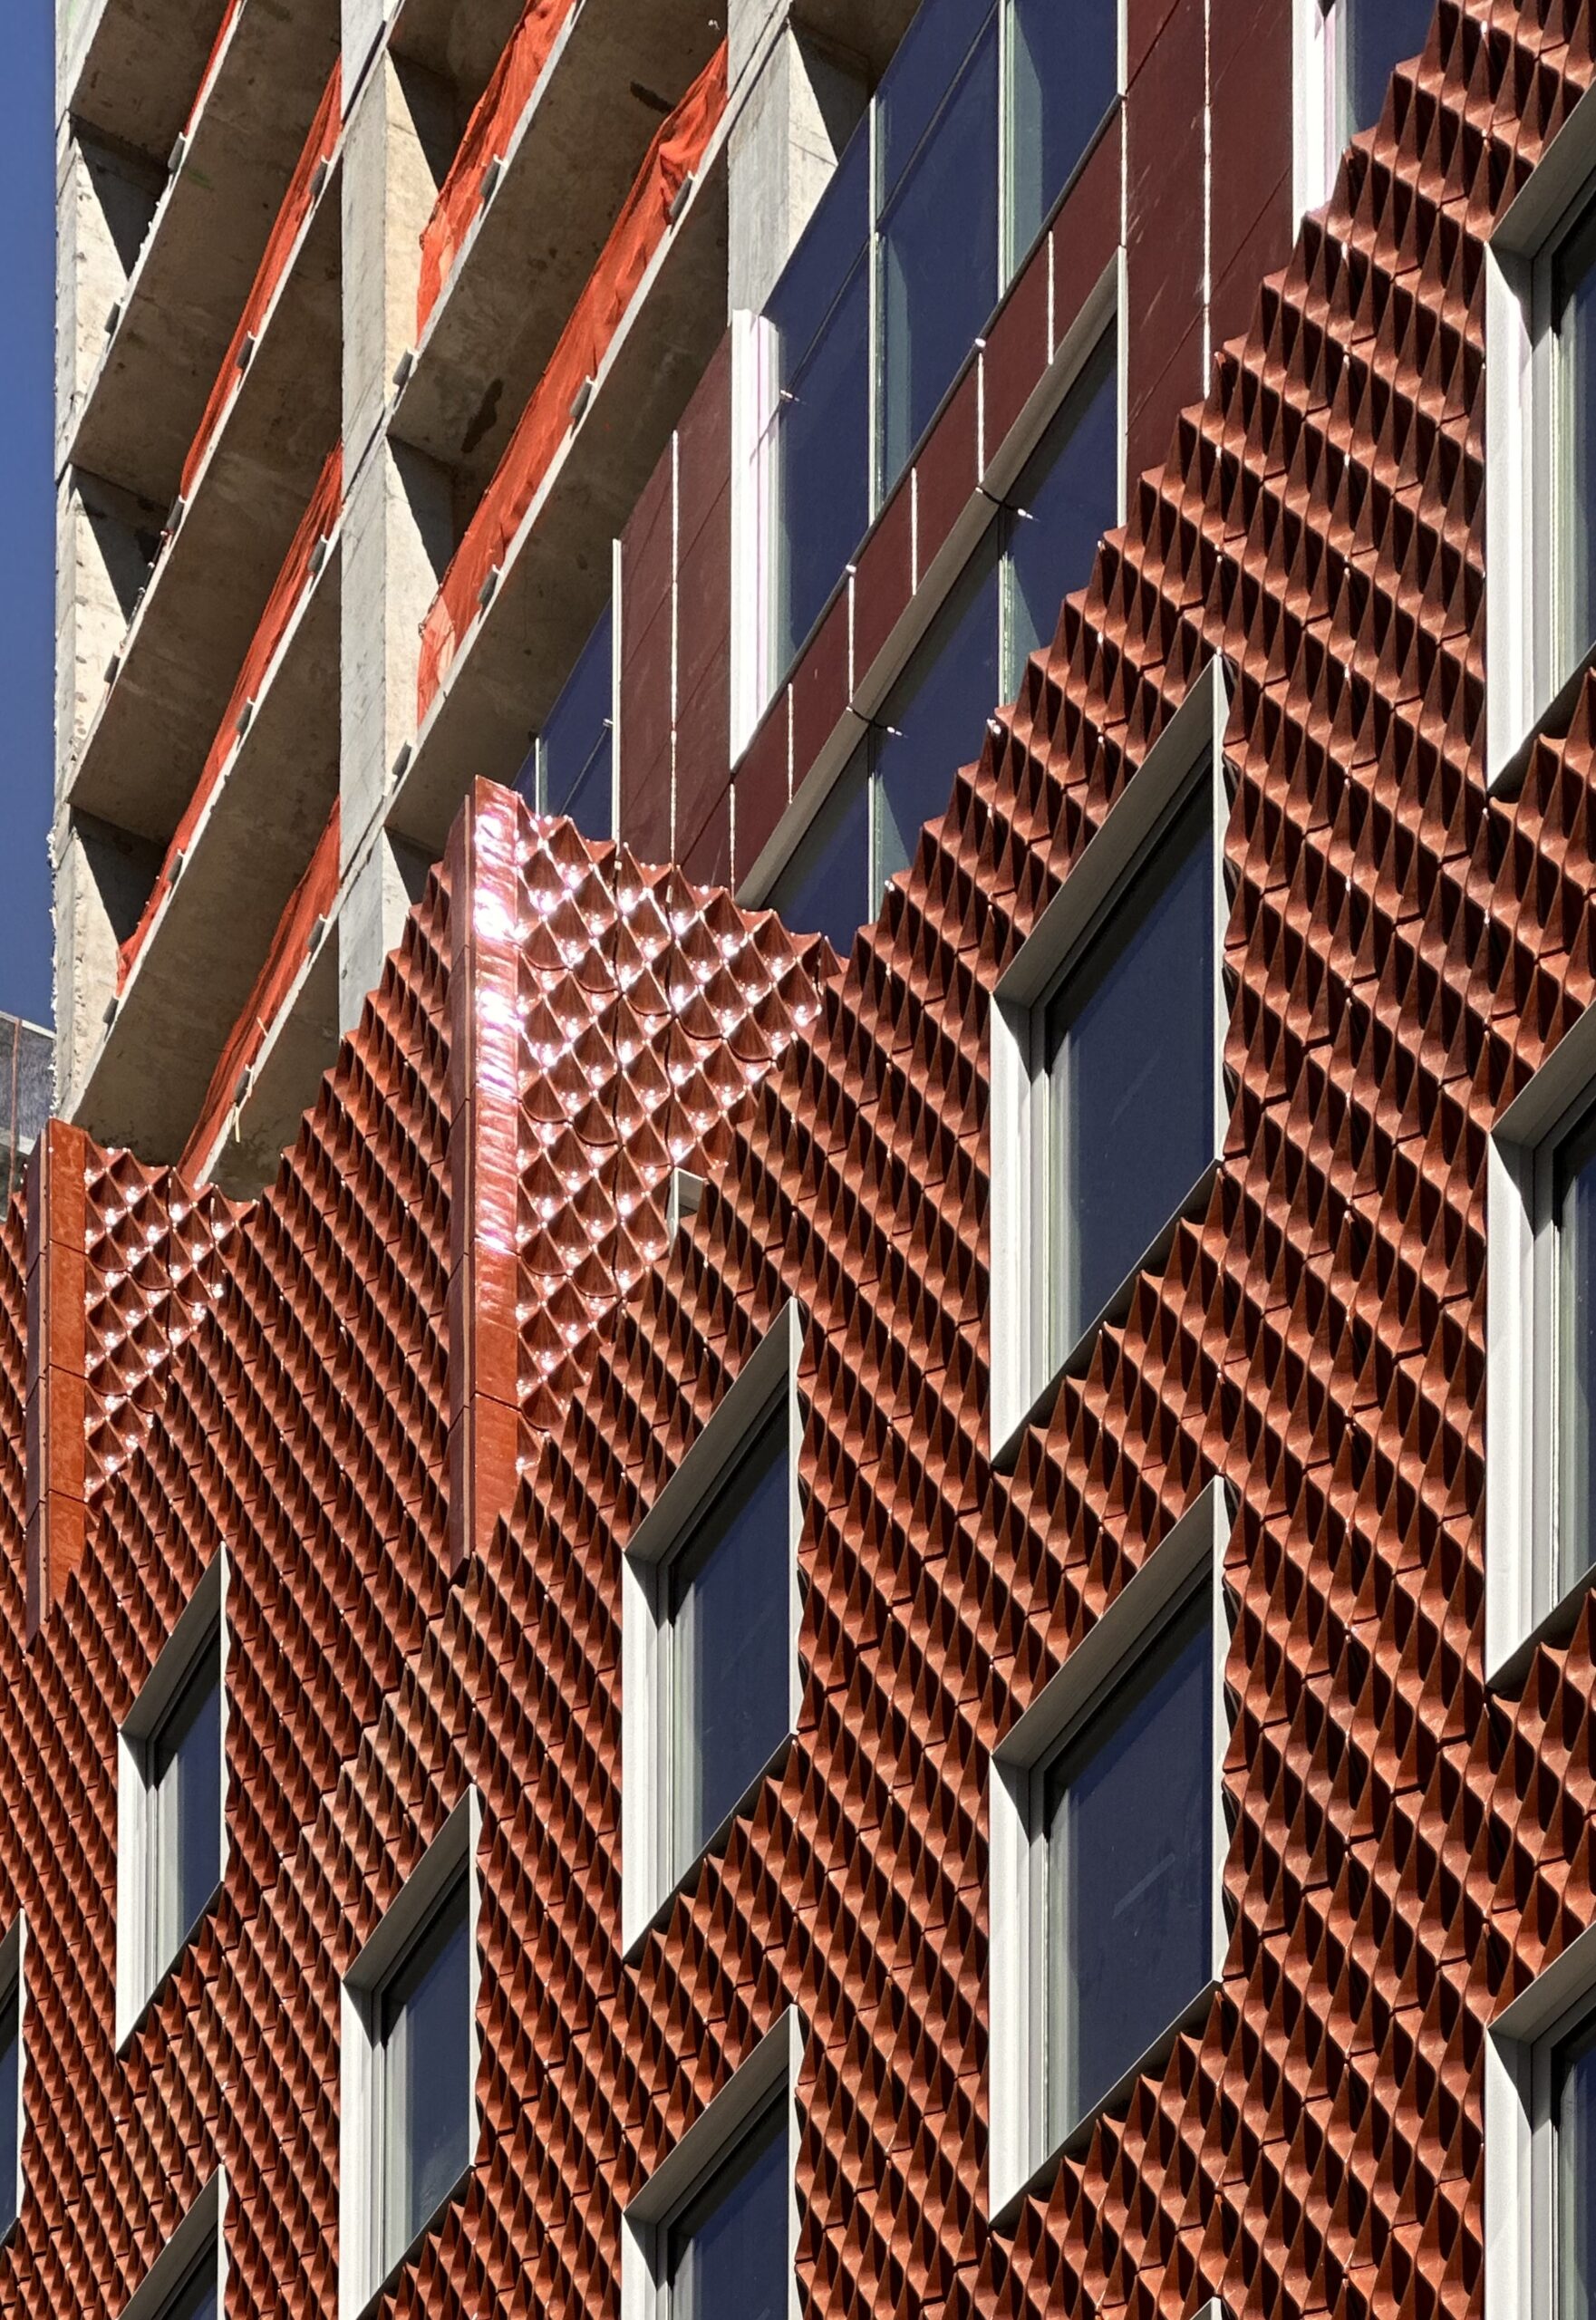
430 East 51st Street. Photo by Michael Young.
Residential and hotel units filed per borough
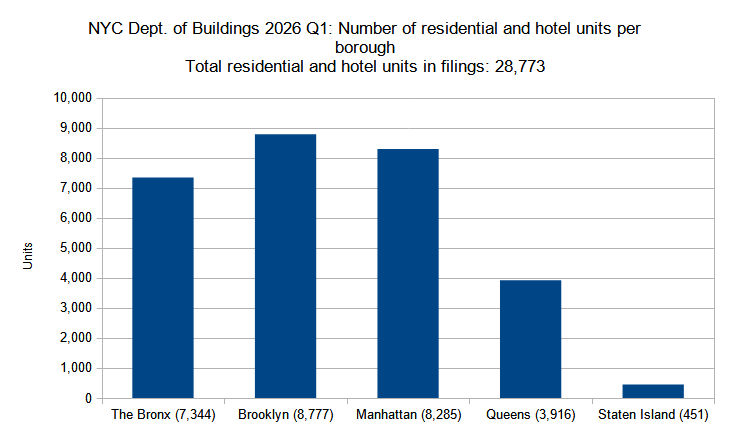
Number of residential and hotel units in new construction permits filed per borough in New York City in the first quarter (Q1) of 2026. Data source: the Department of Buildings. Data aggregation and graphics credit: Vitali Ogorodnikov
Below is a by-borough comparison to the previous year’s quarterly average:
- The Bronx – 100-percent increase (3,677 to 7,344 residential and hotel units)
- Brooklyn – 76-percent increase (4,976 to 8,777)
- Manhattan – 289-percent increase (2,131 to 8,285)
- Queens – 17-percent increase (3,345 to 3,916)
- Staten Island – 116-percent increase (209 to 451)
The combined residential and hotel unit total for the first quarter of 2026 was a respectable (though still rather insufficient given the city’s housing shortage) figure of 28,773. The by-borough breakdown of largest unit-count filings also shows growth in each category, ranging from 17 percent in Queens to a near-quadrupling (289 percent) in Manhattan.
Below are the top permit filings with the highest unit counts for each borough in 2026:
- The Bronx – 2560 Boston Road in Allerton (483 units)
- Brooklyn – 18 India Street in Greenpoint (834 units)
- Manhattan – 548 West 36th Street in Hudson Yards (1,458 units)
- Queens – 40-25 Crescent Street in Long Island City (260 units)
- Staten Island – 930 A West Fingerboard Road in Grasmere (50 units)
A look at the highest unit-count permit filings shows that the construction boom is beginning to spread more evenly throughout each borough, as intended in part by the City of Yes initiative. For the most part, each borough’s respective filing is proposed for a neighborhood outside of said borough’s central business and skyline hub; the only partial exception is 40-25 Crescent Street proposed in Long Island City in Queens, as the latter will rise on the border with the adjacent Astoria neighborhood to the north.
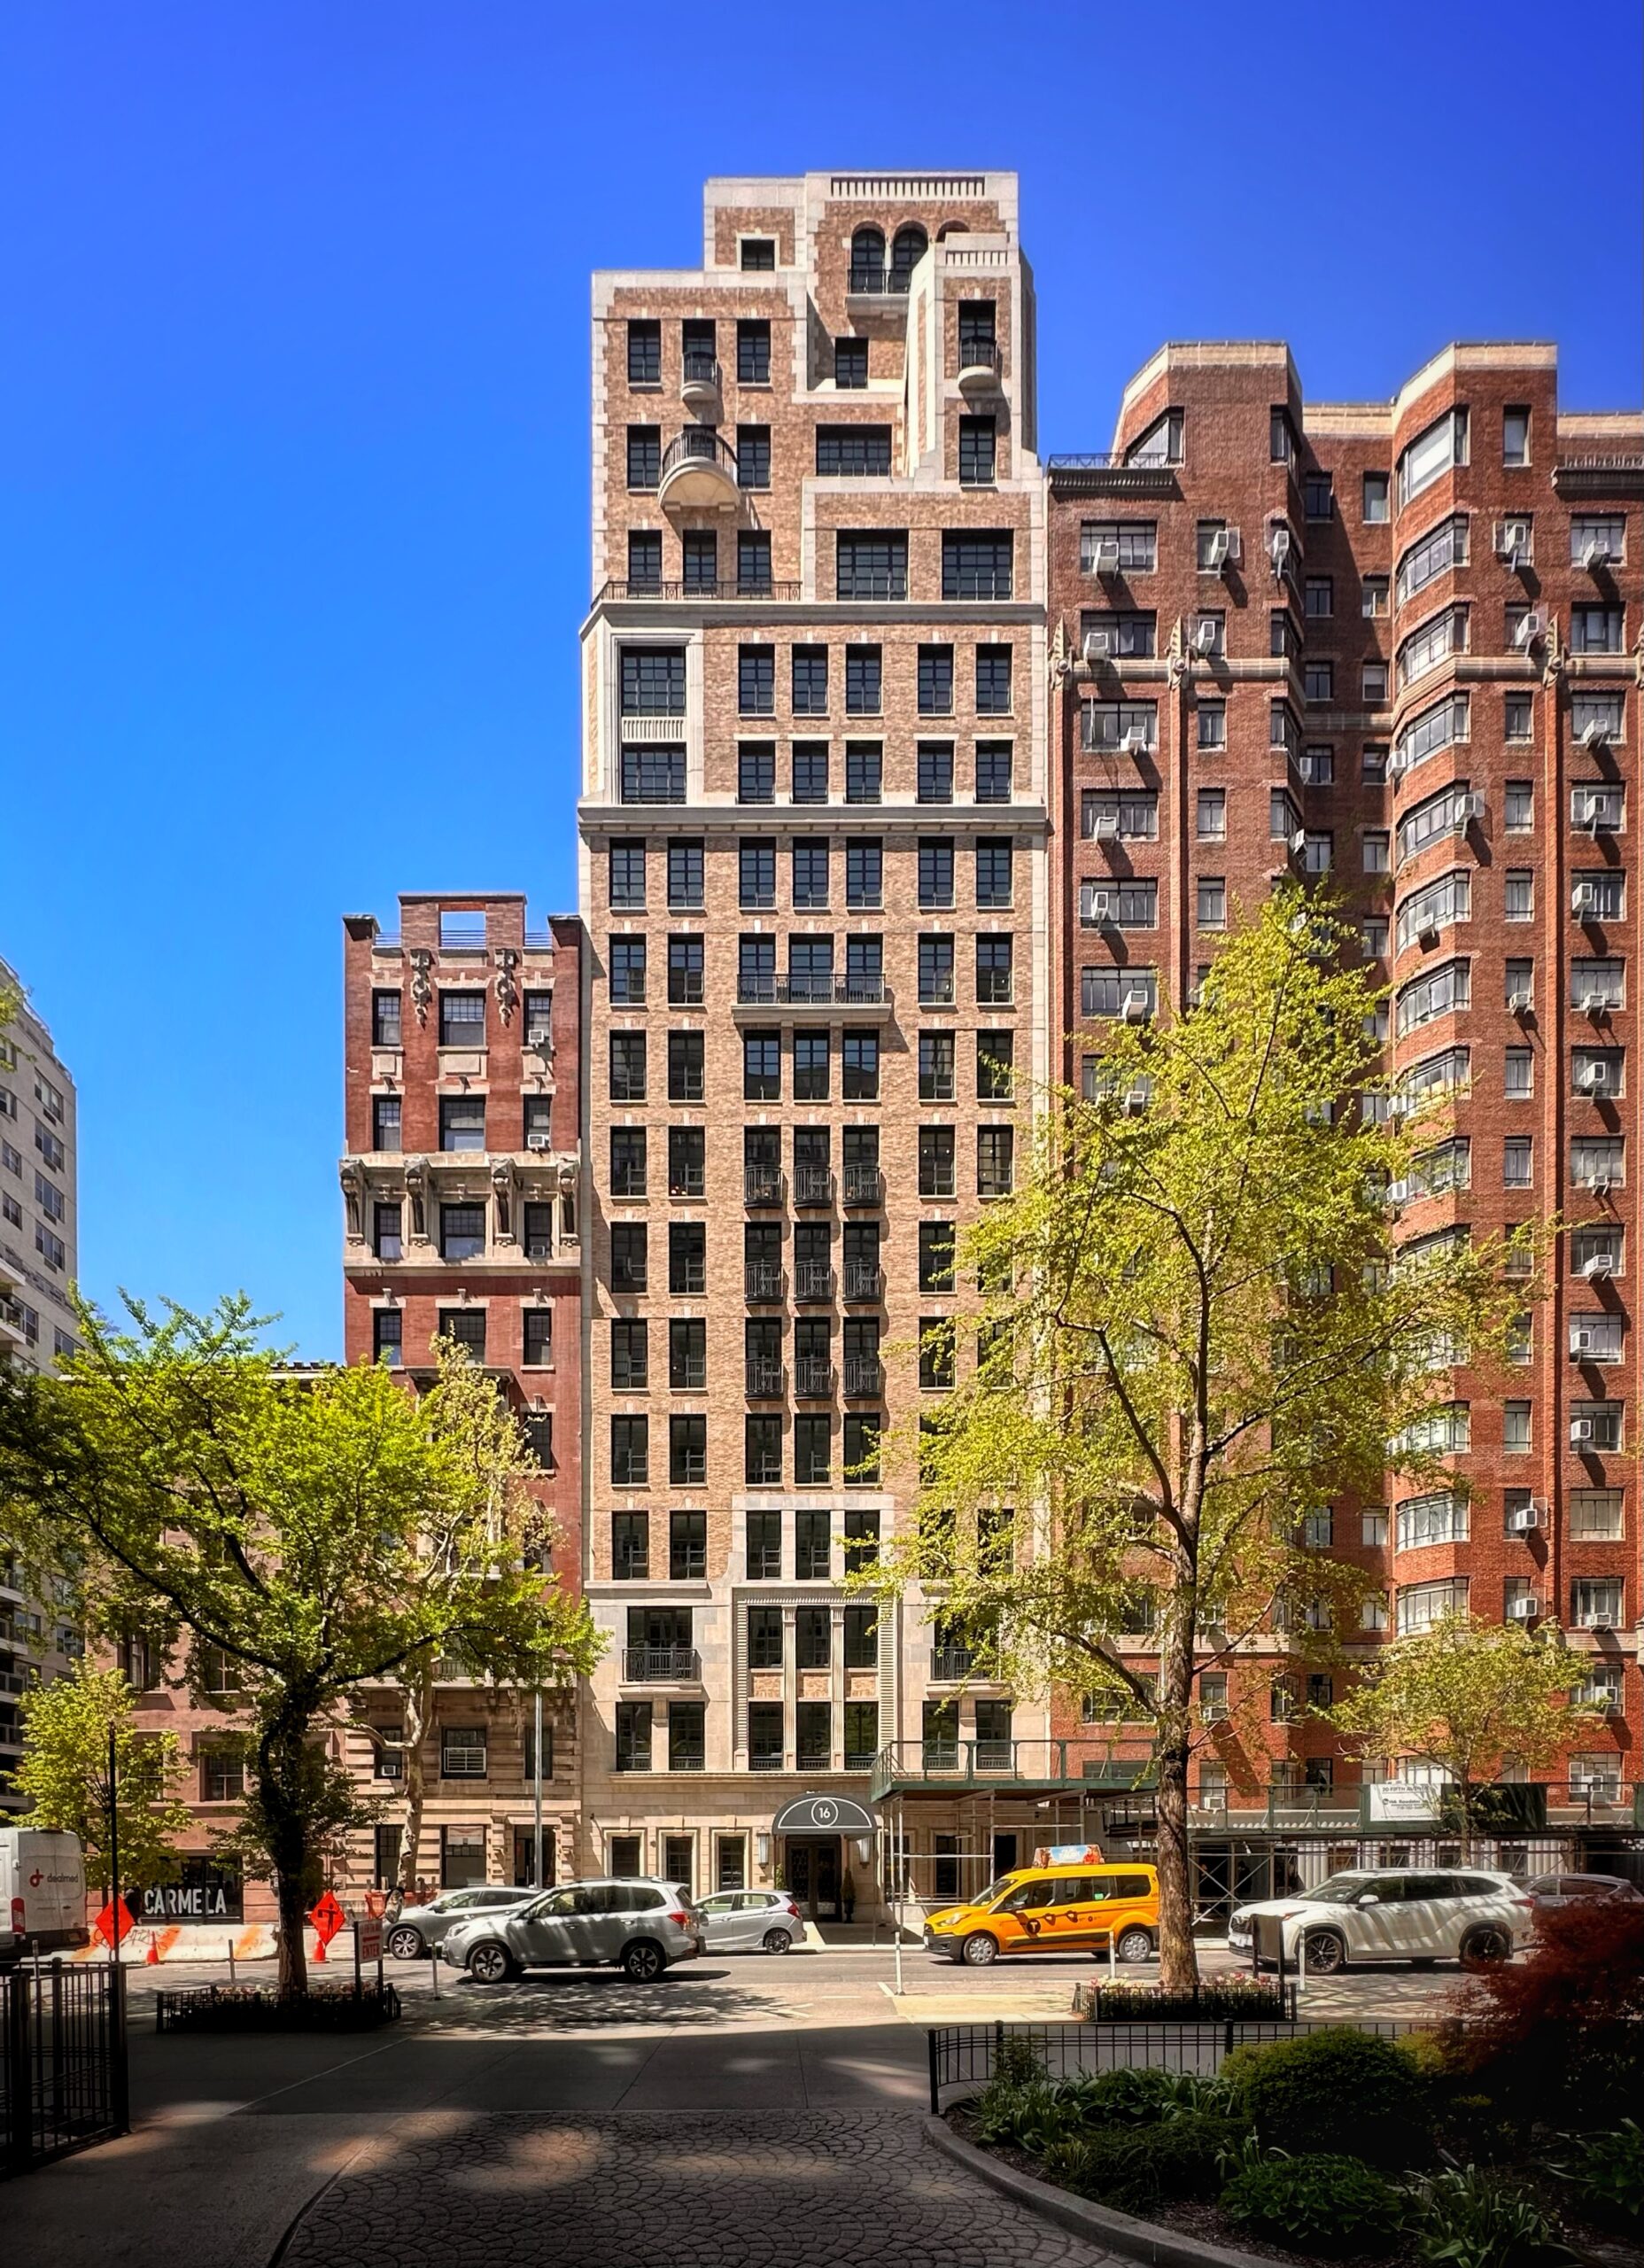
16 Fifth Avenue. Photo by Michael Young.
Permits listed by average unit count per filing
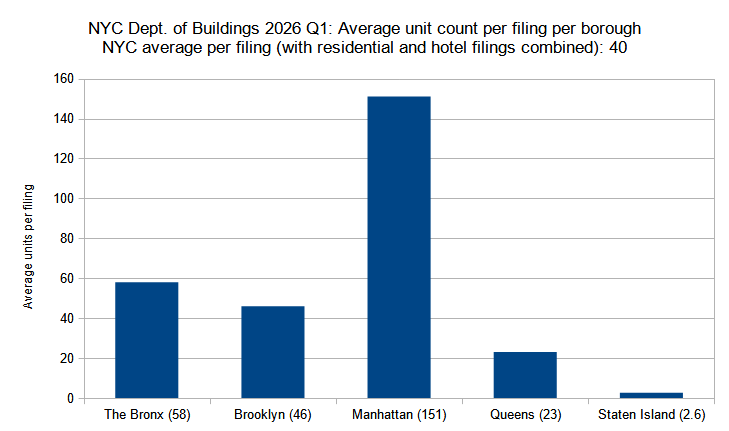
Average unit count (residential and hotel) per new construction permit per borough filed in New York City in the first quarter (Q1) of 2026. Data source: the Department of Buildings. Data aggregation and graphics credit: Vitali D. Ogorodnikov.
Below is a by-borough comparison to the previous year’s quarterly average:
- The Bronx – 29-percent increase (45 to 58 residential and hotel units)
- Brooklyn – 5-percent increase (44 to 46)
- Manhattan – 57-percent increase (96 to 151)
- Queens – 8-percent decrease (25 to 23)
- Staten Island – 16-percent decrease (3.1 to 2.6)
In the first quarter of 2026, average residential and hotel unit filing sizes rose slightly compared to quarterly averages from the previous year in four out of five boroughs, ranging from 5 percent in Brooklyn to 57 percent in Manhattan, with the latter further solidifying its lead versus its counterparts. The only dip was observed in Queens, albeit a slight one of 8 percent.
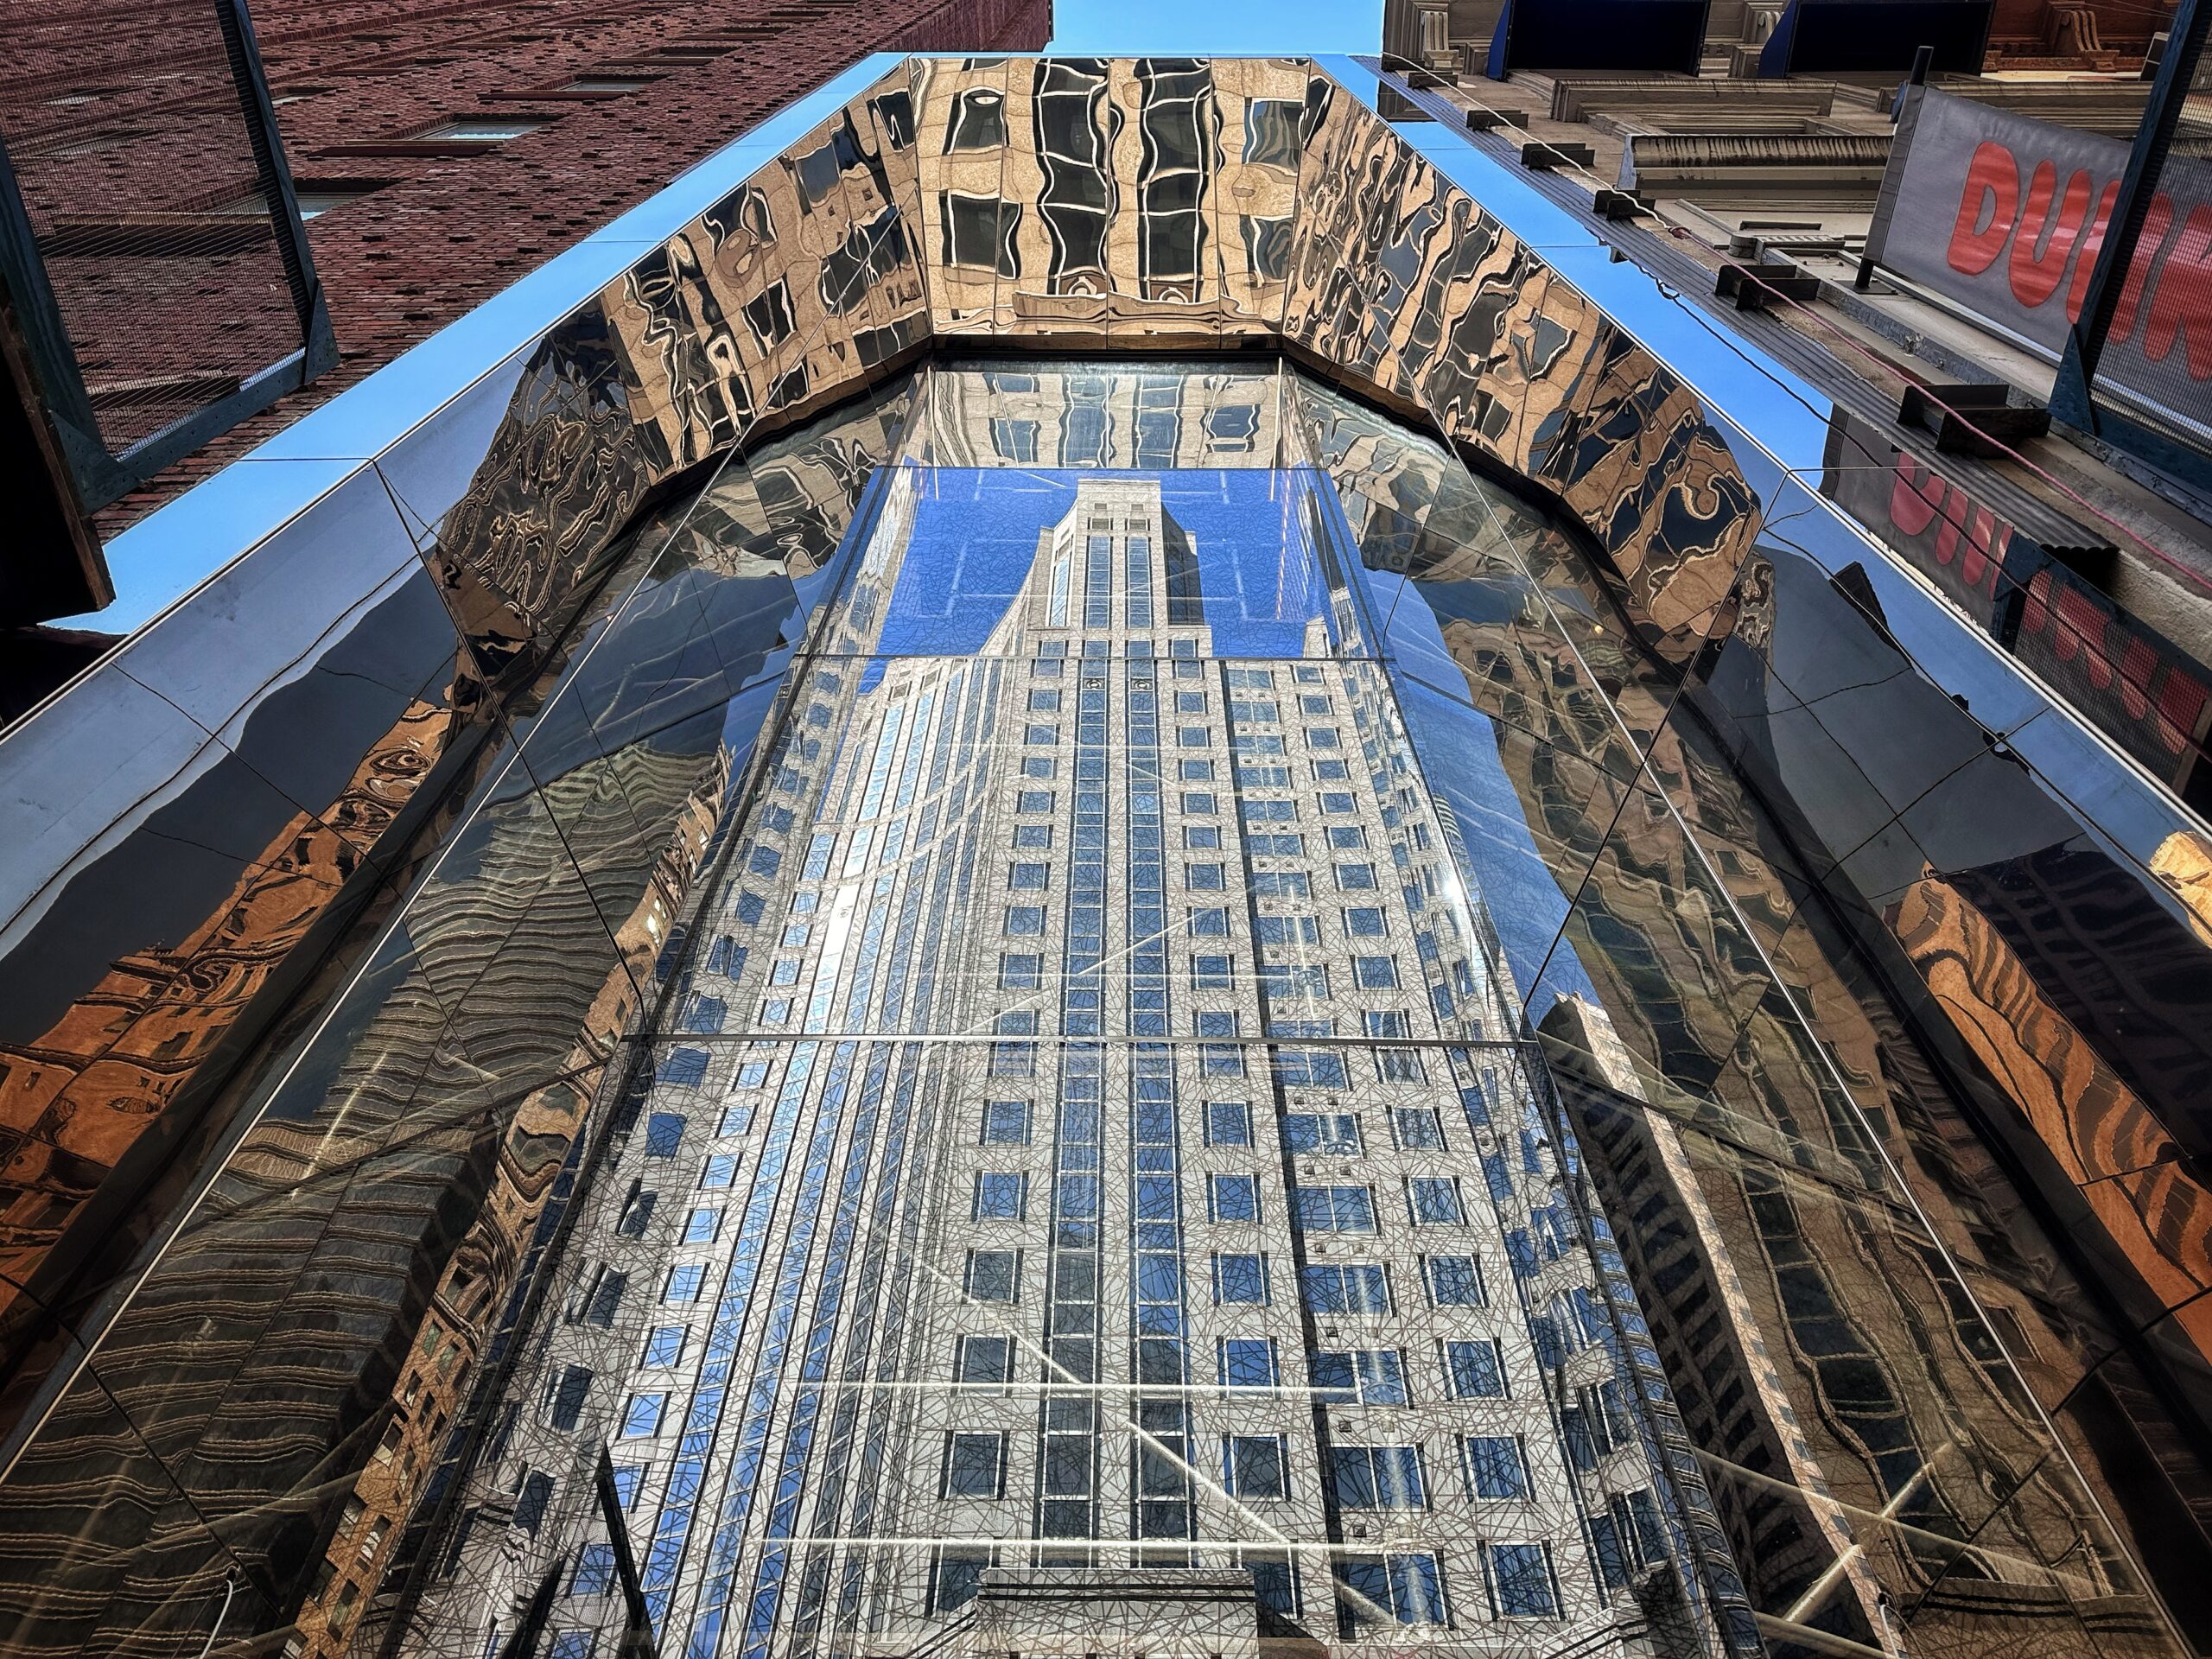
126 East 57th Street. Photo by Michael Young.
Permit filings by floor count category
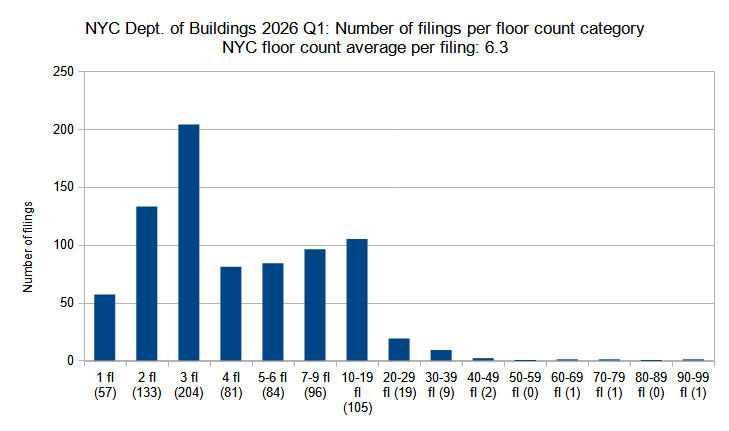
New construction permits filed in New York City in the first quarter (Q1) of 2026, grouped by floor count. Data source: the Department of Buildings. Data aggregation and graphics credit: Vitali D. Ogorodnikov.
New building permits filed for in just the first three months of 2026 were numerous enough to make a notable skyline impact on the nation’s largest megalopolis all on their own. The period registered a total of 105 filings for high-rise buildings ranging from ten to 19 floors, 30 towers ranging from 20 to 49 floors, and three skyscrapers (at least one supertall included, to rise at 175 Park Avenue in Midtown, Manhattan) in the 50 to 99-story range.
Below is a comparison per floor-count category to the previous year’s quarterly average:
- Single-story – 1-percent decrease (58 to 57 permits)
- Two-story – 63-percent increase (82 to 133)
- Three-story – 71-percent increase (119 to 204)
- Four-story – 28-percent increase (64 to 81)
- Five to six floors – 53-percent increase (55 to 84)
- Seven to nine floors – 77-percent increase (54 to 96)
- Ten to 19 floors – 116-percent increase (49 to 105)
- 20 to 29 floors – 124-percent increase (9 to 19)
- 30 to 39 floors – 177-percent increase (3 to 9)
- 40 to 49 floors – 1 to 2
- 50 to 59 floors – 1 to none
- 60 to 69 floors – 1 in both
- 70 to 79 floors – none to 1
- 80 to 89 floors – none in both
- 90 to 99 floors – none to 1
Below are the top ten (12 including tied positions) permit filings with the highest floor counts for the quarter:
- 175 Park Avenue in Midtown, Manhattan (95 floors, office)
- 548 West 36th Street in Hudson Yards, Manhattan (70 floors, 1,458 units)
- 495 Eleventh Avenue in Hudson Yards, Manhattan (60 floors, 1,023 units)
- 51 Willoughby Street in Downtown Brooklyn (43 floors, 295 units)
- 140 Fulton Street in Lower Manhattan (42 floors, 99 units)
- 484 Eighth Avenue in Midtown South, Manhattan (38 floors, 481 units)
- 18 India Street in Greenpoint, Brooklyn (37 floors, 834 units)
- 250 East 56th Street in Midtown East, Manhattan (36 floors, 141 units)
- (tie) 360 West Fordham Road in Fordham Heights, The Bronx (34 floors, 329 units)
- (tie) 80 Clarkson Street in West Village, Manhattan (34 floors, 129 units)
- (tie) 460 Tenth Avenue in Hudson Yards, Manhattan (34 floors, 456 units)
- (tie) 550 West 36th Street in Hudson Yards, Manhattan (34 floors, 300 units)
While the skyline-altering behemoth at 175 Park Avenue in Midtown is making headlines, the neighborhood primed for the greatest growth is Hudson Yards, which tallied four entries on the top-ten-plus list. In all, Manhattan dominates the list, with only two entries to be found in Brooklyn, one in The Bronx, and none in Queens or Staten Island.
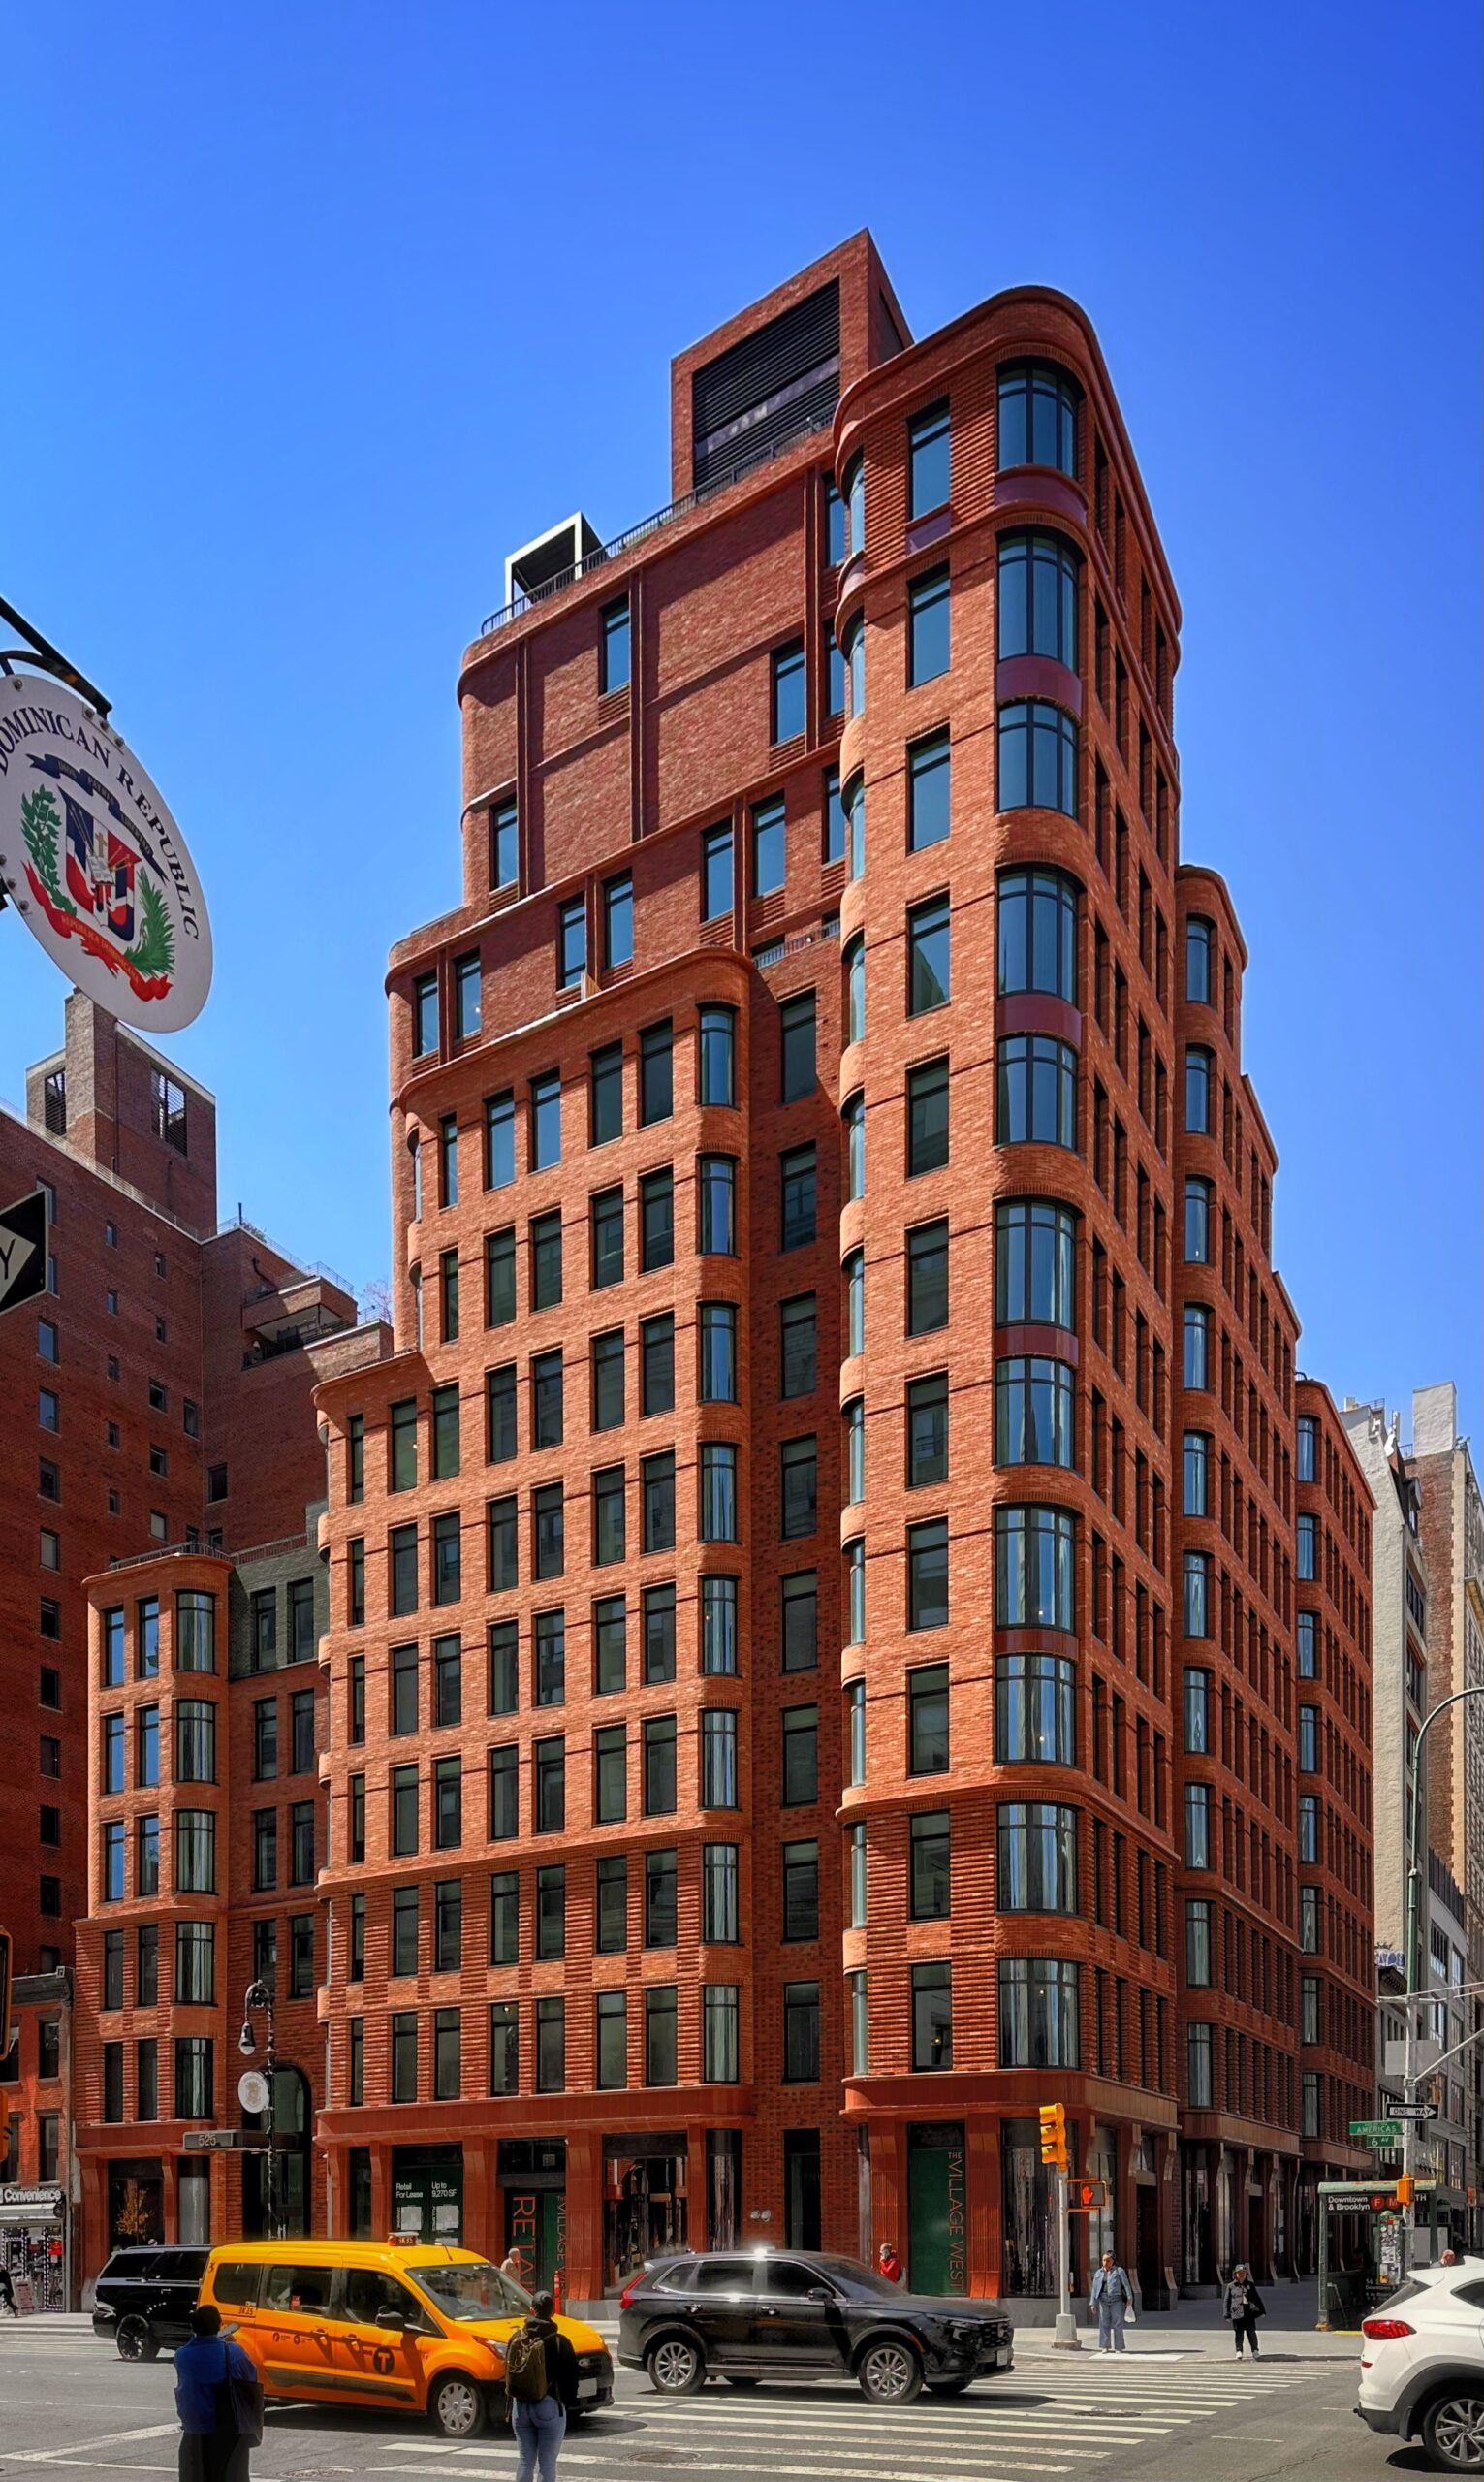
The Village West. Photo by Michael Young.
Average number of floors per filing per borough
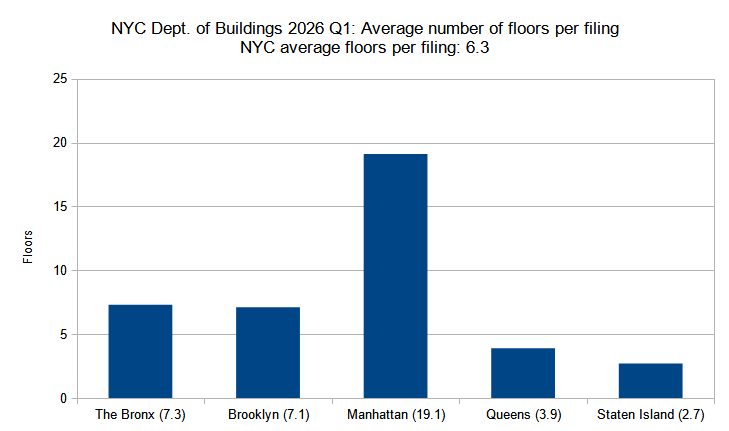
Average number of floors per new construction permit per borough filed in New York City in the first quarter (Q1) of 2026. Data source: the Department of Buildings. Data aggregation and graphics credit: Vitali D. Ogorodnikov.
Compared to the average quarter in 2025, new building permit filings in this year’s first quarter were not only more numerous but also for taller structures, with the average permit filing floor count rising from 5.3 to 6.3. Each borough registered an increase in the average permit filing floor count, from 0.1 in predominantly low-rise Staten Island, which rose from 2.6 to 2.7 floors, to 4.6 floors in Manhattan, where total increased from 14.5 stories to the somewhat skyline-notable figure of 19.1.
Below is the by-borough comparison between the two quarters:
- The Bronx – 14-percent increase (6.4 to 7.3 floors)
- Brooklyn – 16-percent increase (6.1 to 7.1)
- Manhattan – 32-percent increase (14.5 to 19.1)
- Queens – 3-percent increase (3.8 to 3.9)
- Staten Island – 4-percent increase (2.6 to 2.7)
The following are the permit filings in each borough with the highest floor counts:
- The Bronx – 360 West Fordham Road in Fordham Heights (34 floors)
- Brooklyn – 51 Willoughby Street in Downtown Brooklyn (43 floors)
- Manhattan – 175 Park Avenue in Midtown, Manhattan (95 floors)
- Queens – 24-01 Queens Plaza North in Long Island City (19 floors)
- Staten Island – 30 Sands Street in Stapleton Heights (7 floors)
In nearly every borough, the highest floor-count proposed buildings are situated in or near their respective borough’s skyline cores. The notable exception is found at 360 West Fordham Road, where a 34-story tower will rise in the centrally sited business hub of Fordham Heights.
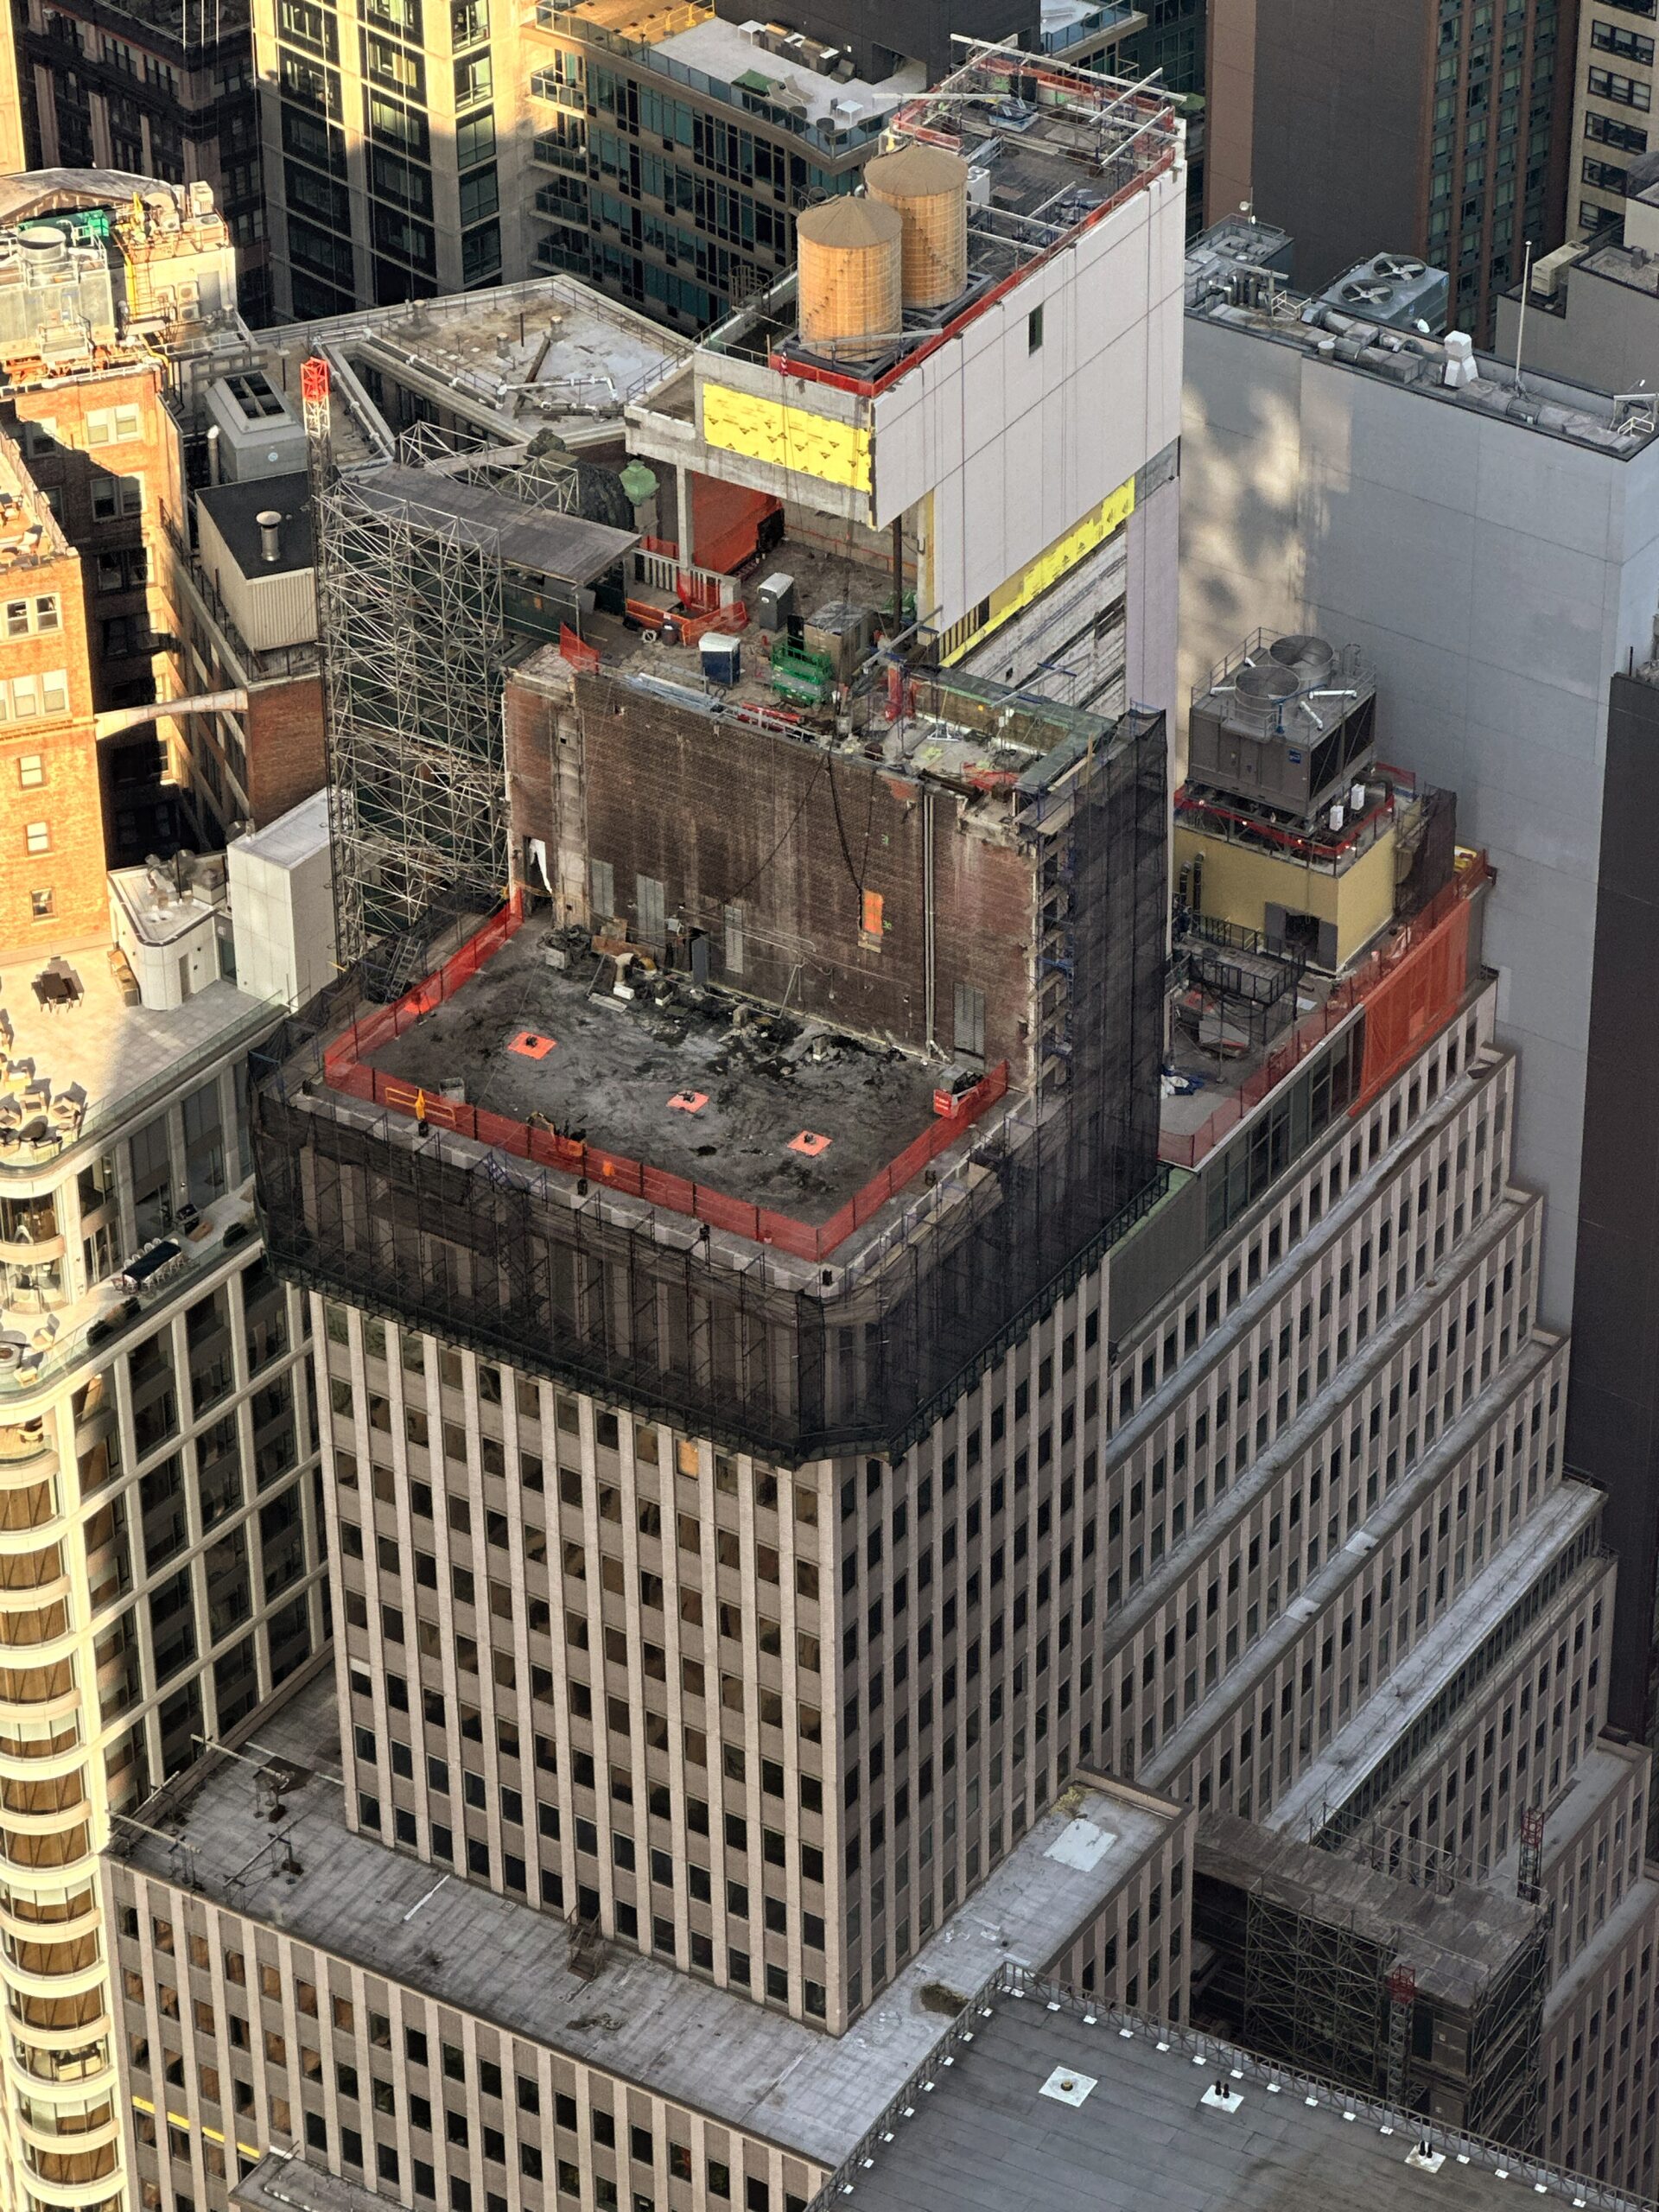
222 Broadway. Photo by Michael Young.
Permits listed by floor area per filing
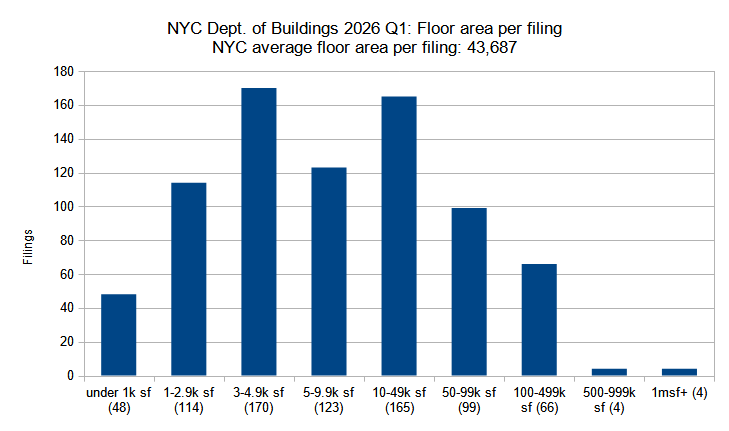
New construction permits filed in New York City in the first quarter (Q1) of 2026, grouped by total floor area. Data source: the Department of Buildings. Data aggregation and graphics credit: Vitali D. Ogorodnikov.
Given the general surge of new building permit filings in the first quarter of 2026 compared to quarterly averages for the previous year, concurrent increases in permit tallies in each floor area size category are expected, yet still very encouraging to see. Below is a breakdown by floor area category compared to the previous year’s quarterly averages:
- Under 1,000 square feet – 4-percent increase (46 to 48 permits)
- 1,000 to 2,999 SF – 131-percent increase (49 to 114)
- 3,000 to 4,999 SF – 35-percent increase (126 to 170)
- 5,000 to 9,999 SF – 71-percent increase (72 to 123)
- 10,000 to 49,999 SF – 47-percent increase (113 to 165)
- 50,000 to 99,999 SF – 93-percent increase (51 to 99)
- 100,000 to 499,999 SF – 100-percent increase (33 to 66)
- 500,000 to 999,999 SF – 100-percent increase (2 to 4)
- 1,000,000 SF and above – 433-percent increase (0.8 to 4)
During the first three months of this year, almost every single category registered double- to triple-digit percentage increases compared to the previous year’s averages. The only exception is the relatively small, 4-percent increase for new building permit filings for structures spanning under 1,000 square feet (primarily comprised of single-car garages), indicating that developers are seeing greater incentives in larger proposals even in the city’s outlying neighborhoods.
Below are the top ten permits with the largest floor area filed for in the first quarter of 2026, listed in order:
- 175 Park Avenue in Midtown, Manhattan (3,019,530 square feet)
- 548 West 36th Street in Hudson Yards, Manhattan (1,361,540 SF)
- 80-45 126th Street in Kew Gardens, Queens (1,107,720 SF)
- 6202 8th Avenue in Sunset Park, Brooklyn (1,048,610 SF)
- 18 India Street in Greenpoint, Brooklyn (788,929 SF)
- 495 Eleventh Avenue in Hudson Yards, Manhattan (774,590 SF)
- 80 Clarkson Street in West Village, Manhattan (679,952 SF)
- 407 West 206th Street in Inwood, Manhattan (537,702 SF)
- 2560 Boston Road in Allerton, The Bronx (470,705 SF)
- 484 Eighth Avenue in Midtown South, Manhattan (409,234 SF)
As expected, most of the largest floor area proposals on the top ten list are situated in Manhattan. A notable entrant sits at number three on the list, where the so-called Queens Facility at 80-45 126th Street in Kew Gardens is one of the five borough jails planned to replace the Rikers Island Complex.
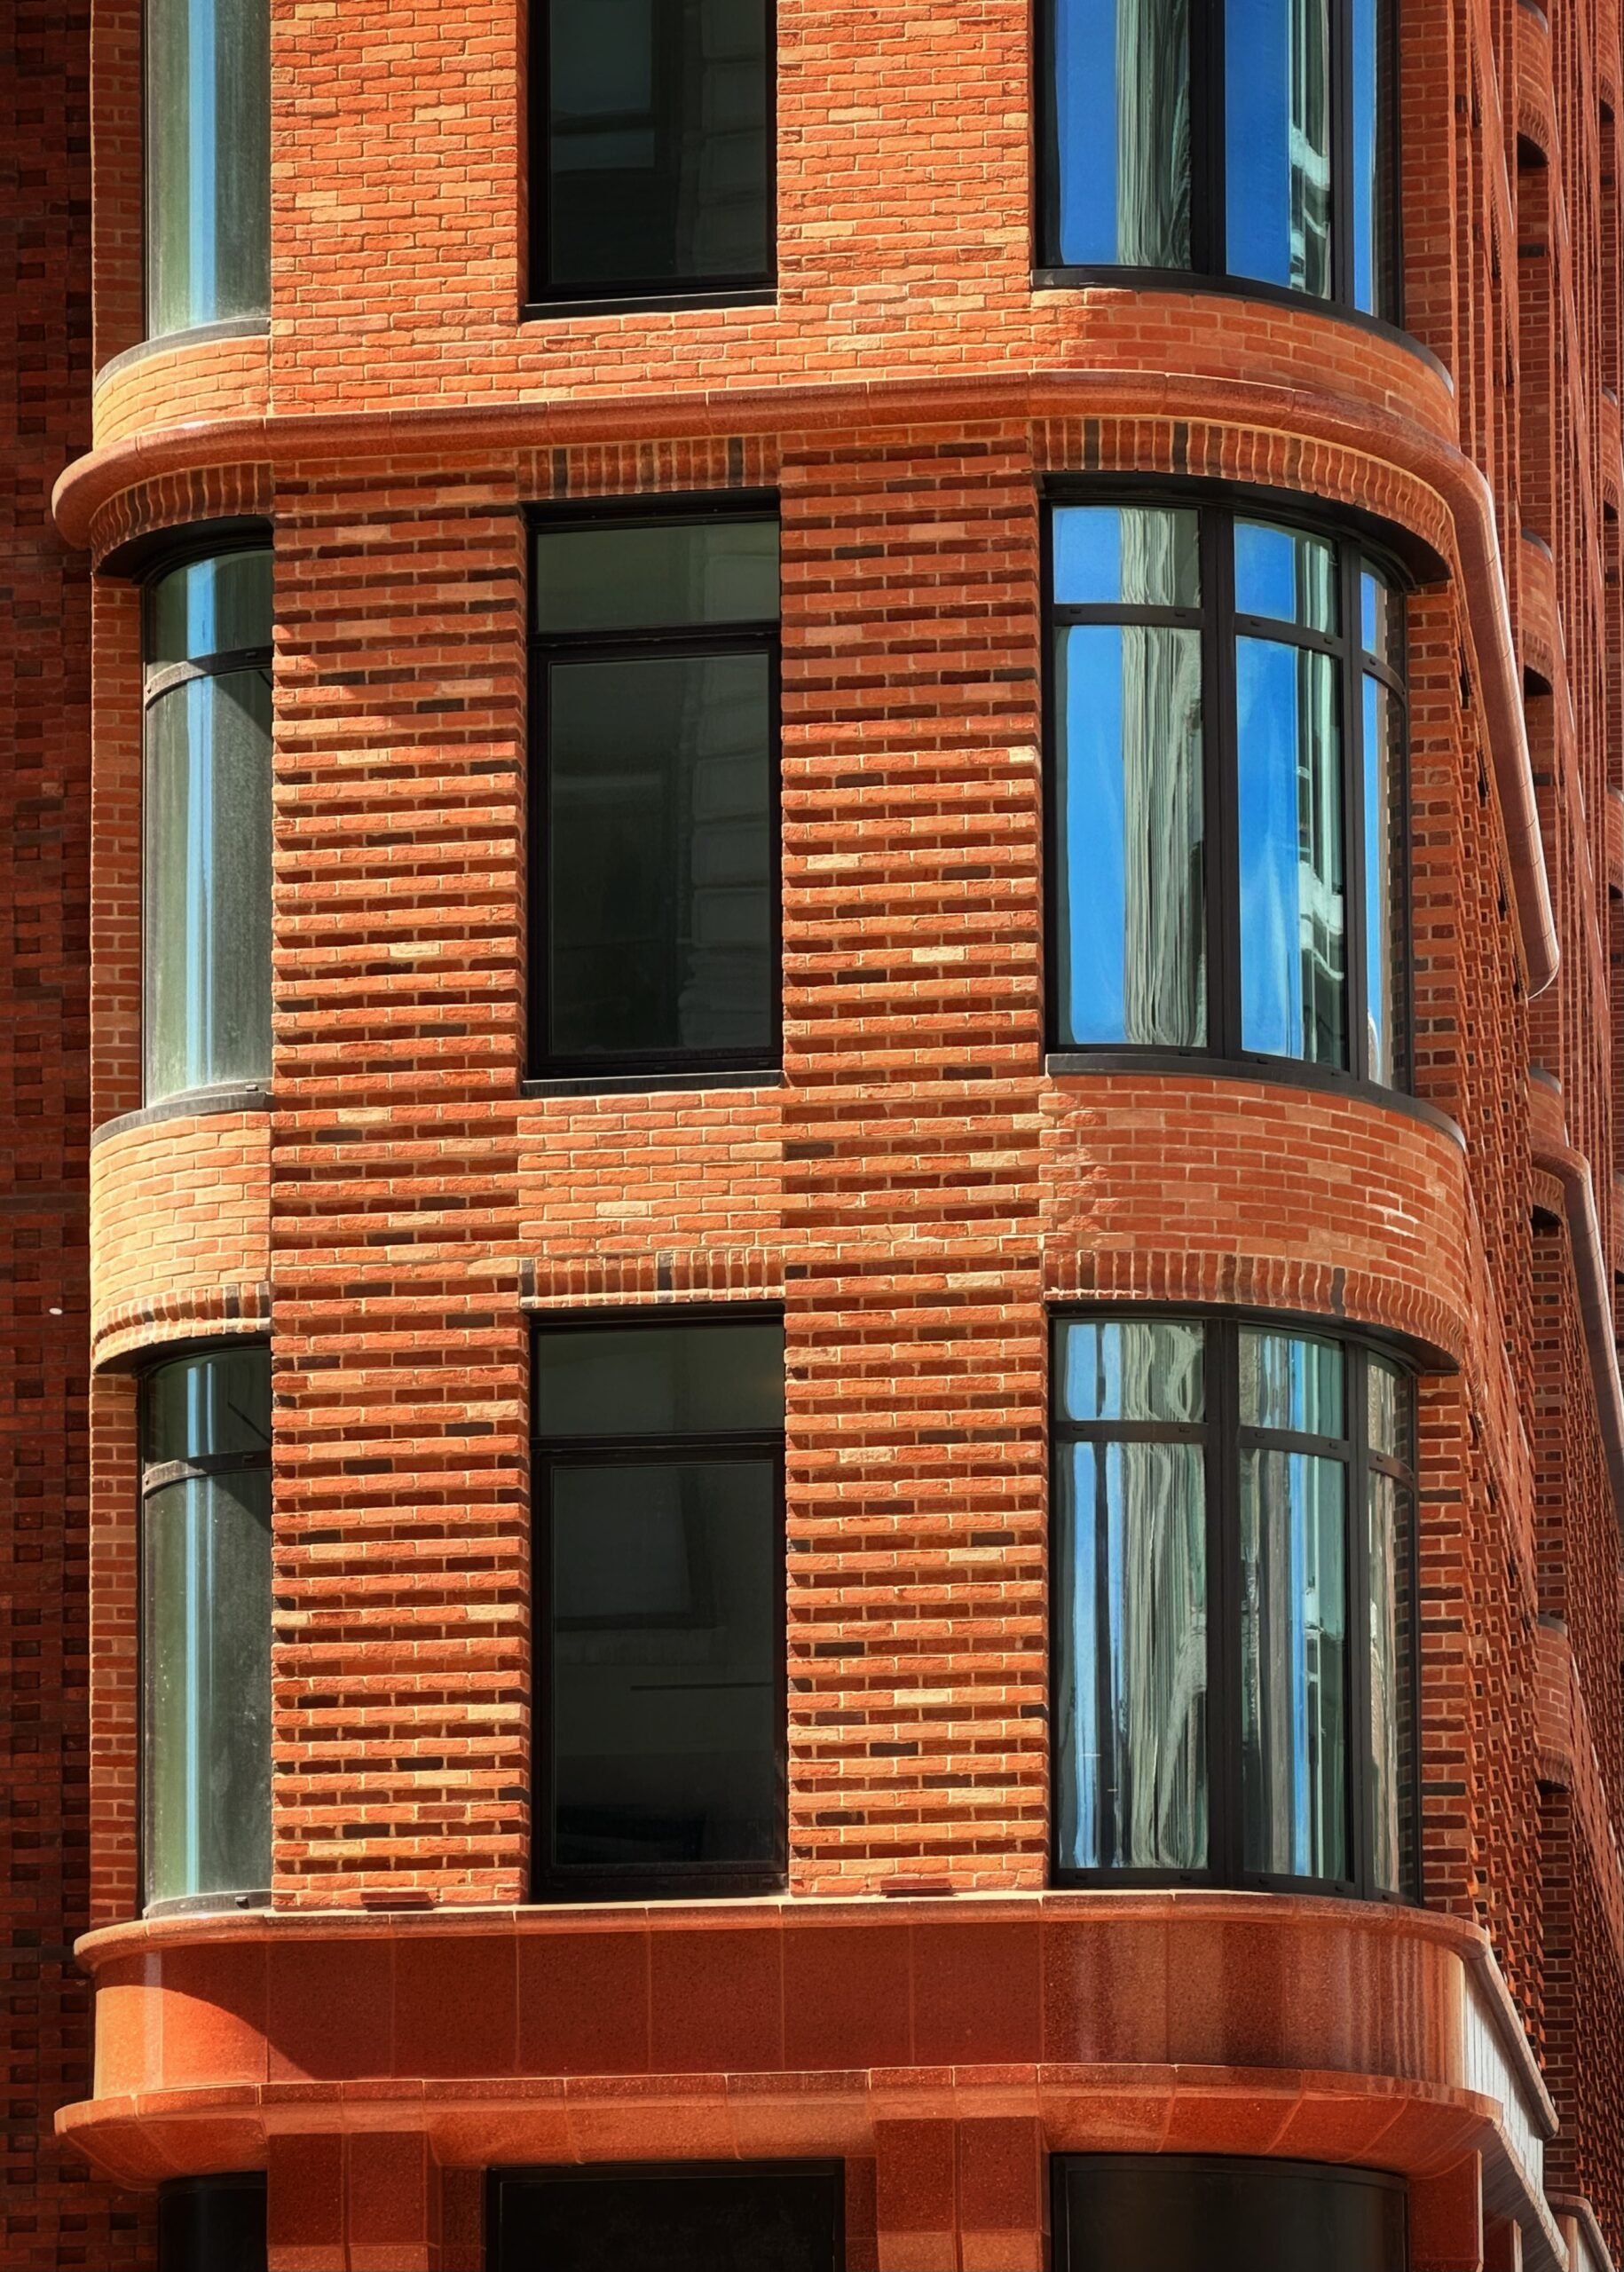
The Village West. Photo by Michael Young.
Total floor area filed by borough
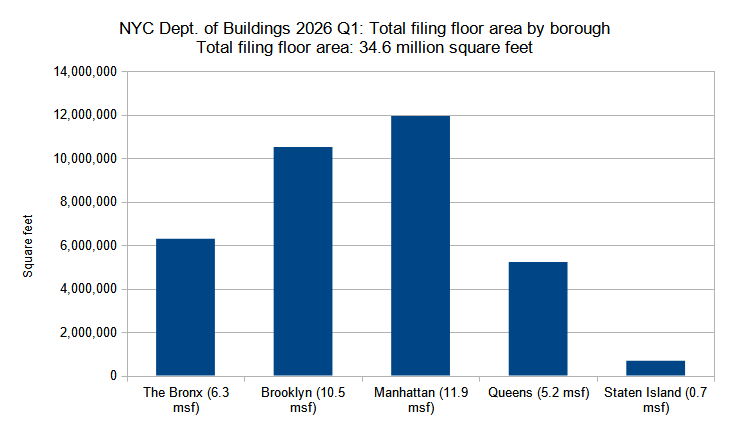
Combined floor area of new construction permits filed per borough in New York City in the first quarter (Q1) of 2026. Data source: the Department of Buildings. Data aggregation and graphics credit: Vitali D. Ogorodnikov.
Each borough in the first quarter of 2026 saw increases in total filed-for permit square footage compared to last year, with the greatest relative increase observed in Manhattan. Below are the square footage totals per borough compared to the previous year’s quarterly average:
- The Bronx – 89-percent increase (3,326,839 to 6,292,224 square feet)
- Brooklyn – 87-percent increase (5,609,264 to 10,509,767 SF)
- Manhattan – 232-percent increase (3,592,286 to 11,940,179 SF)
- Queens – 32-percent increase (3,943,189 to 5,219,566 SF)
- Staten Island – 66-percent increase (410,589 to 681,820 SF)
The following are the permit filings in each borough with the largest floor area:
- The Bronx – 2560 Boston Road in Allerton (470,705 square feet)
- Brooklyn – 6202 8th Avenue in Sunset Park (1,048,610 SF)
- Manhattan – 175 Park Avenue in Midtown, Manhattan (3,019,530 SF)
- Queens – 80-45 126th Street in Kew Gardens (1,107,720 SF)
- Staten Island – 930 A West Fingerboard Road in Grasmere (46,583 SF)
Each entry among the borough’s largest floor area permit filings for Q1 2026 presents something of note. The 470,705-square-foot proposal at 2560 Boston Road in The Bronx will rise in the borough’s somewhat remote Allerton neighborhood, while Brooklyn’s 6202 8th Avenue will go up in geographically south-central Sunset Park, and the borough jail in Queens at 80-45 126th Street will rise in similarly centrally sited Kew Gardens.
Following the trend is the comparatively modest, 46,583-square-foot proposal at Staten Island’s centrally positioned Grasmere, an area from which we do not typically hear much construction news. Midtown’s obviously central location is suggested by the district’s very name, where the 3,019,530-square-foot supertall proposal is not only the quarter’s largest by floor area, but also boasts the highest floor count of 95.
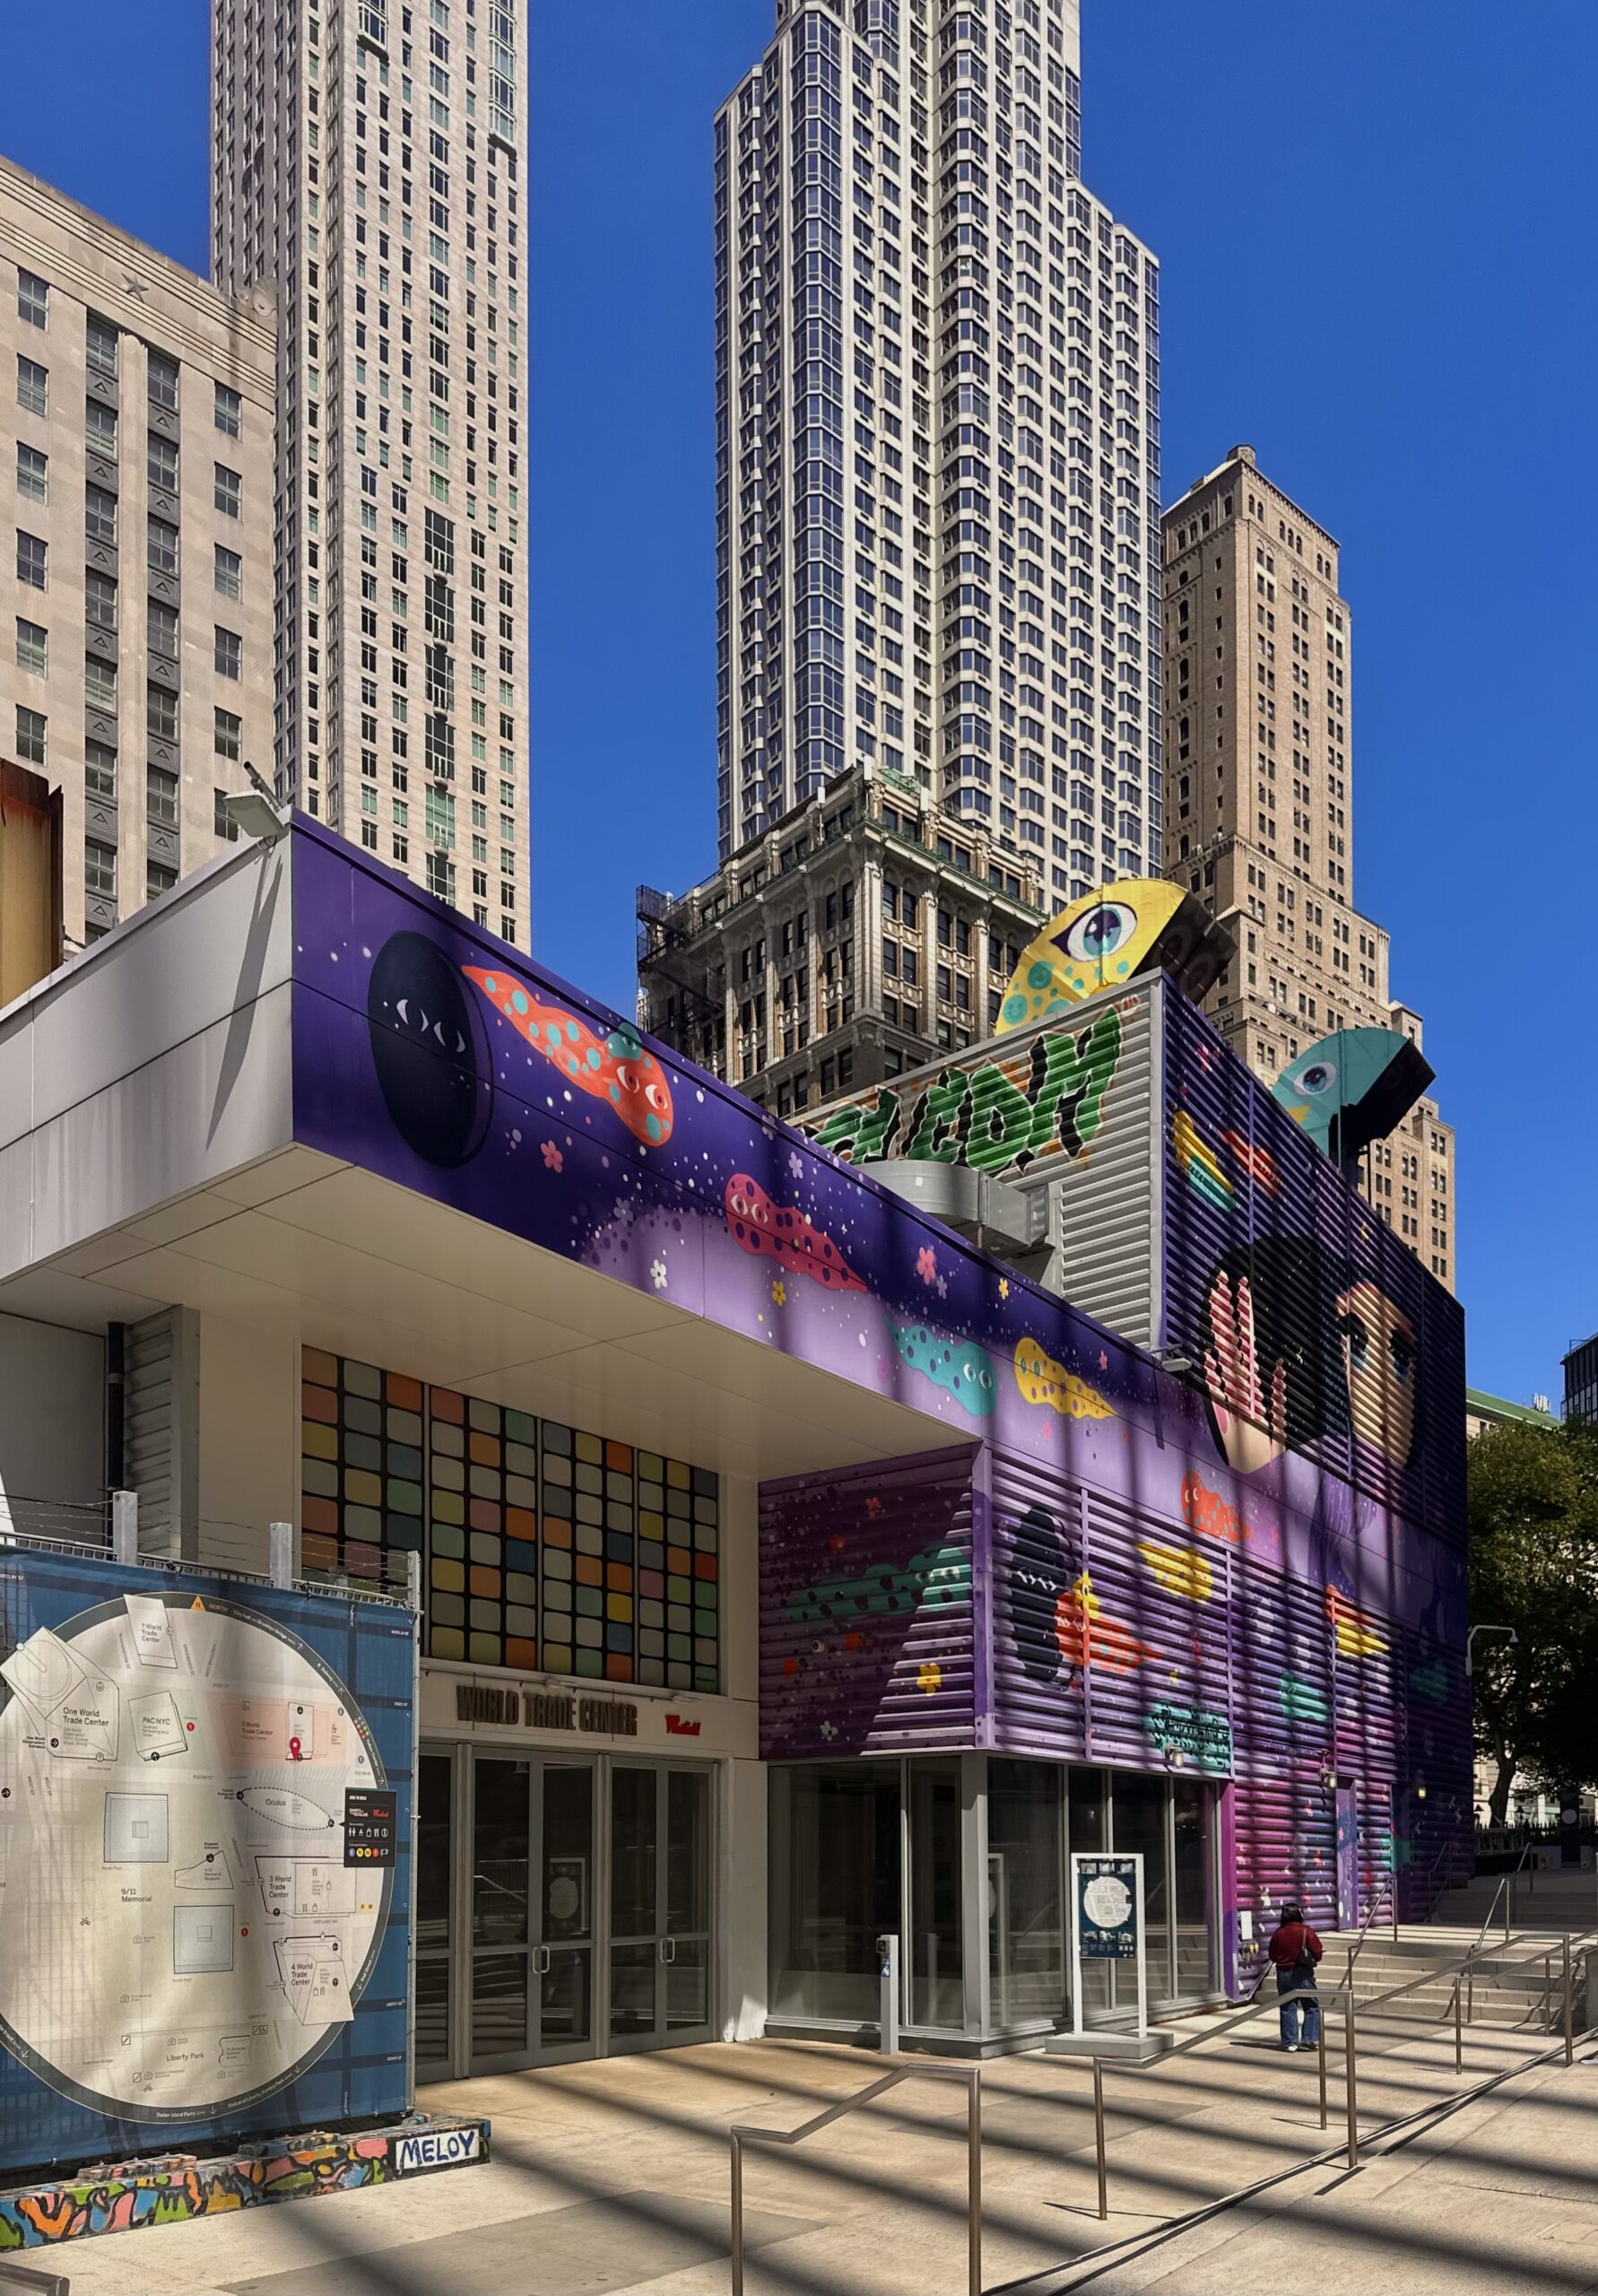
2 World Trade Center. Photo by Michael Young.
Average floor area per permit filing by borough
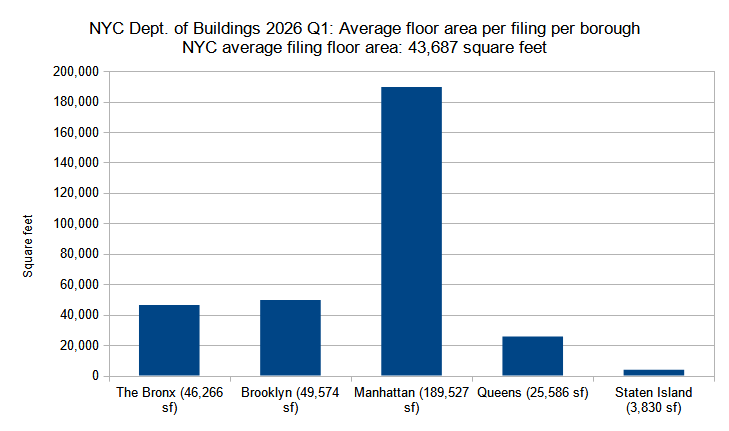
Average floor area per new construction permit per borough filed in New York City in the first quarter (Q1) of 2026. Data source: the Department of Buildings. Data aggregation and graphics credit: Vitali Ogorodnikov
Compared to the average quarter of 2025, the first quarter of 2026 noted average size increases per typical filing in almost every borough, ranging from a 10-percent increase in Queens to 42-percent growth in Manhattan, which places the borough even further ahead of its counterparts. Below is the quarterly comparison for the boroughs for average floor area per permit filings, compared to the quarterly average from the previous year:
- The Bronx – 21-percent increase (38,240 to 46,266 square feet)
- Brooklyn – 13-percent increase (43,737 to 49,574 SF)
- Manhattan – 42-percent increase (133,048 to 189,527 SF)
- Queens – 10-percent increase (23,195 to 25,586 SF)
- Staten Island – 25-percent decrease (5,084 to 3,830 SF)
The 189,527-square-foot total in Manhattan reflects that the typical filing is skyscraper-sized, while the 49,574- and 46,266-square-foot averages in Brooklyn and The Bronx, respectively, are approximately equivalent to 40- to 50-unit apartment buildings. The average filing size in more sprawling Queens is about half as large, at 25,586 square feet. Rounding off the group is Staten Island, the only borough to show an average filing size decrease, where the 3,830 indicates that most of the verdant borough’s construction remains almost exclusively low-rise and single-family in nature.
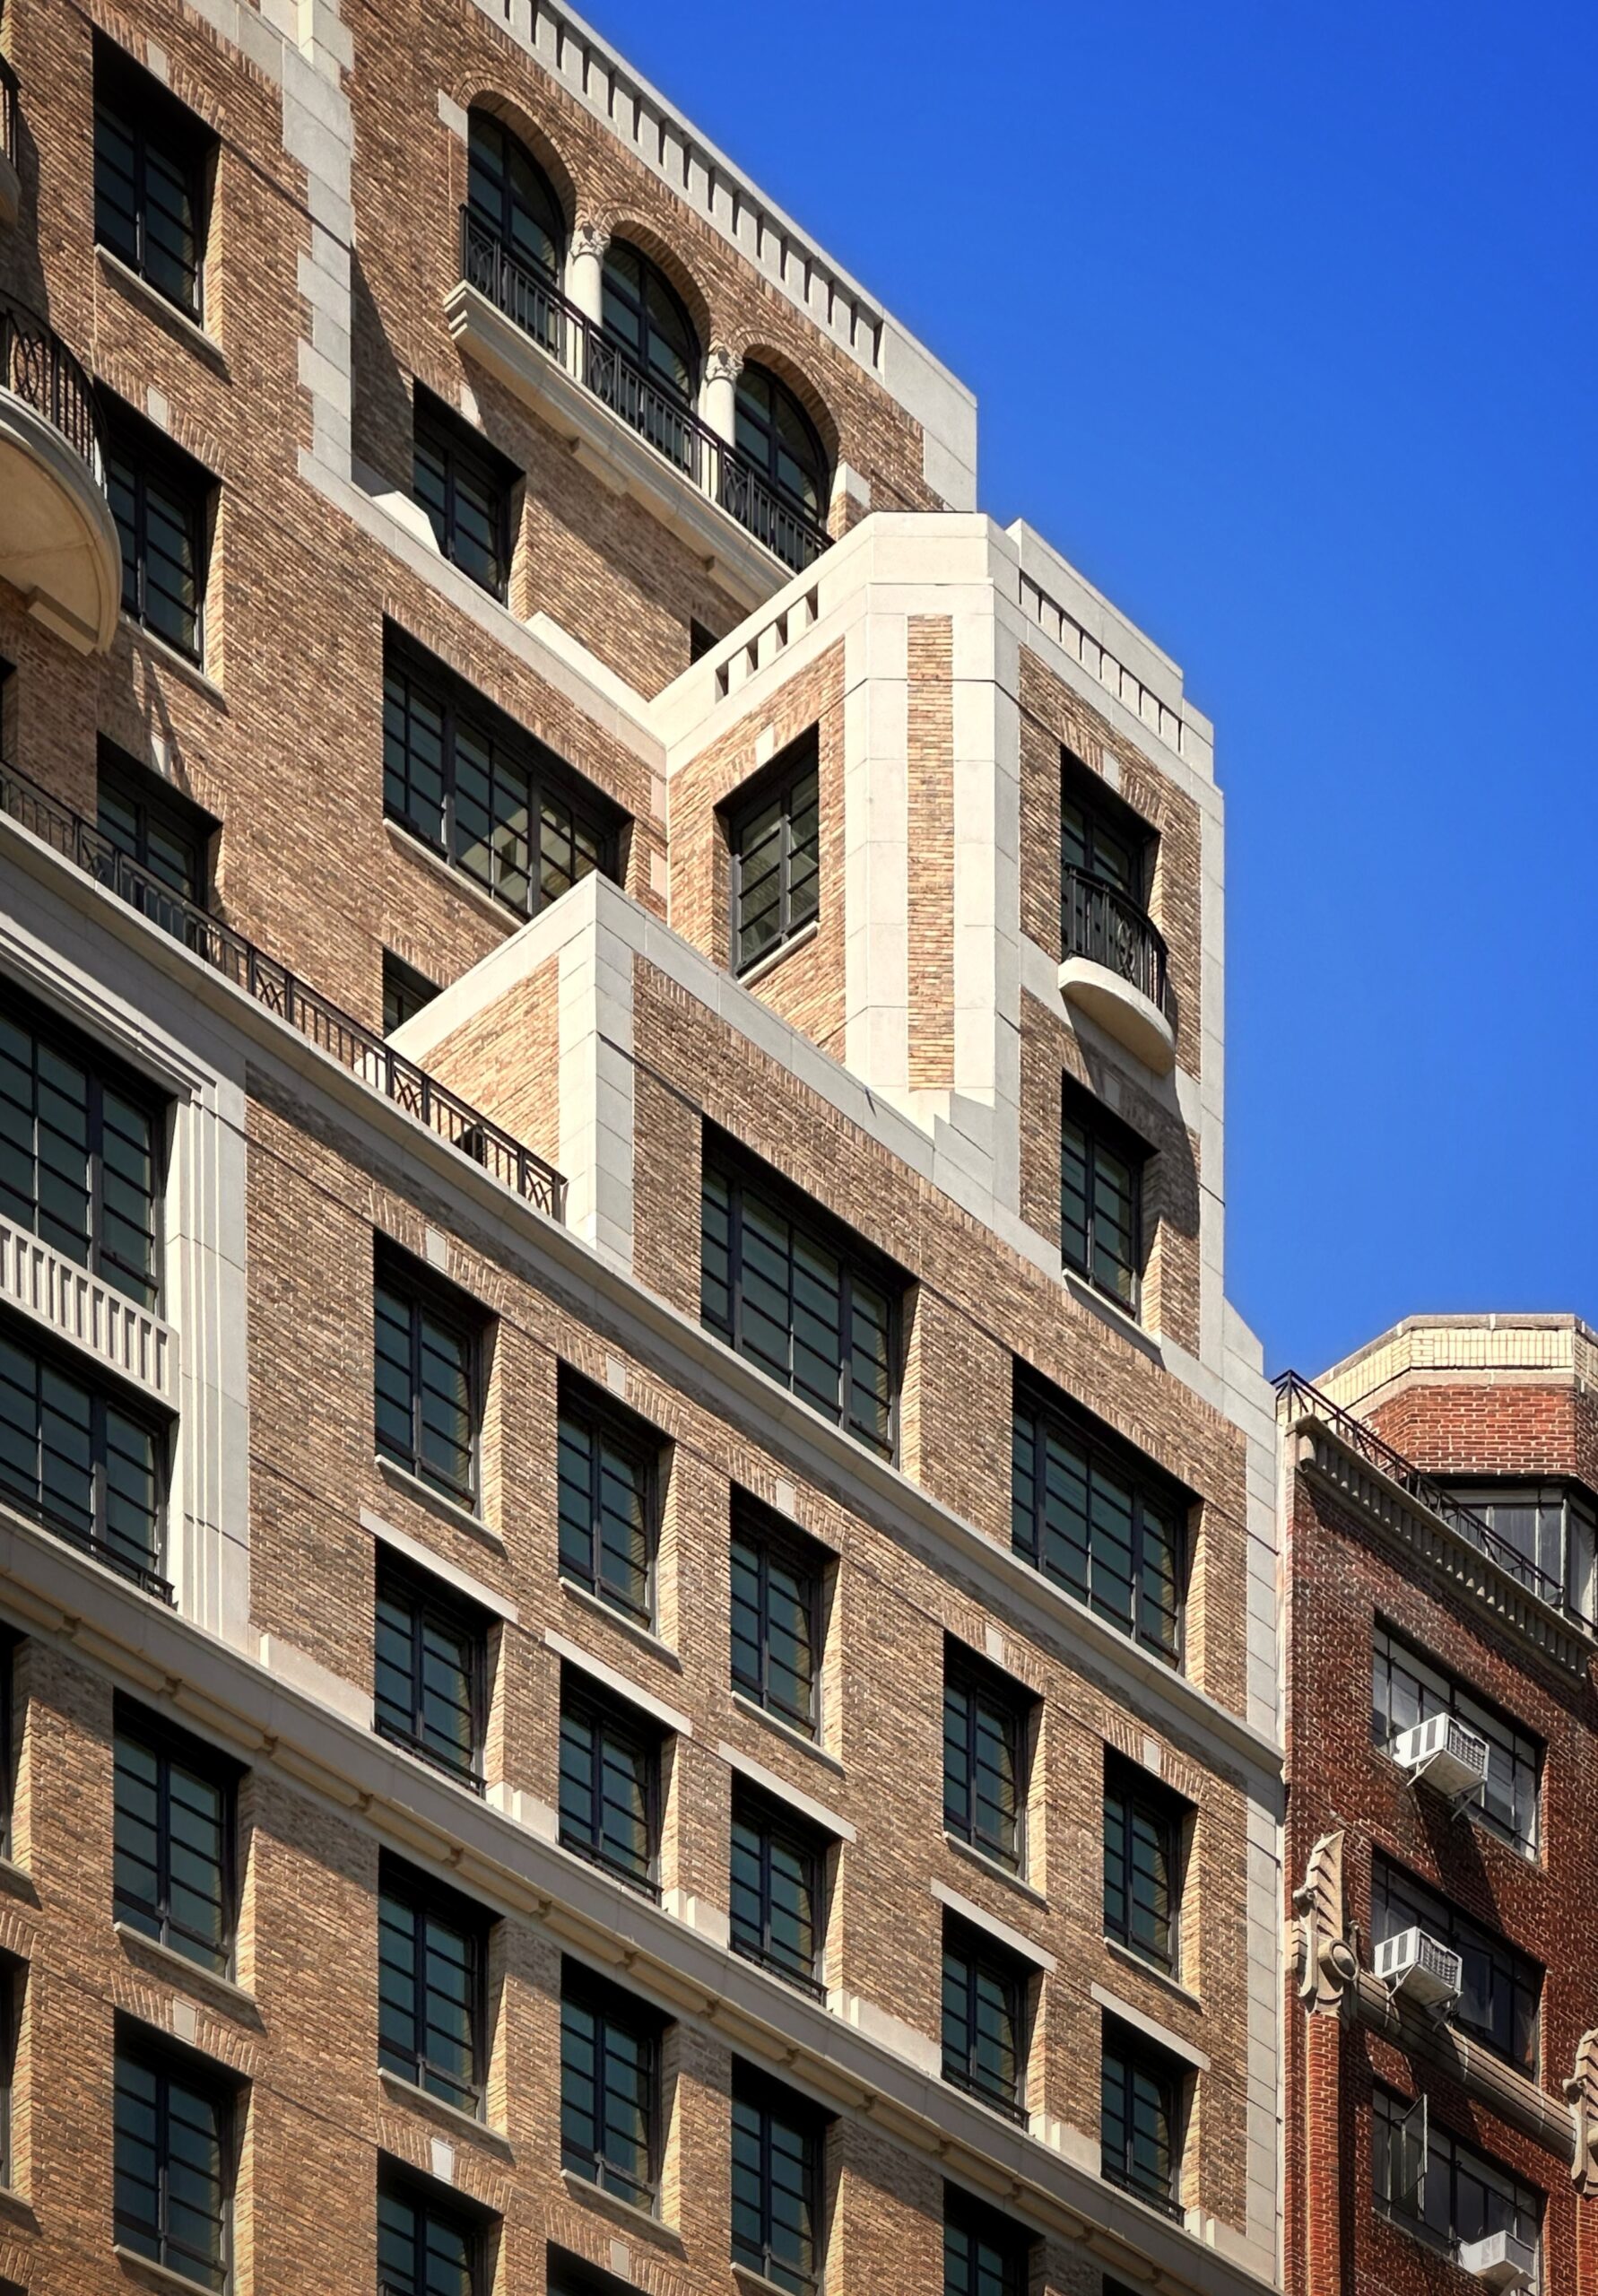
16 Fifth Avenue. Photo by Michael Young.
Permit filing figures for the first quarter of 2026 have shown an impressive increase compared to the previous year. Given a long-overdue yet much-welcome surging political and popular will for upzoning and new housing construction throughout the city, the state, and the country, we expect more good news to come in the form of new development proposals, followed by new schools, parks, transit lines, jobs, families, and new bright futures across the board. Keep looking up, New Yorkers, and keep saying Yes In My Back Yard!
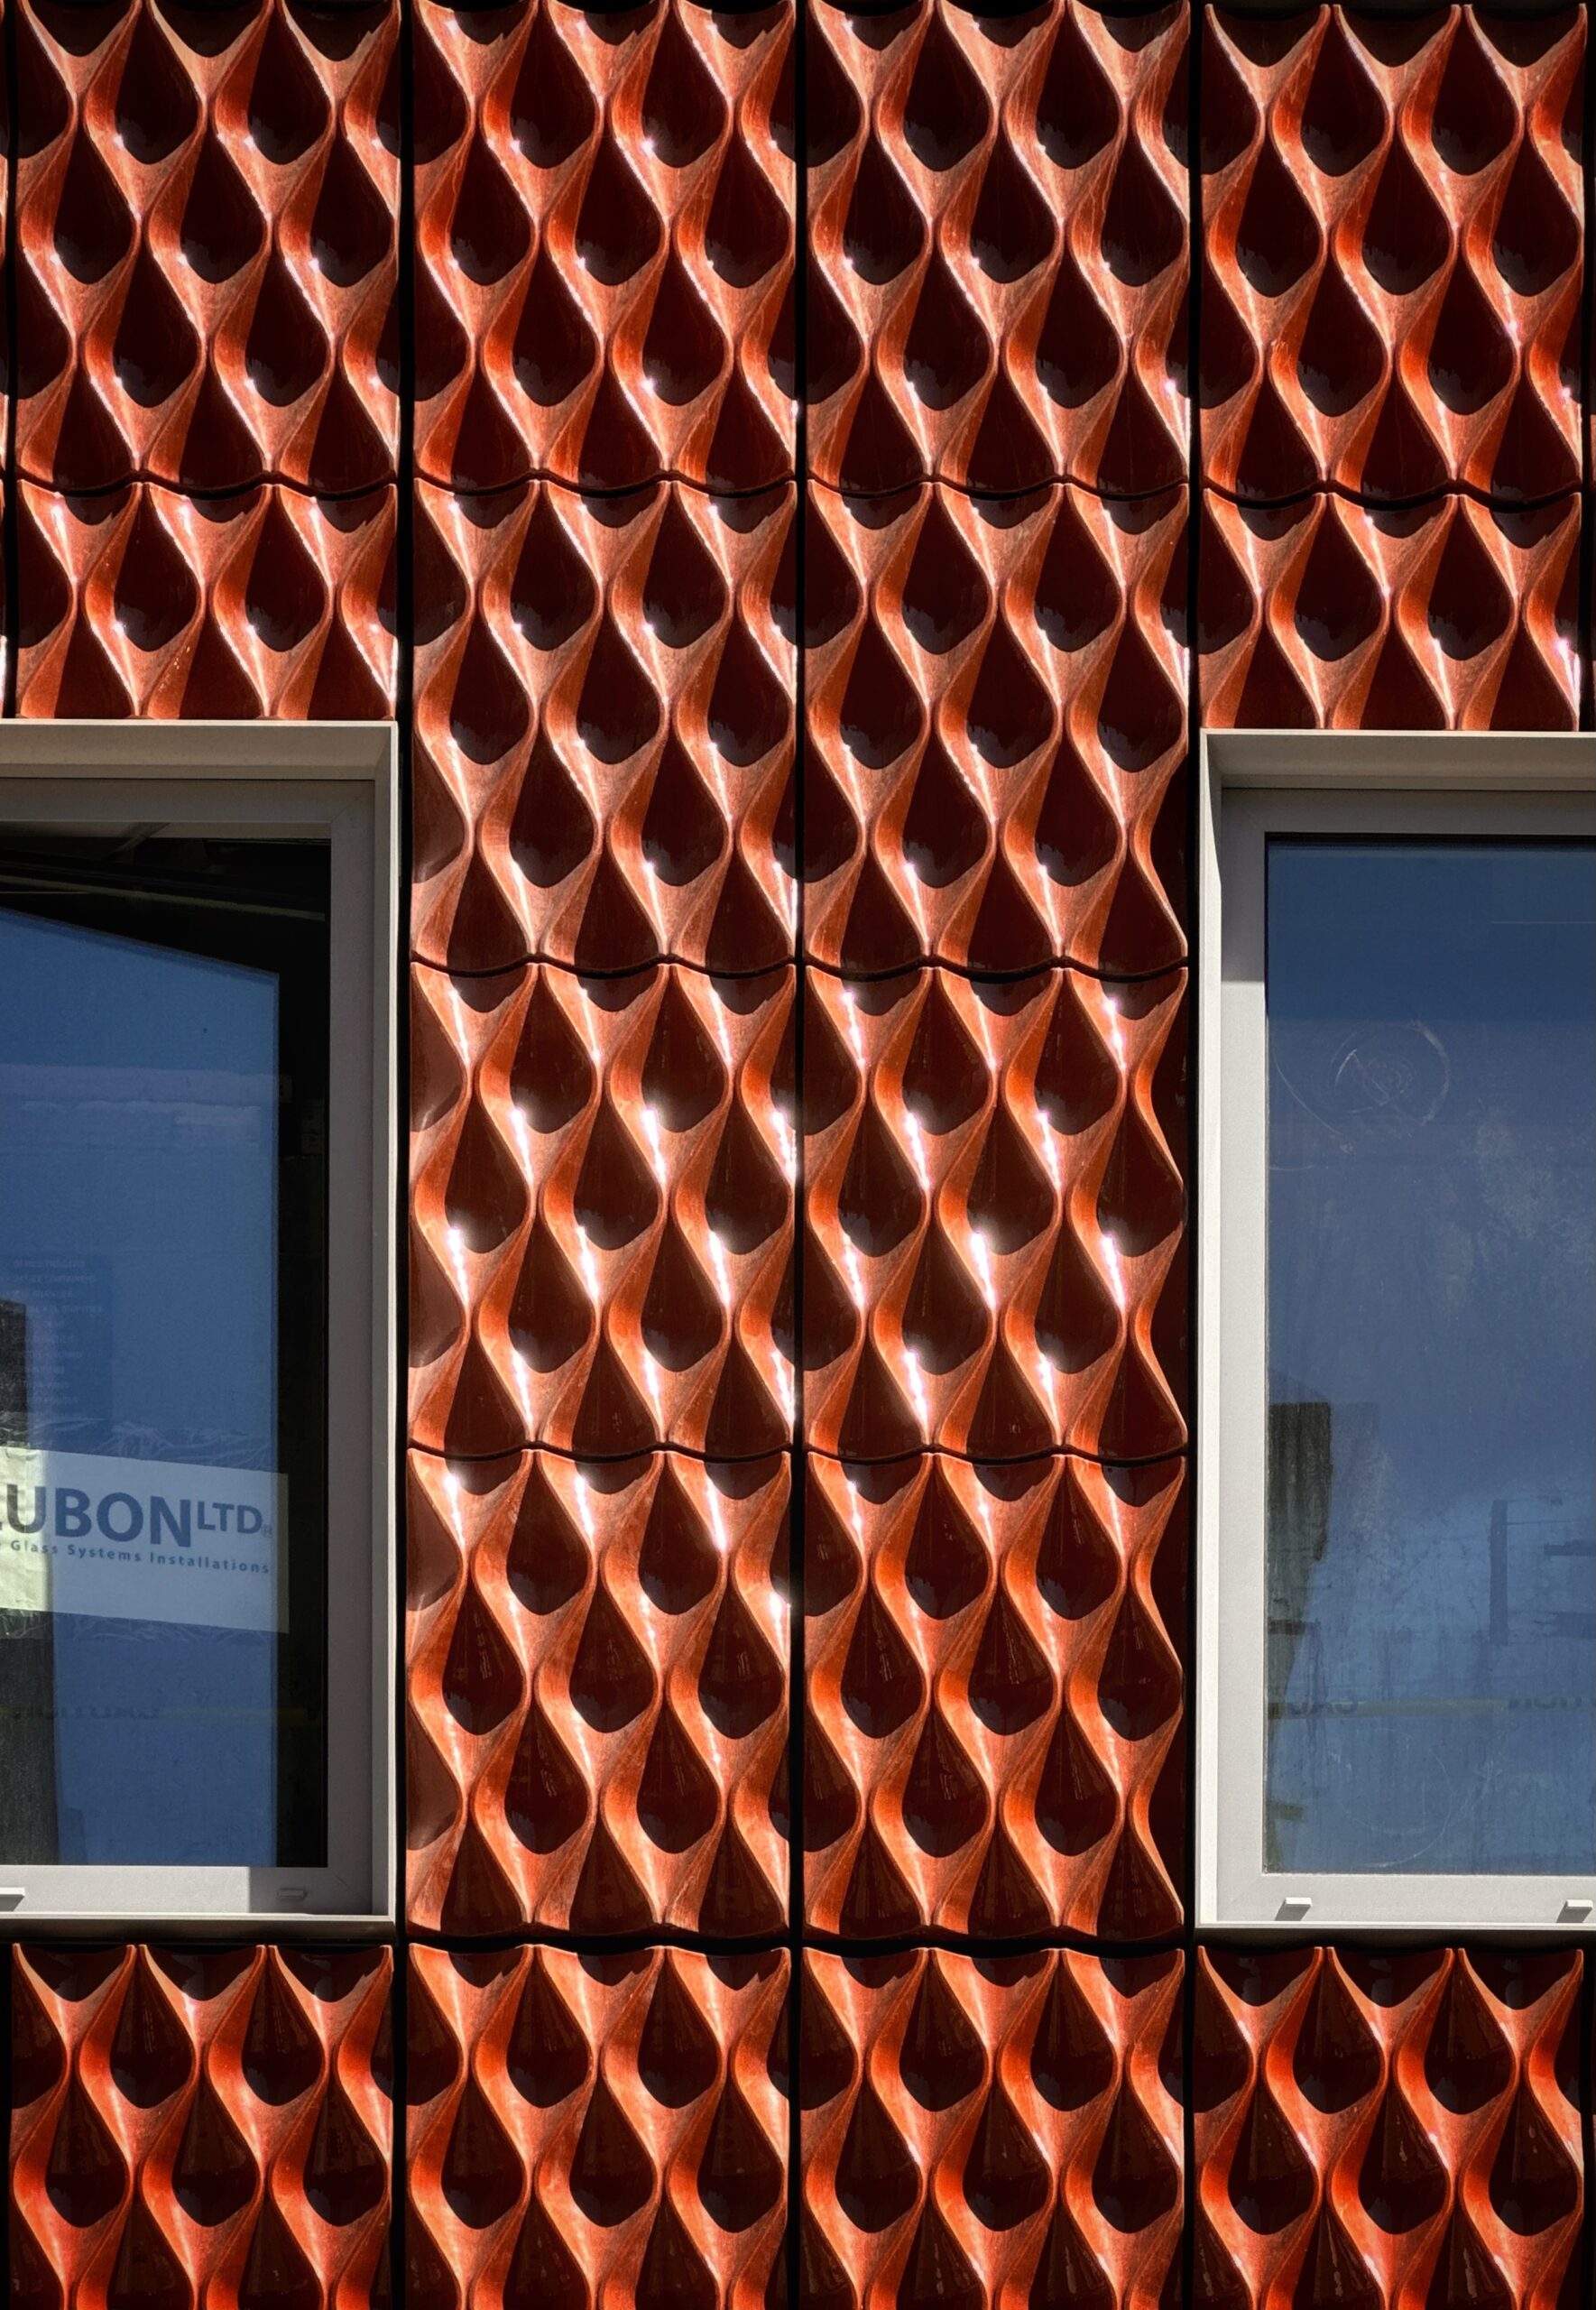
430 East 51st Street. Photo by Michael Young.
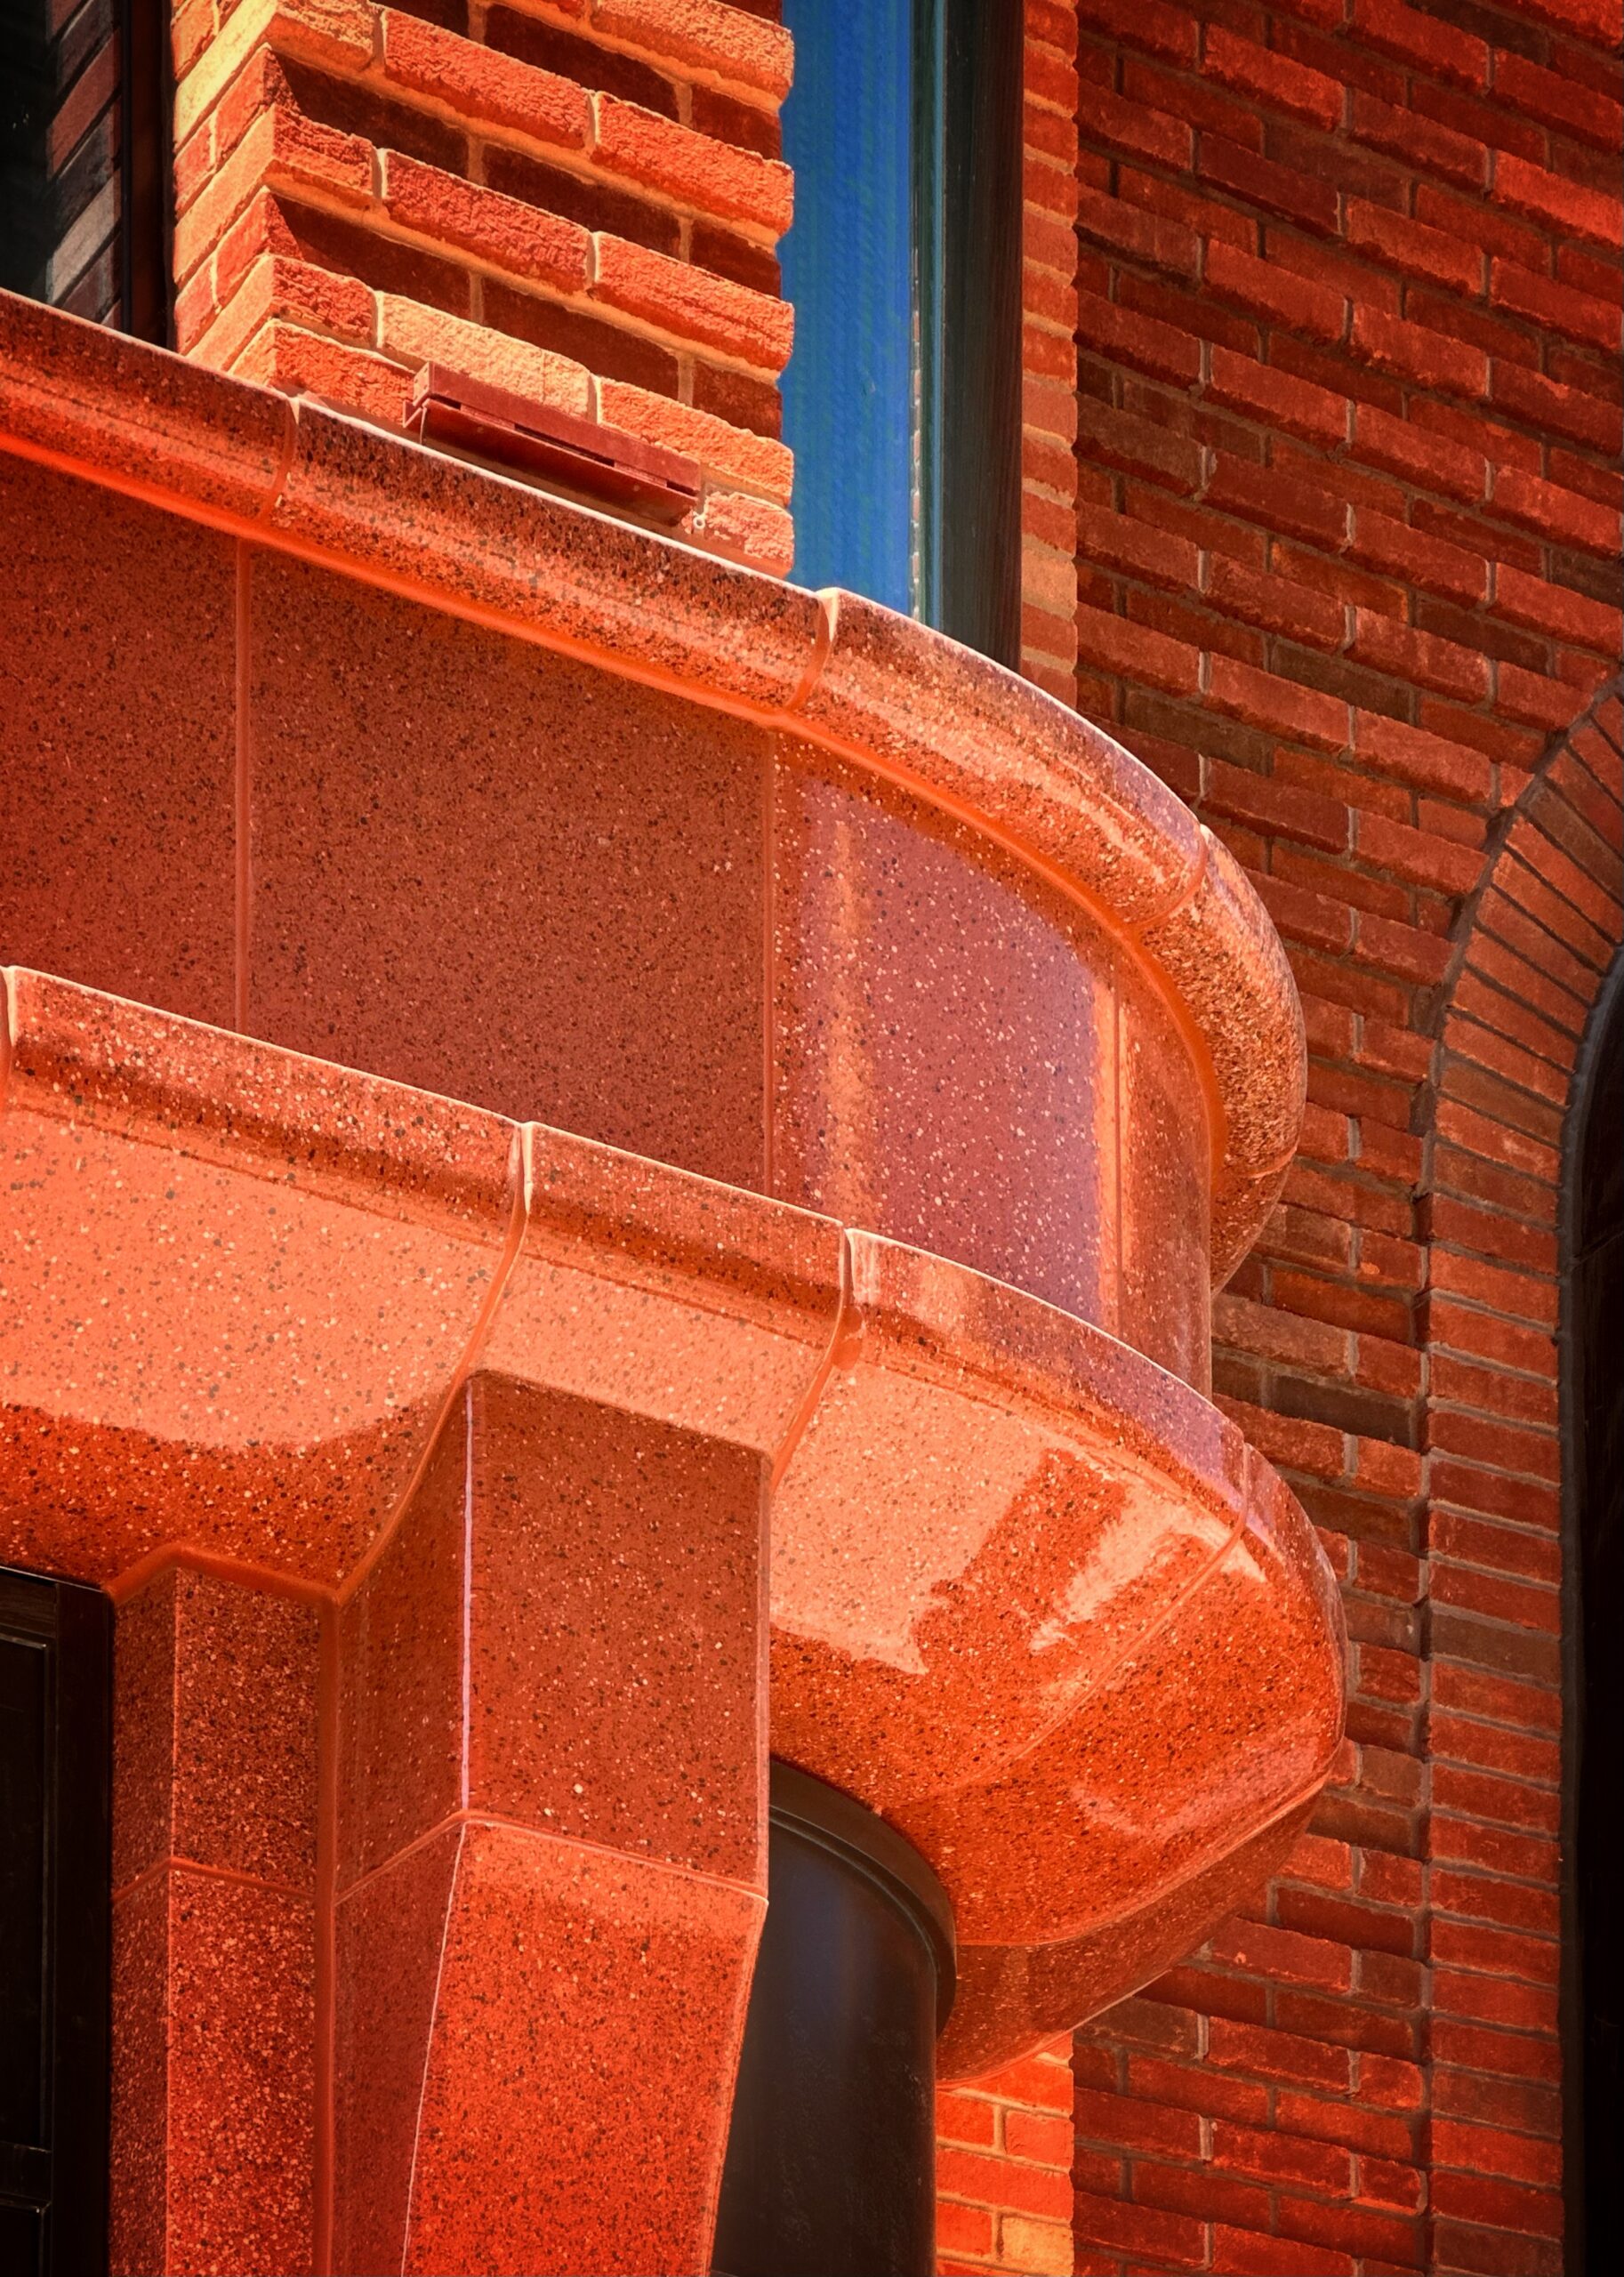
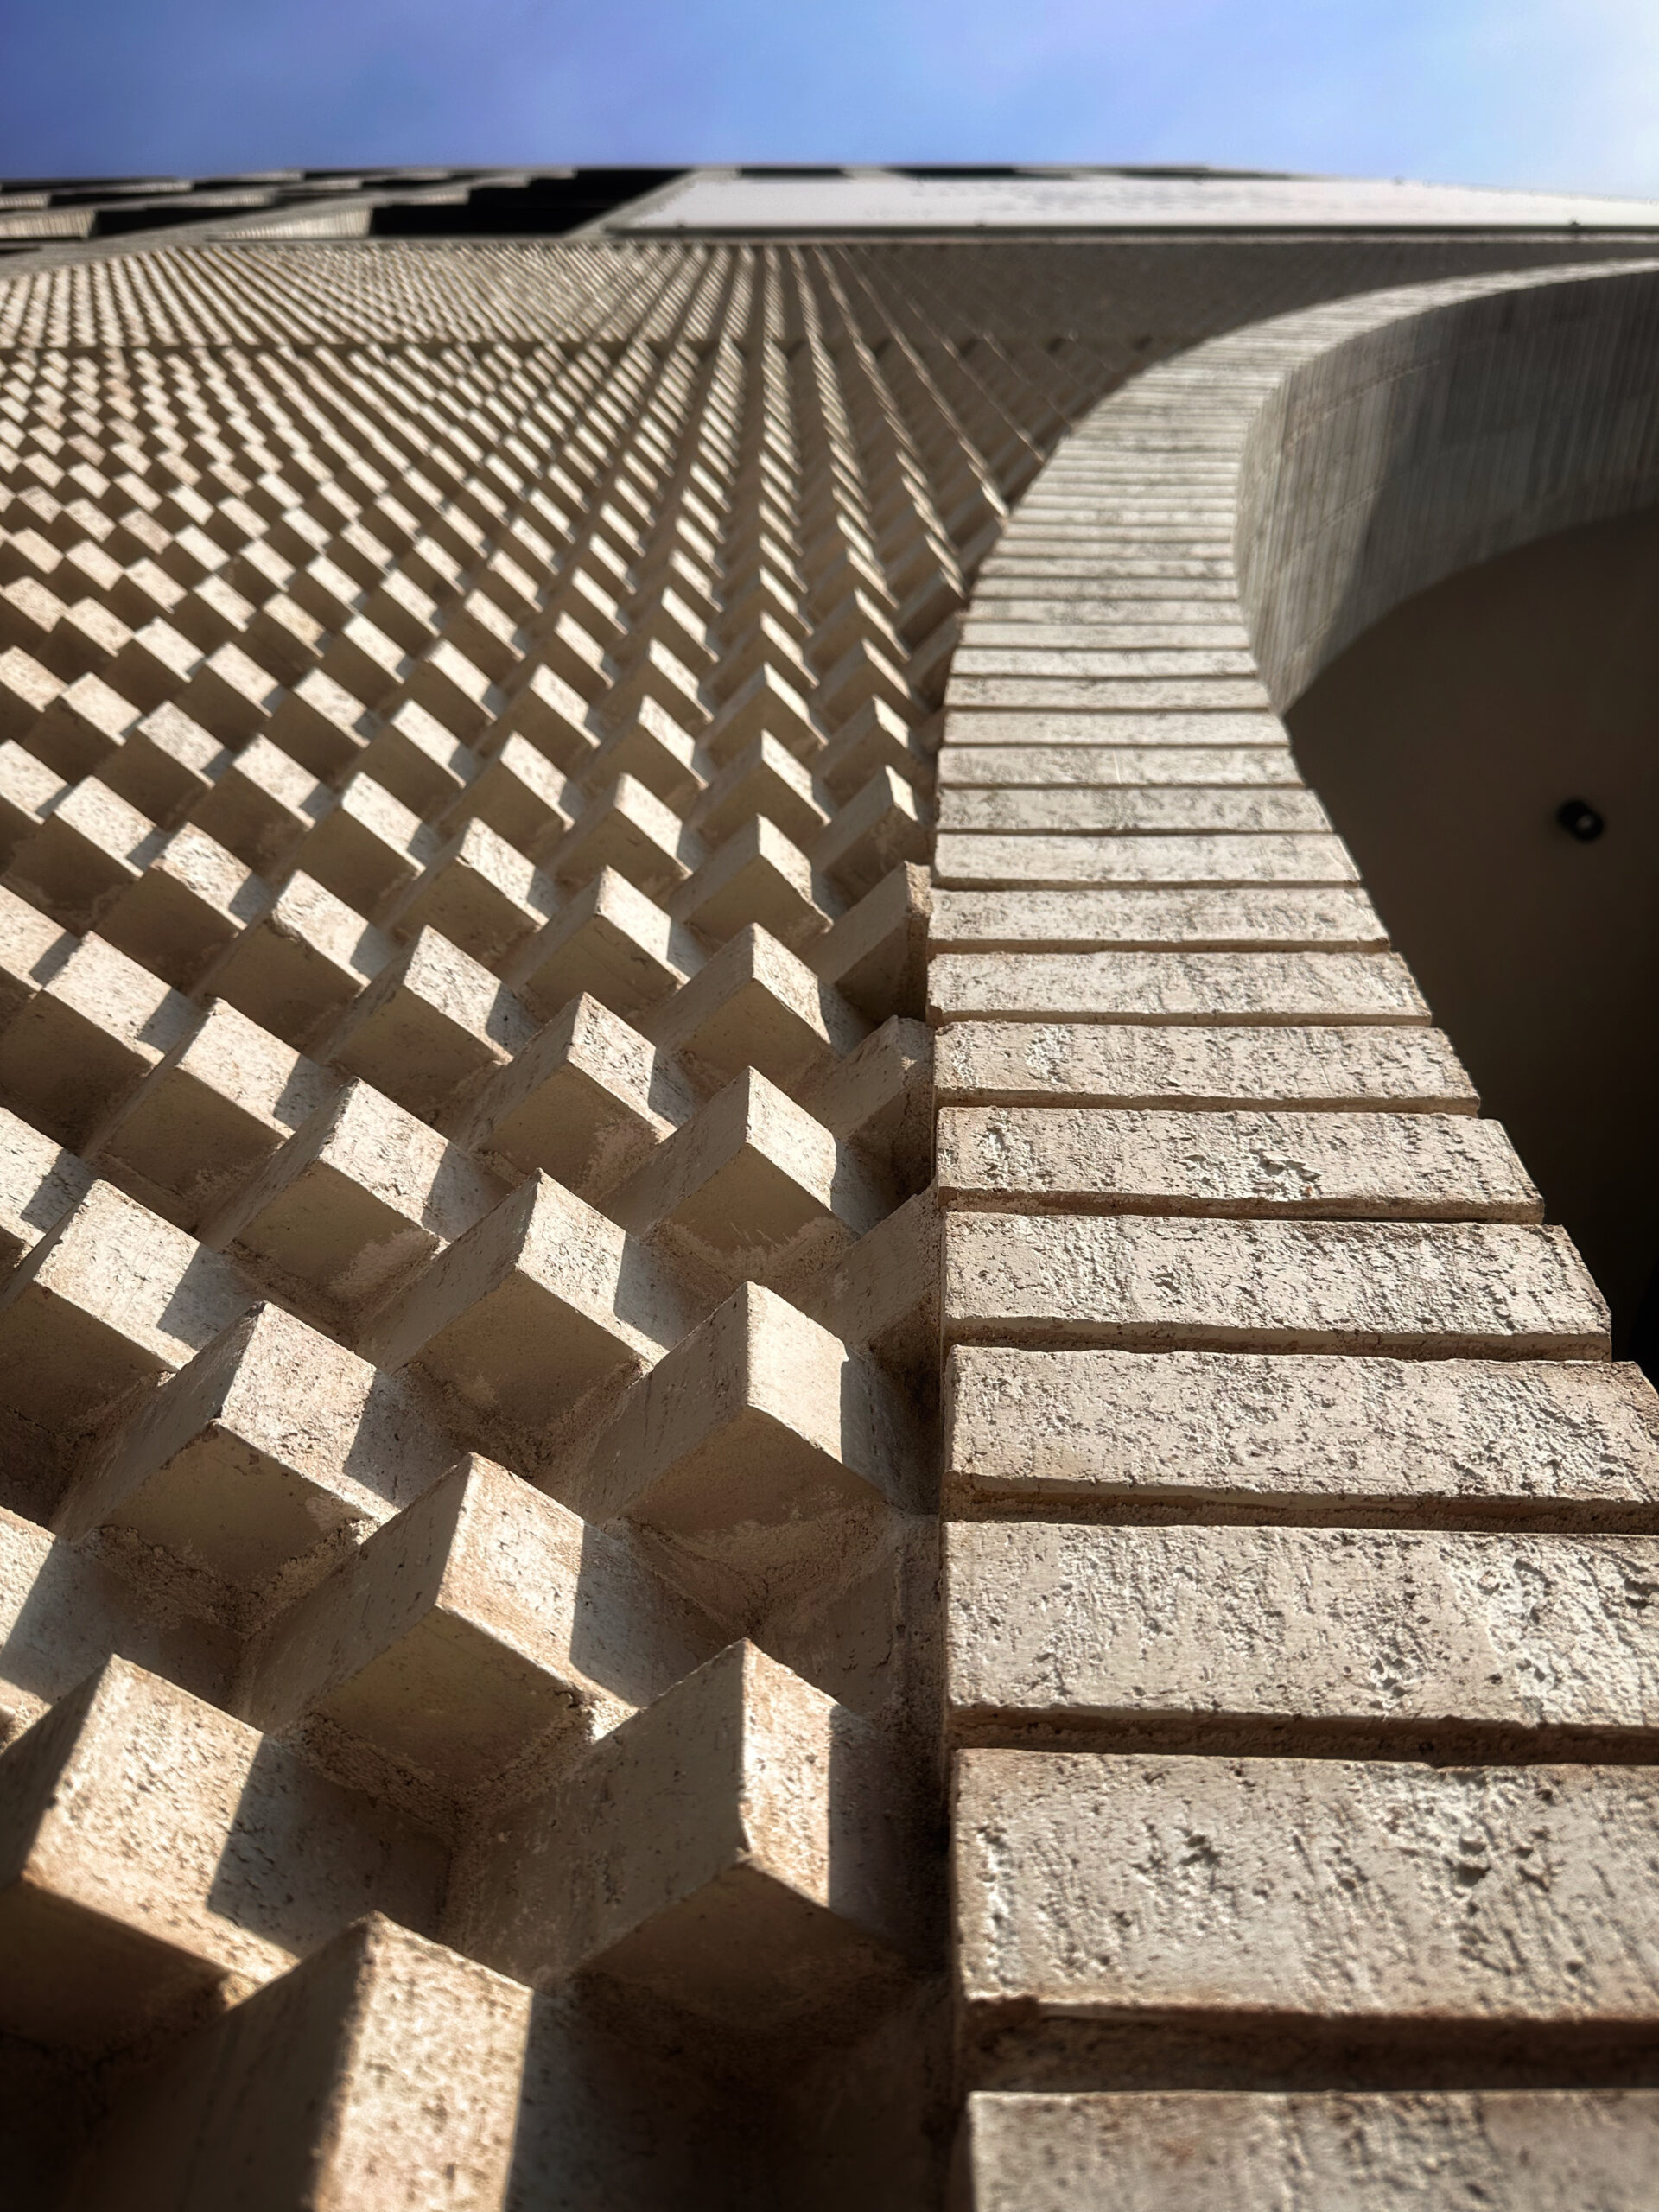
Maison Bond. Photo by Michael Young.
Subscribe to YIMBY’s daily e-mail

Follow YIMBYgram for real-time photo updates
Like YIMBY on Facebook
Follow YIMBY’s Twitter for the latest in YIMBYnews
What an encouraging and illuminating article. I hope you can update us every quarter, replete with figures, graphs, and commentary. And really good news and upbeat for NYC. More construction jobs and related spending in the next few years and more apartments and offices for years to come.
While it’s great to see the citywide construction boom, the report highlights a major disparity for Staten Island. Even though they saw a 120% jump in the number of permits, it’s already super low average unit count per filing decreased alongside the average floor area per filing. This shows that development there remains almost exclusively limited to low-rise single-family homes.
Staten Island doesn’t need Manhattan-style skyscrapers to keep up but it desperately needs a plan for missing middle housing. Replacing all of those parking lots along Hylan Blvd or Richmond Ave with 3-to-4-story mixed-use buildings, legalizing ADUs, and adding townhome density directly around Staten Island Railway stations would allow Staten Island to meaningfully contribute to solving the housing crisis without destroying its suburban appeal.
100% right about Staten Island so much area and potential for 4/6 story buildings along hylan and Richmond also forest ave but the Boro president stops anything that has density
yes he is blocking the north shore high rise developments around the ferry station, yet sewer/water/electrical and breakwall/ boardwalk upgrades are happening so it is getting ready for major development along there.
It’s a shame Empire Outlets didn’t include 25 story apartments above. The whole St George area around the ferry terminal should be built up like LIC, Jersey City and Mott Haven.
Let’s GOOOO! Love to see this. I do wish 175 Park weren’t an architectural dud, but all in all, such fantastic news.
I don’t think it is a dud at all. It is a beautiful design. That red monstrosity on East 51st, however…
I predict 175 Park Ave will be considered the most beautiful skyscraper built in NYC during the 21st century.
A excellent and illuminating article, though l have to laugh just a bit when I see photos here of beautiful 16 Fifth Avenue, with all of its 14 units..
City booms under new mayor.
The haters will never give him credit for anything. Their constant negativity is depressing, but can’t let it get the best of us.
Name one of these projects that began under Mamdani… You can’t. These have all been in the works for years, some over a decade.
New York City building boom.
Appreciate you labeling the pictures
I second that—thanks, Yimby