
As the summer draws to a close, New York YIMBY takes a look back at the state of the city’s construction and real estate industry over the course of the year’s first half. Our comprehensive 2025 New York City Mid-Year Construction Report tallied all new building permit submissions made to the city’s Department of Buildings over the course of the year’s first and second quarters, from January through June. During this time span, the city’s developers and architects filed a total of 945 new building permits, which combine to a proposed total of 27 million square feet and will offer 23,446 new residential and hotel units. Below we analyze the aggregated data via a series of charts and analyses that take a detailed look at building height, floor area, location, and other factors.
A detailed data sheet, with thorough information on each proposed project and their development teams, is available with a subscription to YIMBY’s Building Wire.
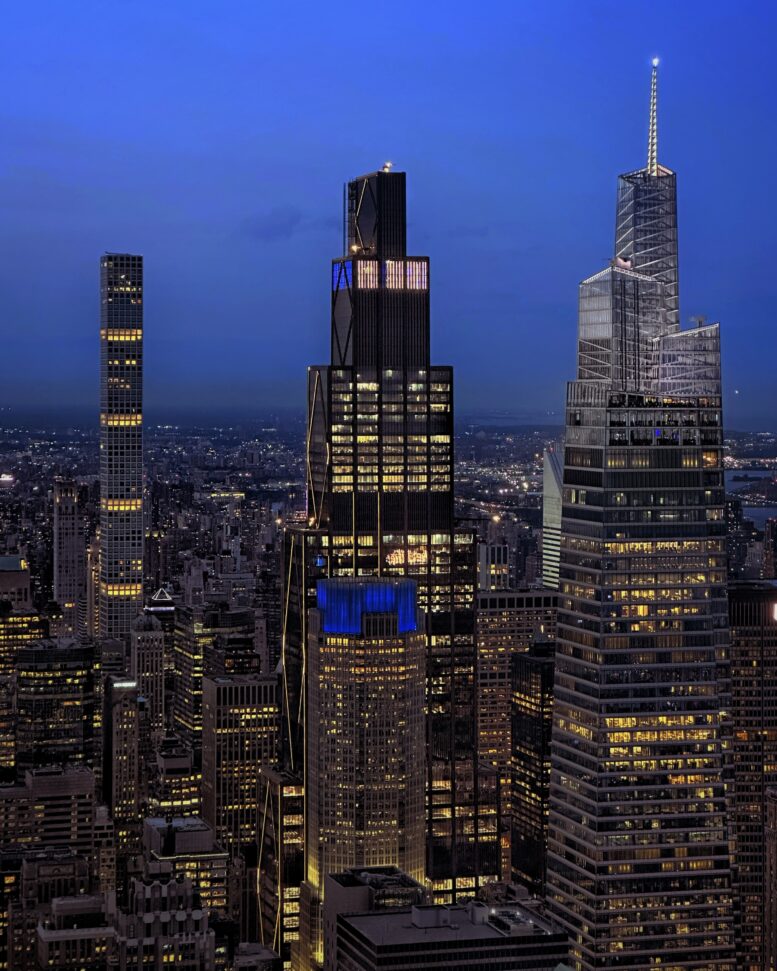
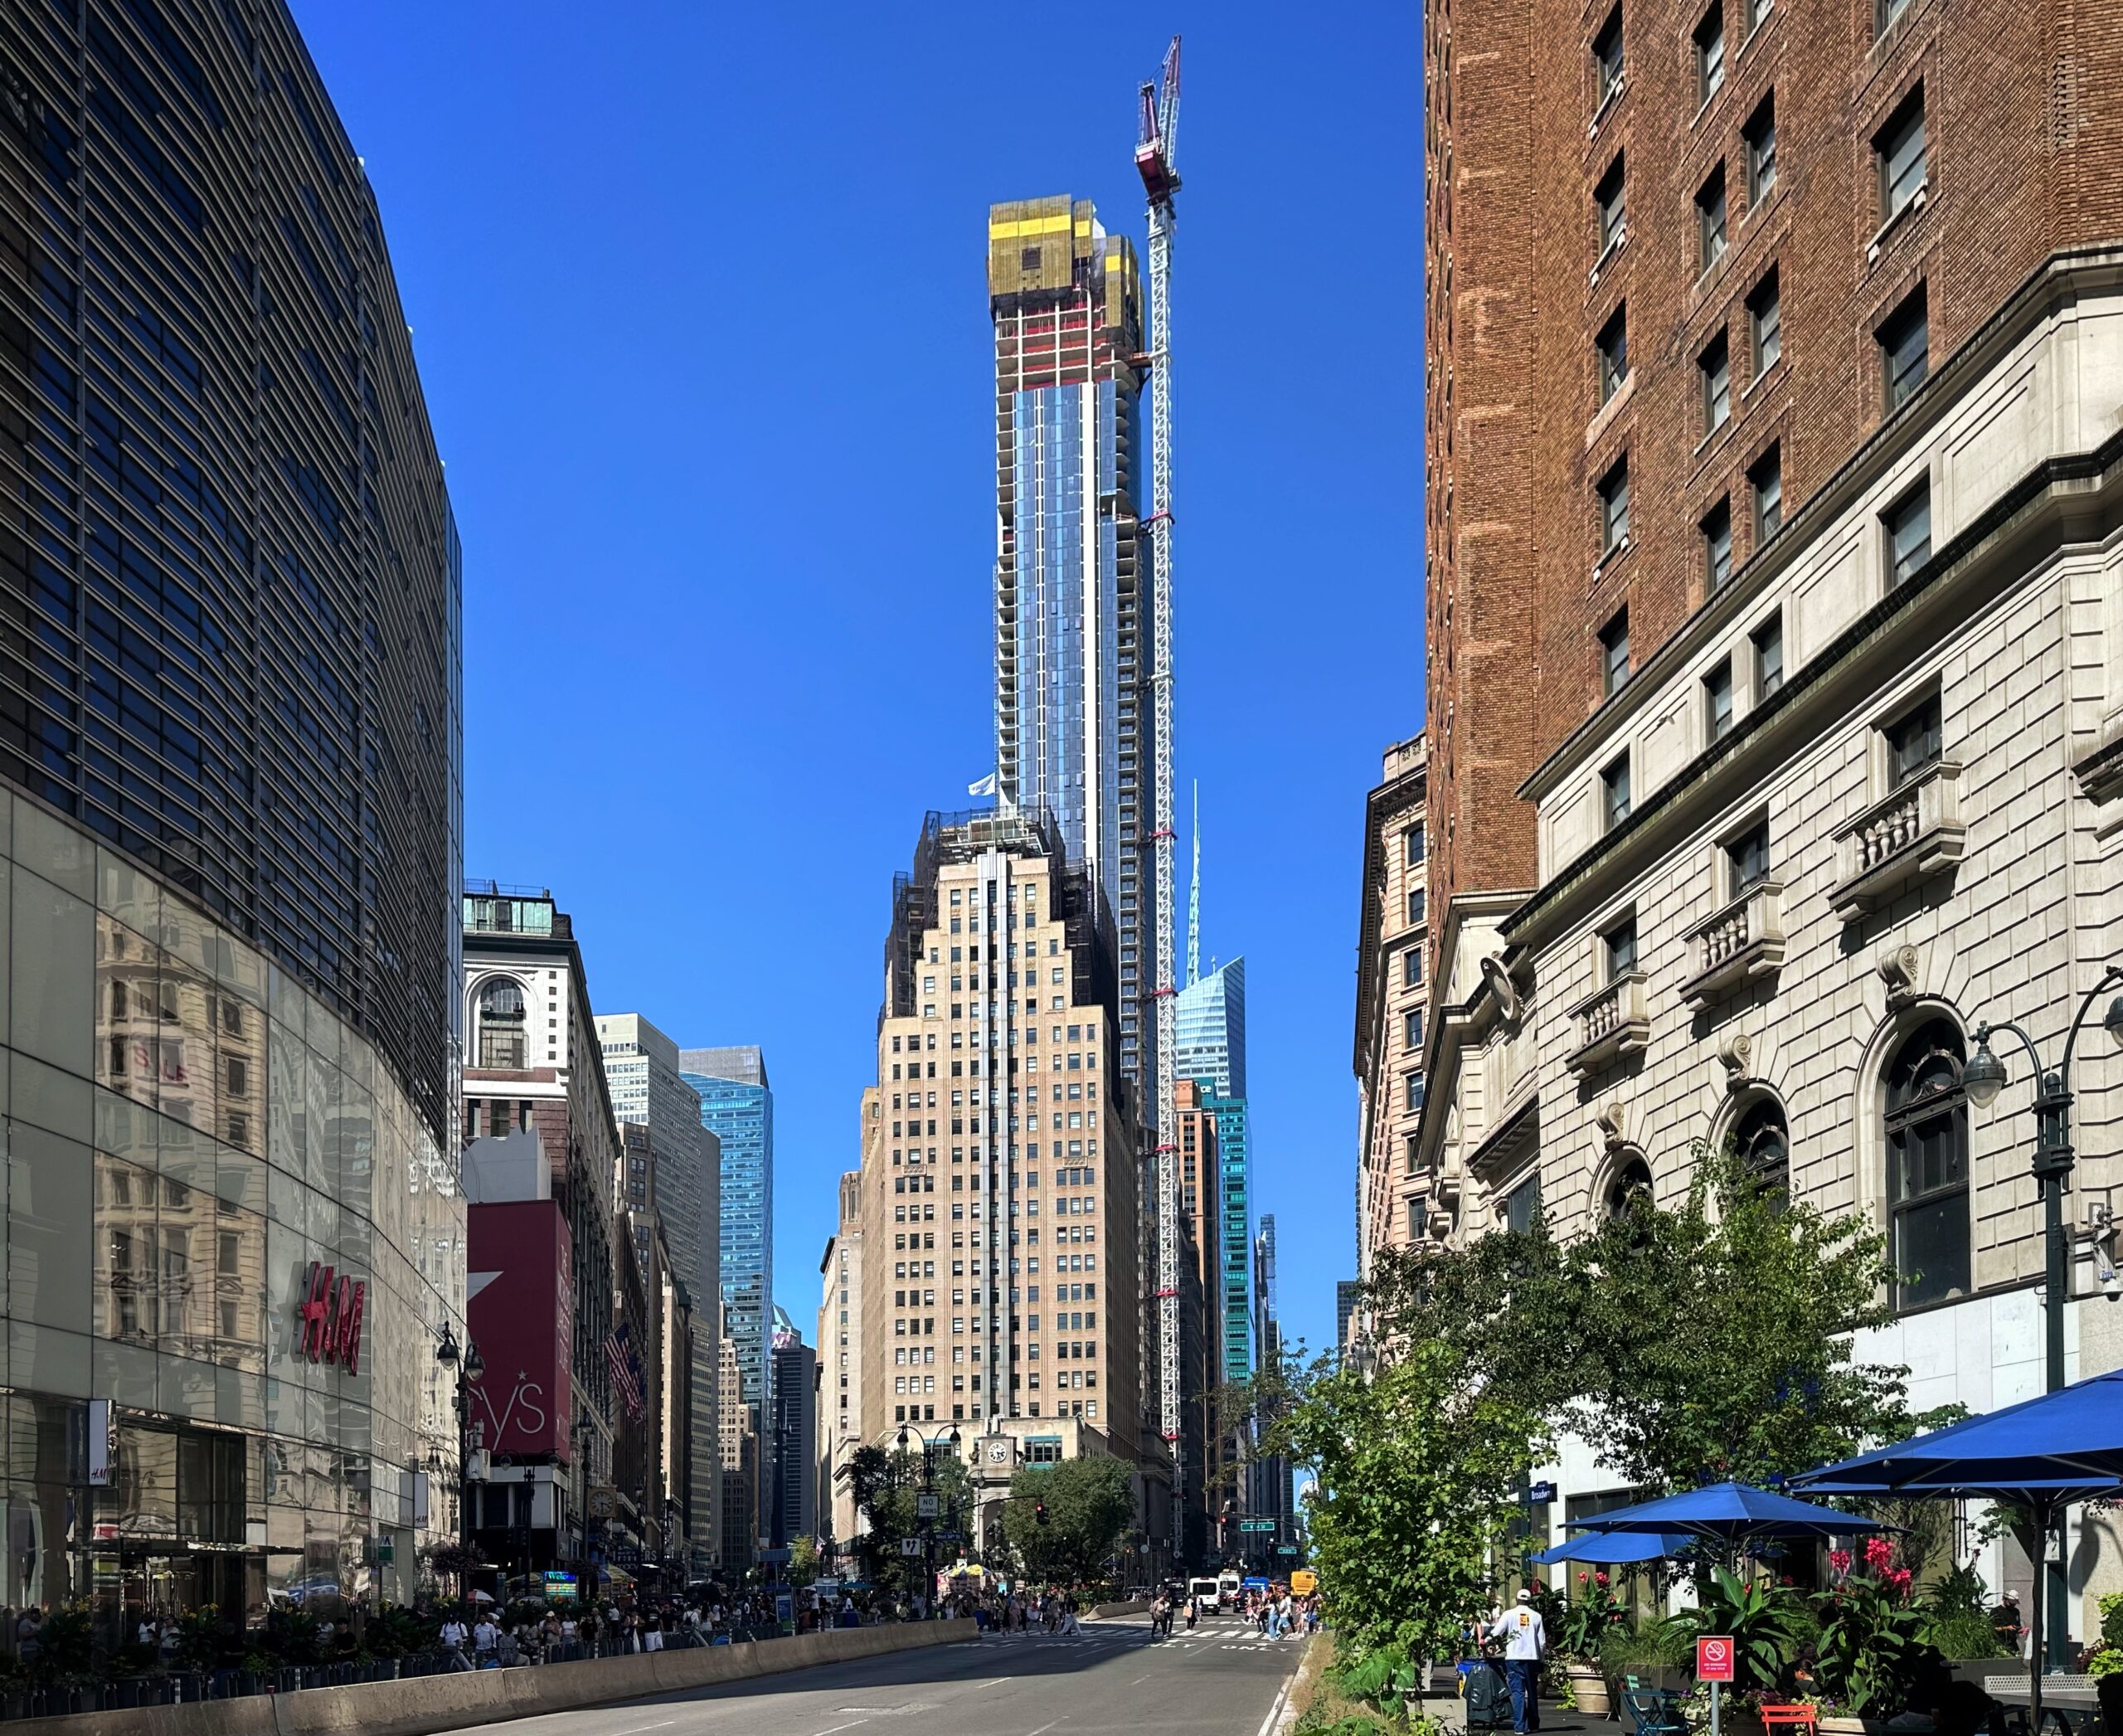
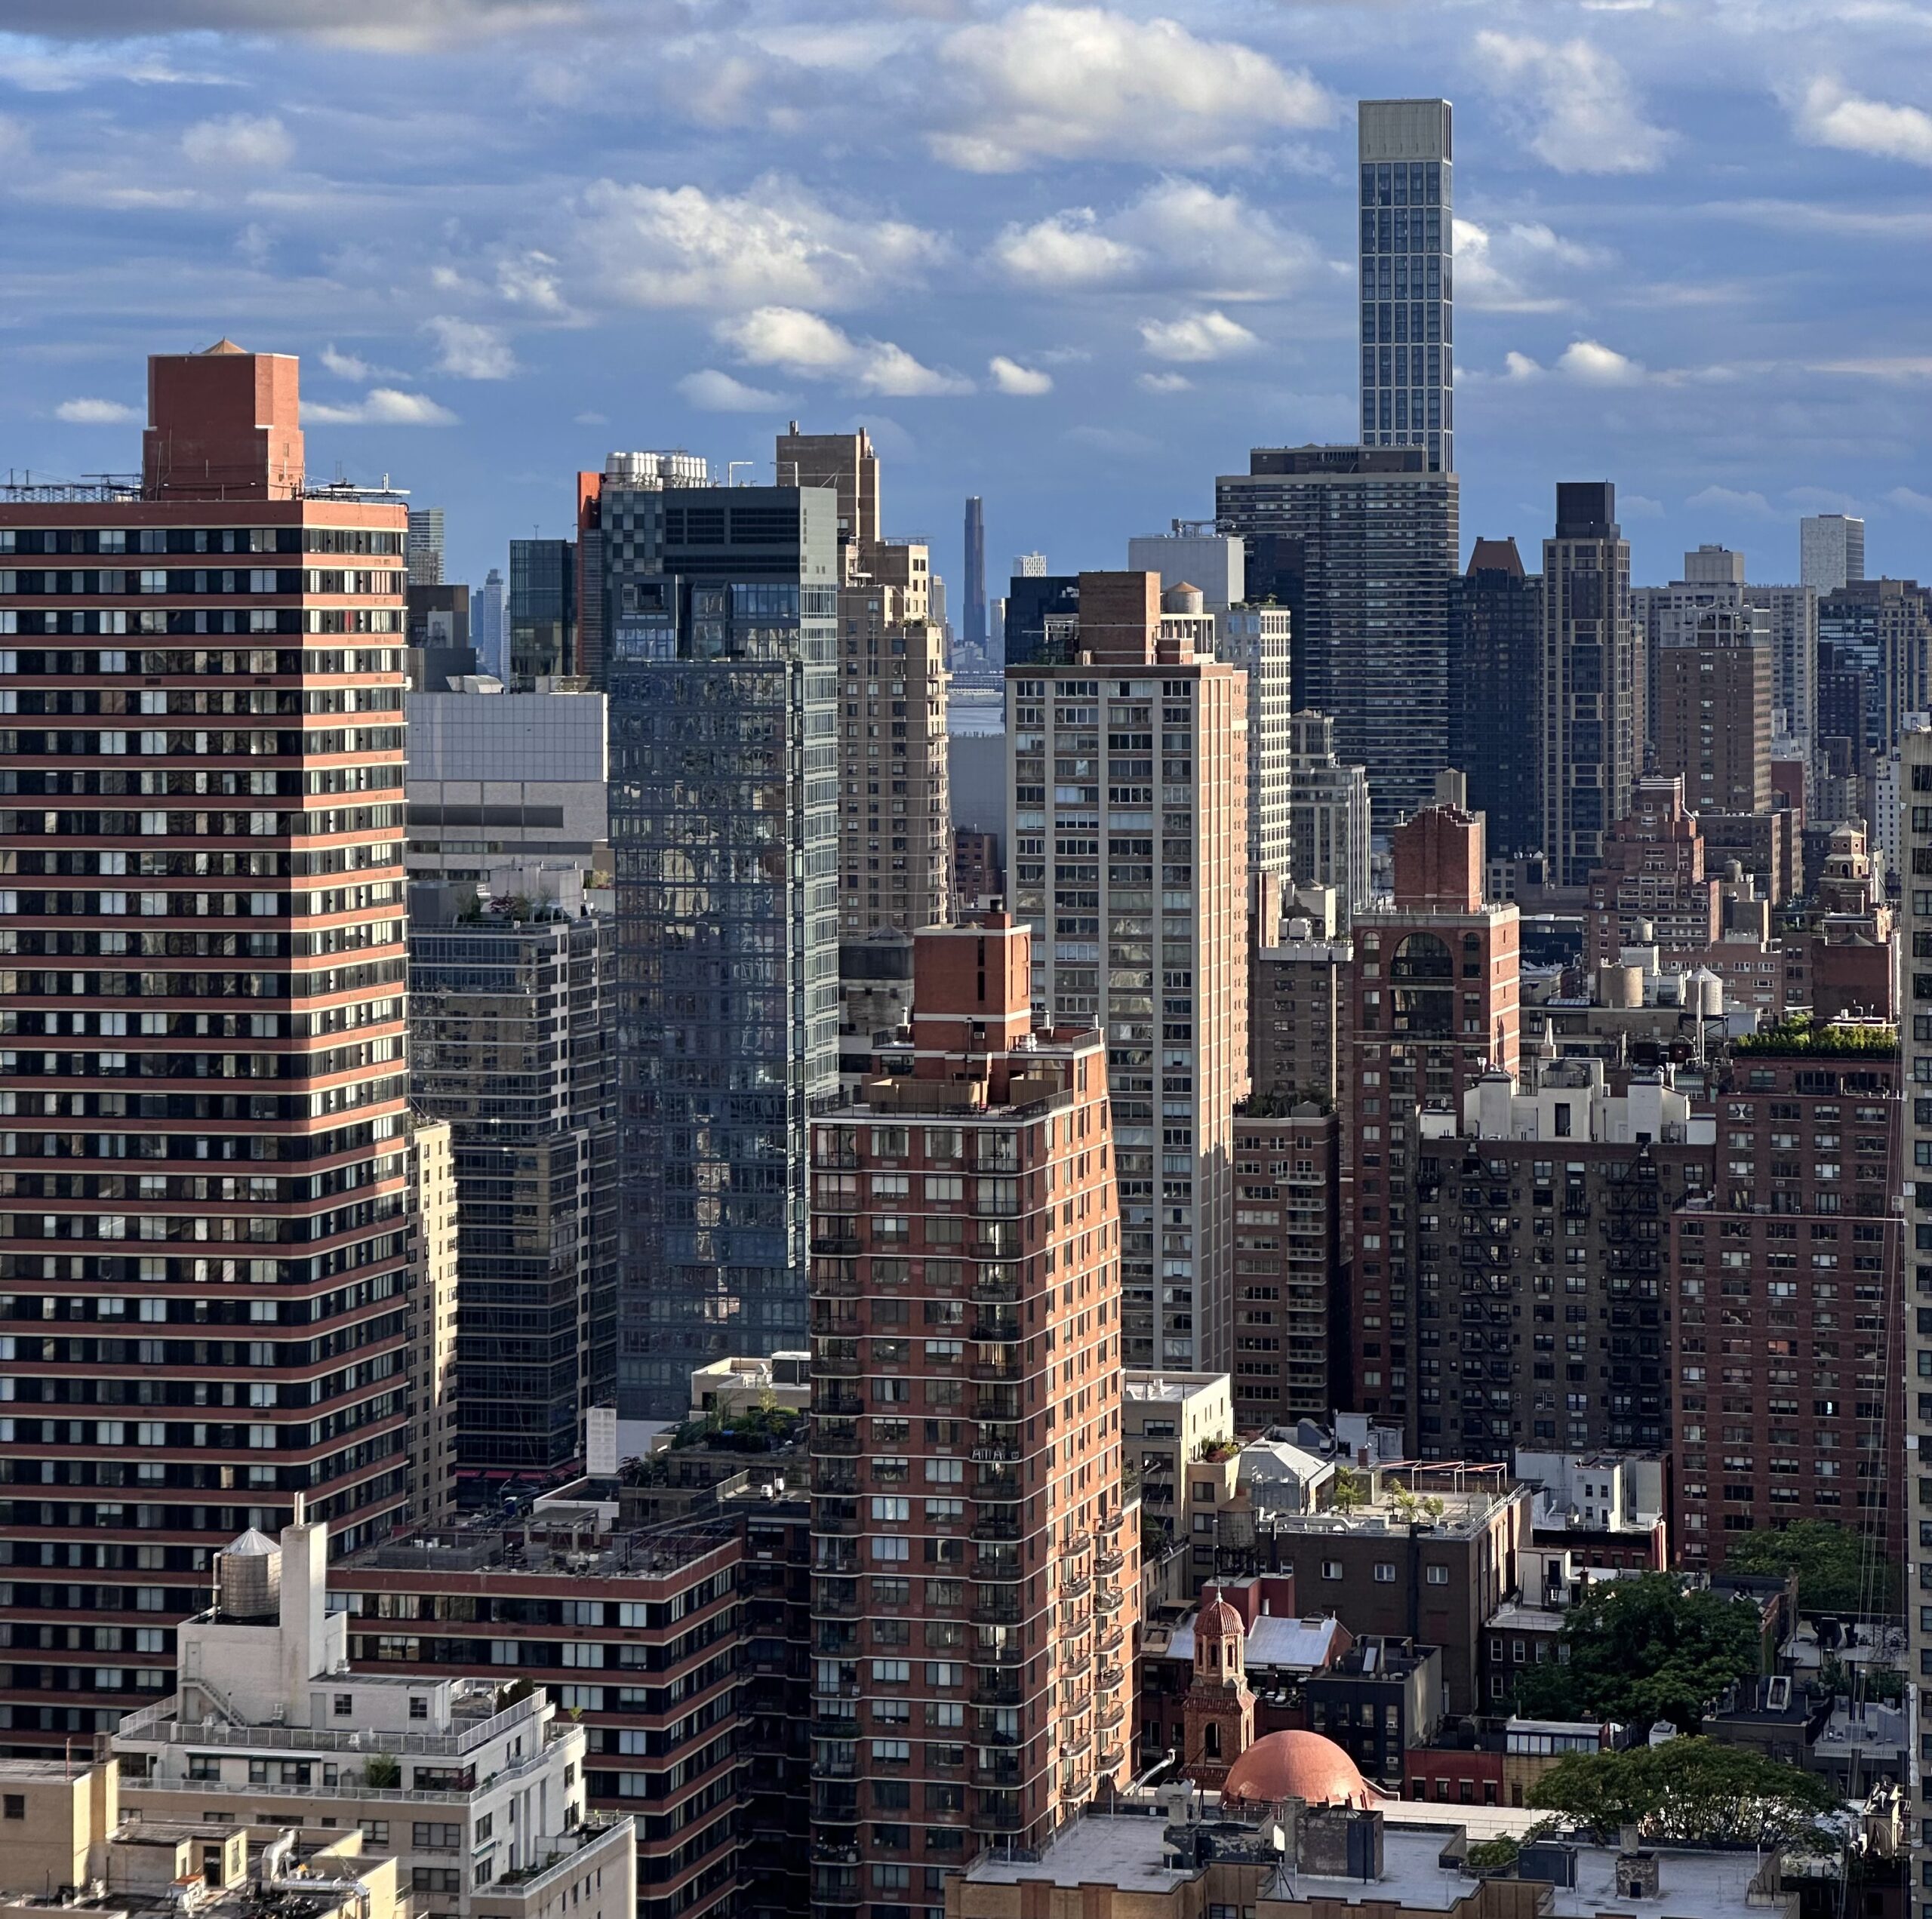
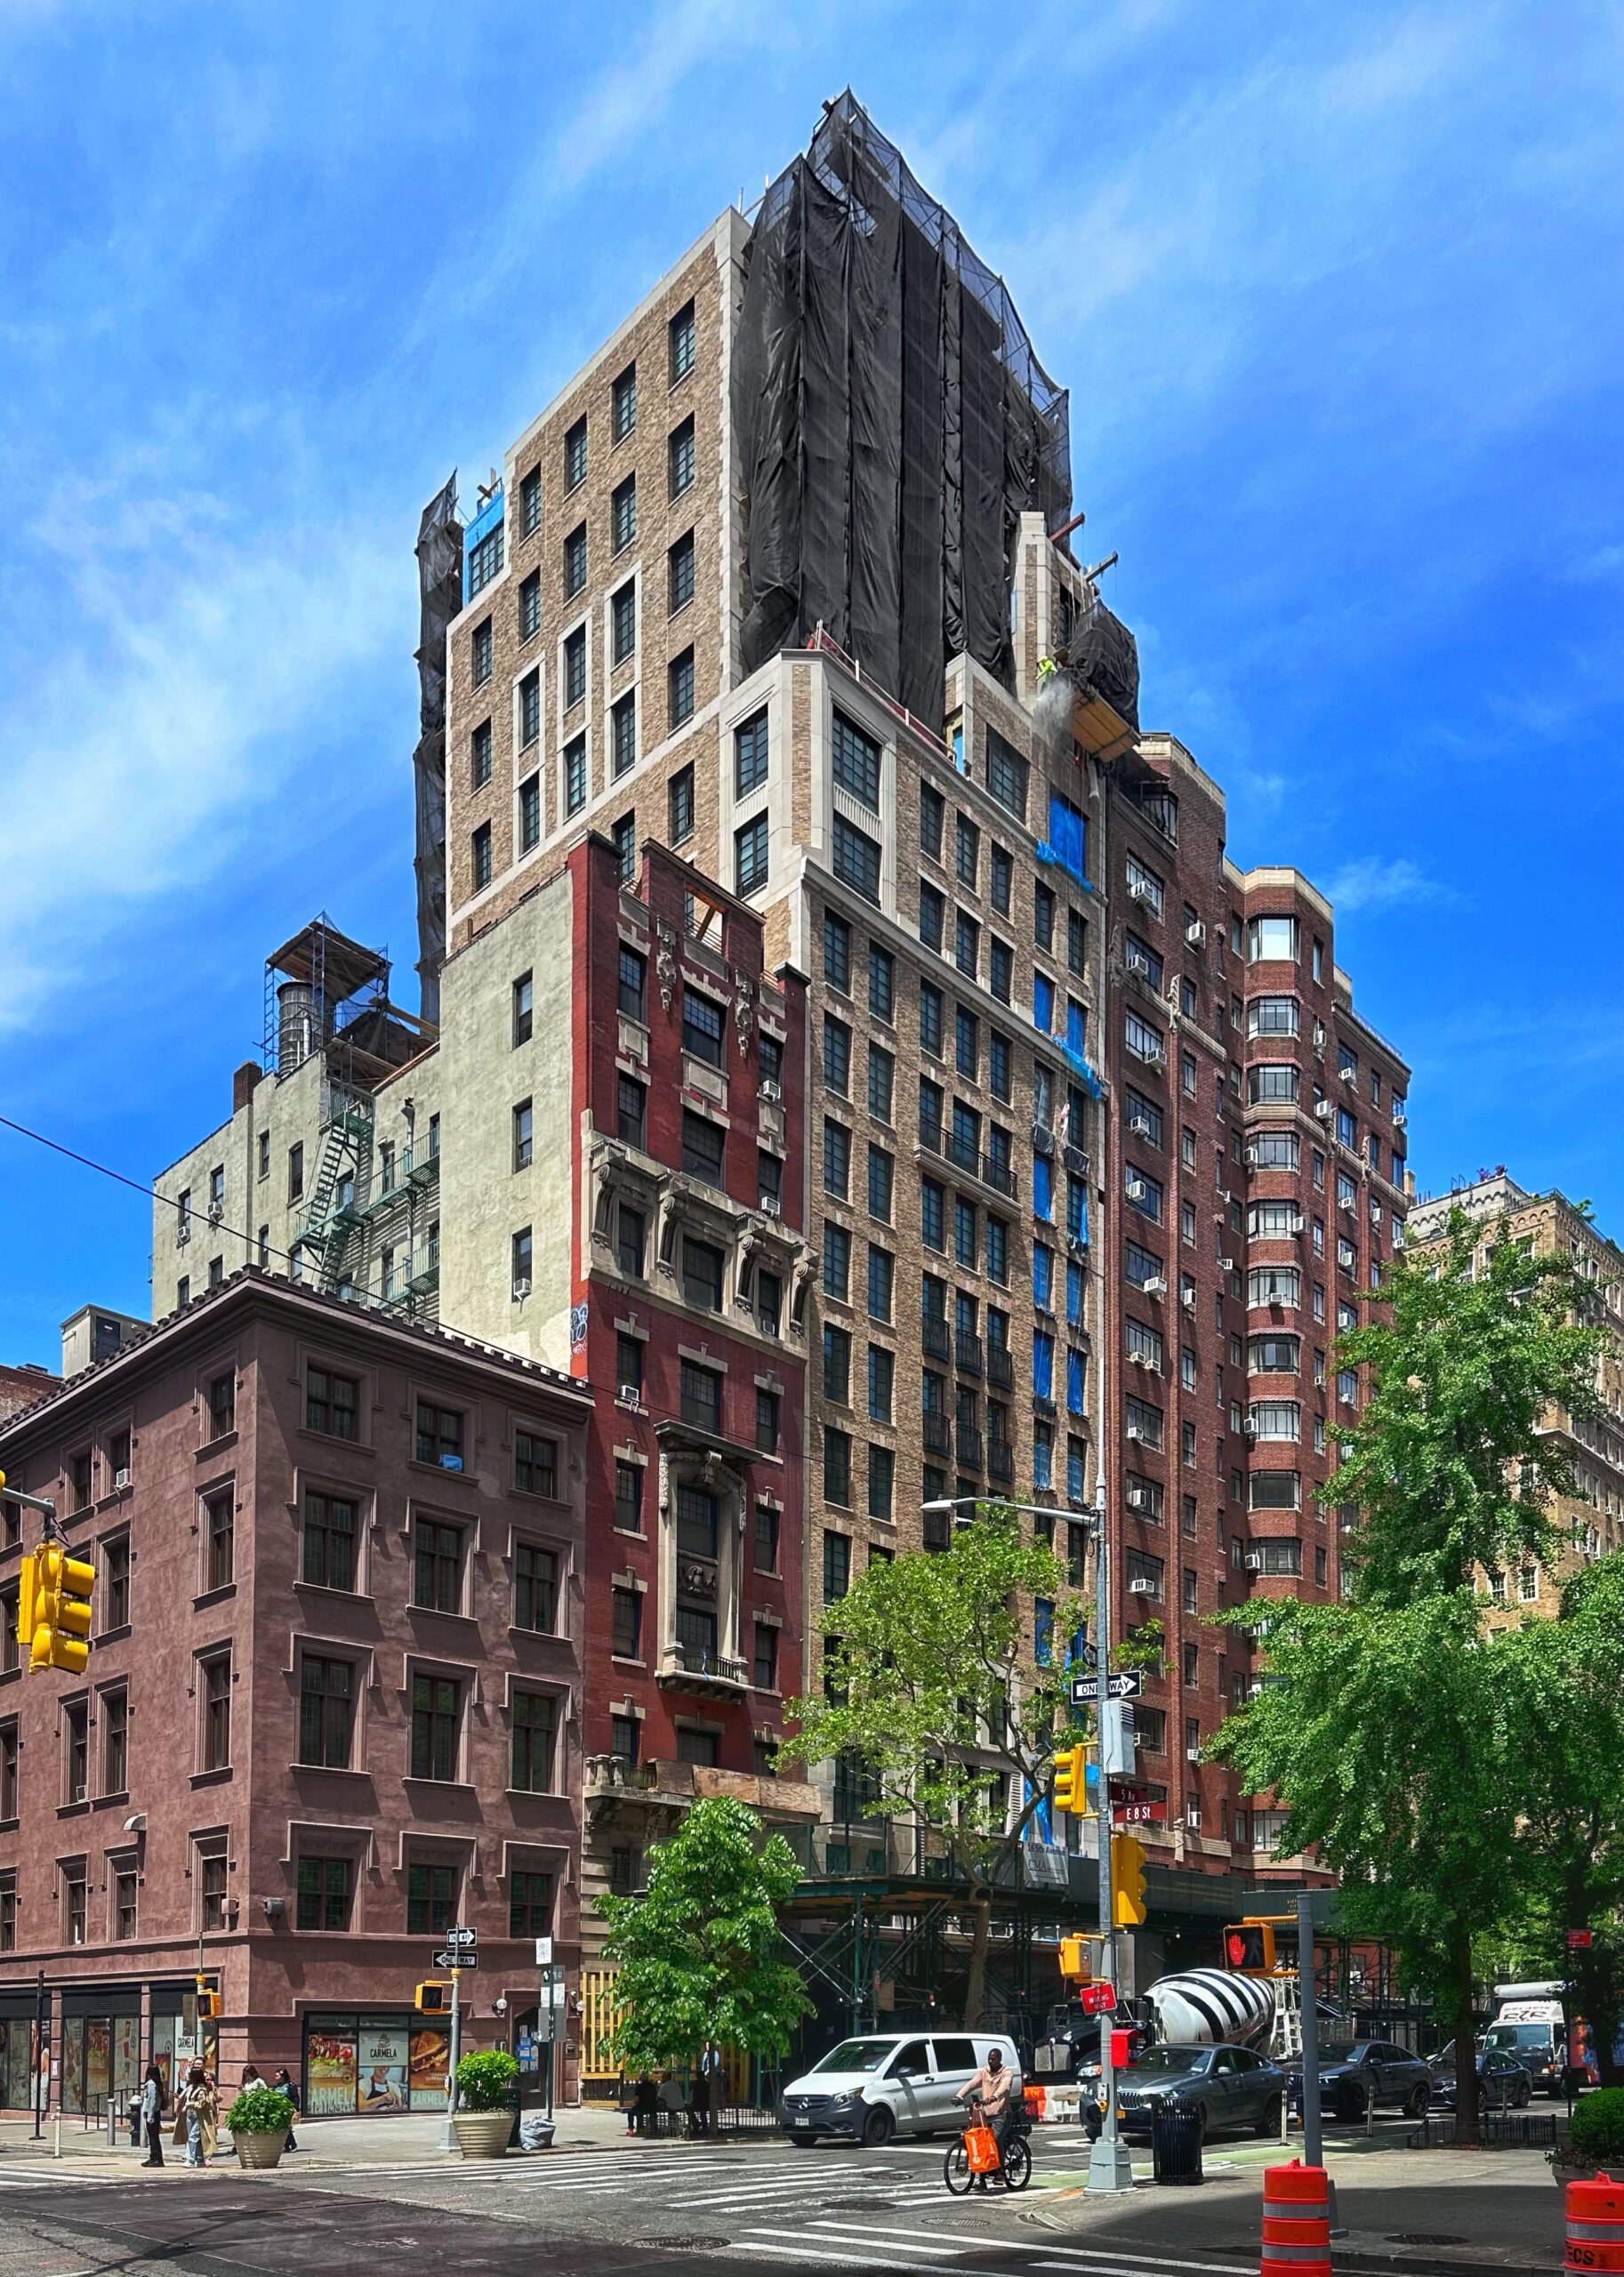
270 Park Avenue. Photo by Michael Young.
Number of permit filings per month
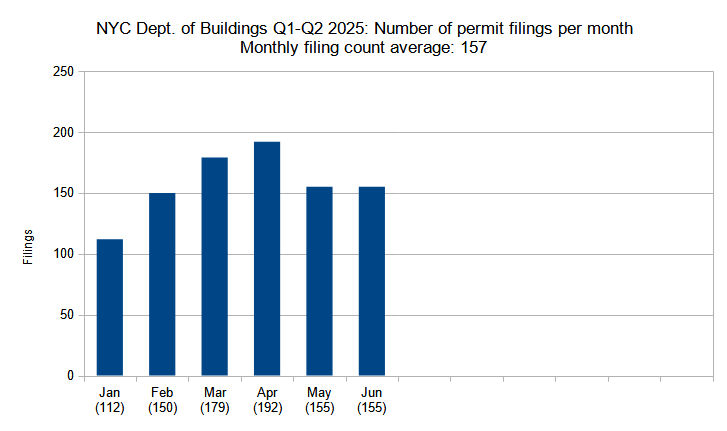
Number of new construction permits filed per month in New York City in Q1-Q2 (January through June) 2025. Data source: the Department of Buildings. Data aggregation and graphics credit: Vitali D. Ogorodnikov.
The first half of 2025 shows a pronounced upward trend in the number of monthly permit filings. Starting with January, the lowest-tally month with a total of 112 new building permit filings, the numbers steadily increase to a half-year high in April, which notched 192 filings, then lowers back down slightly in May in June, with each ranking just two points below the half-year’s 157-permit monthly average.
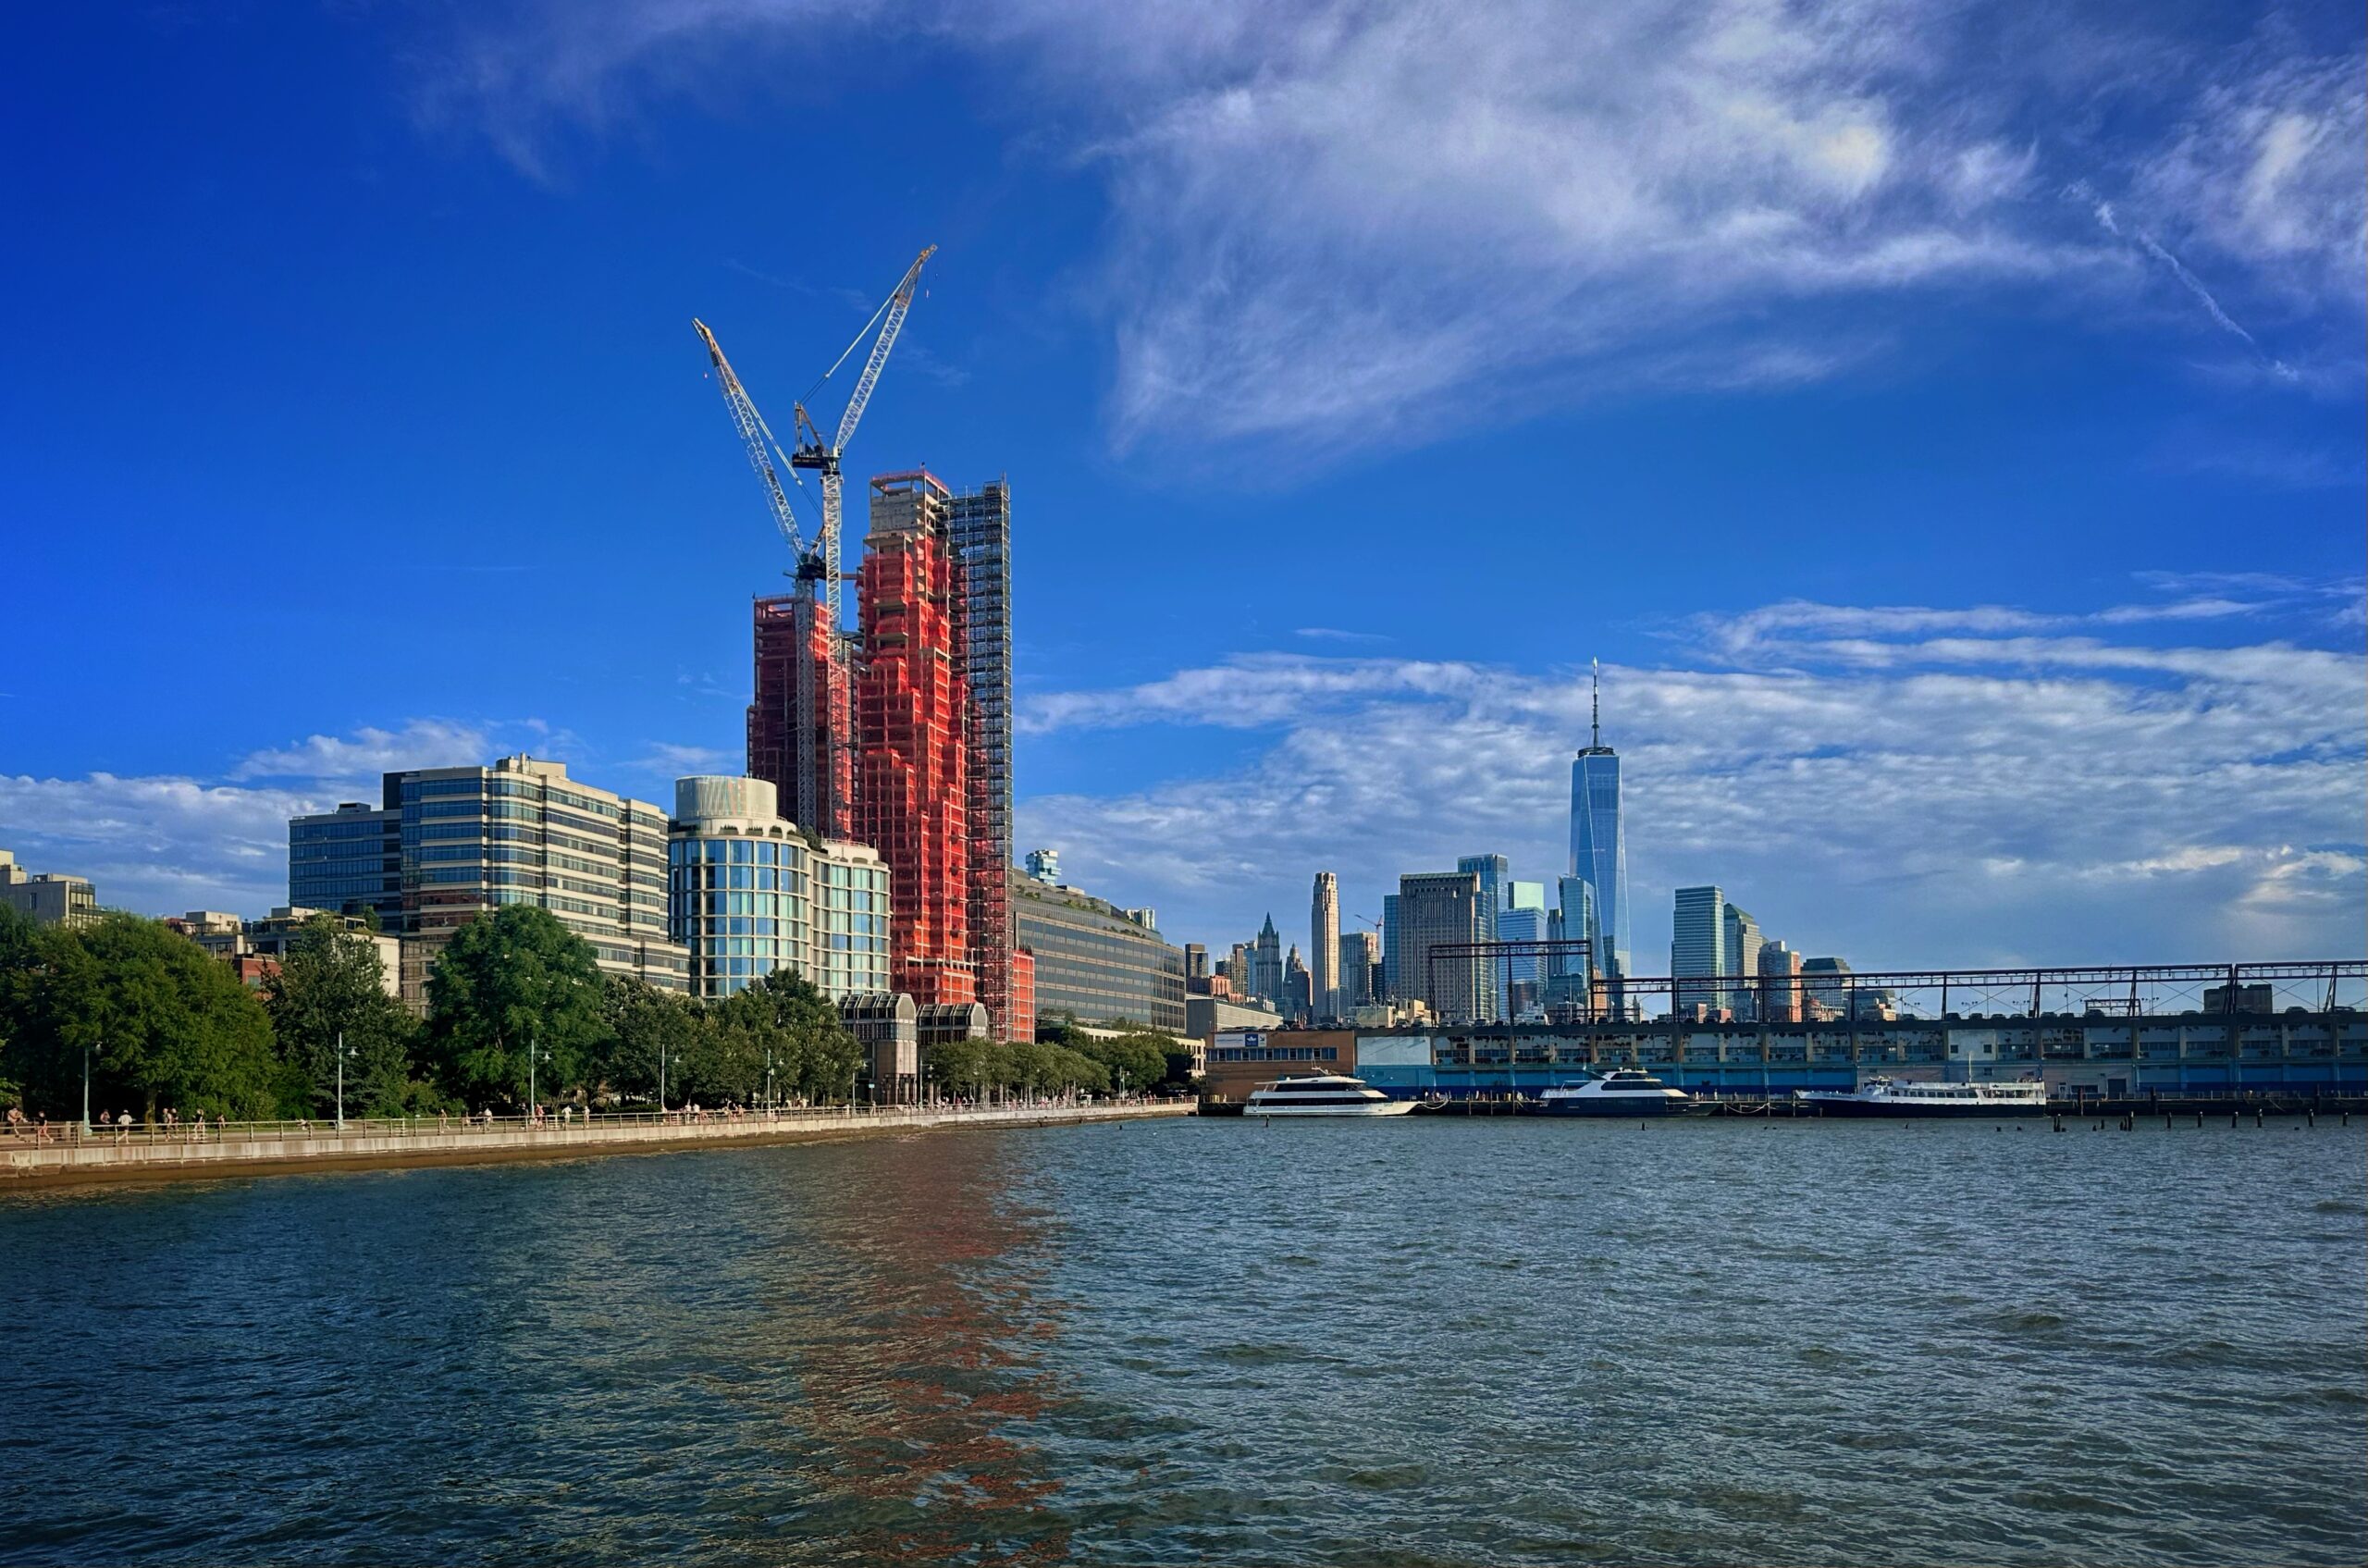
80 Clarkson. Photo by Michael Young.
Number of permit filings by borough
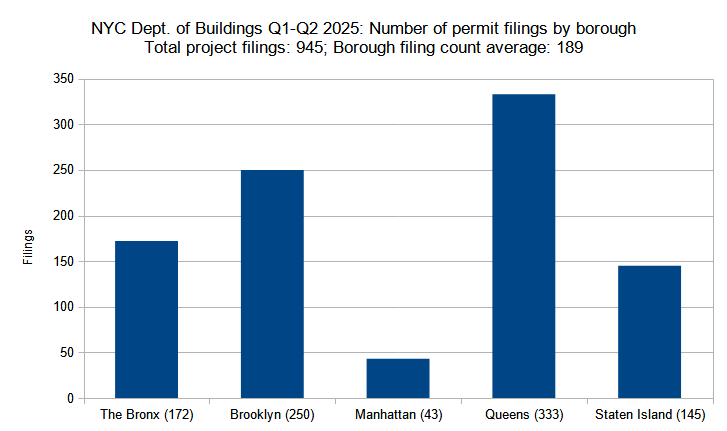
Number of new construction permits filed per borough in New York City in Q1-Q2 (January through June) 2025. Data source: the Department of Buildings. Data aggregation and graphics credit: Vitali D. Ogorodnikov.
Following a long-established trend within the city’s development industry, proposals in Manhattan tend to be larger in scale yet fewer in total numbers than their counterparts in the other four boroughs. As such, the 43 permits filed-for in Manhattan represent just 5 percent of the city’s total 945 filings for Q1 and Q2. By contrast, with 333 new building permits, Queens holds more than one-third of all of the city’s permit filings for the first half of 2025, followed by (in order) Brooklyn, The Bronx, and Staten Island, which hold between 15 and 26 percent of the total filings per borough.
Below is the breakdown of borough statistics:
- The Bronx – 172 permits (18 percent of total)
- Brooklyn – 250 permits (26 percent of total)
- Manhattan – 43 permits (5 percent of total)
- Queens – 333 permits (35 percent of total)
- Staten Island – 145 permits (15 percent of total)
The Brook at 589 Fulton Street. Photo by Michael Young.
Permits listed by unit count per filing
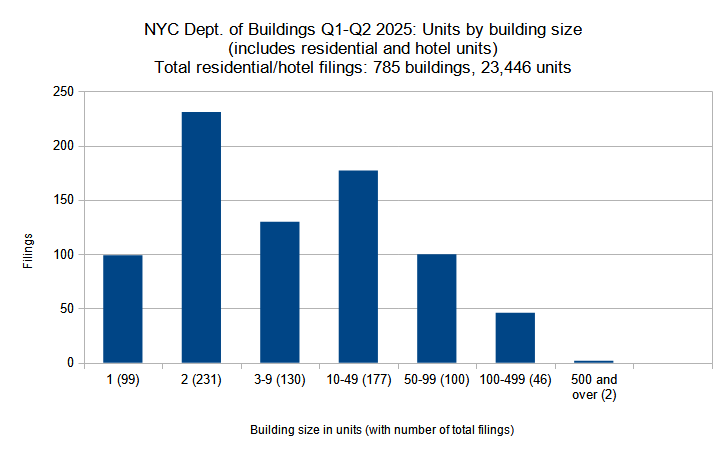
New residential and hotel construction permits filed in New York City in Q1-Q2 (January through June) 2025, grouped by unit count per filling. Data source: the Department of Buildings. Data aggregation and graphics credit: Vitali D. Ogorodnikov.
Despite its globally recognizable skyline, the metropolitan juggernaut that is New York City is predominantly low-rise in its building makeup, so it is not surprising to see two-family residential filings comprising the largest share (231 permit filings, or 29 percent of the total) of our analyzed residential and hotel (primarily residential) permit counts grouped by building size, as defined by unit count. More curious, however, and encouraging for proponents of high-density residential construction, is that the second-highest category represents building proposals with ten to 49 units (177 permit filings, or 23 percent of the total), which is roughly equivalent in scale to a medium-sized multi-family development or a classic prewar six-story building. In the higher unit-count categories, we tallied a total of 100 new building filings with 50 to 99 units, 46 filings with 100 to 499 units, and two mammoth, high-density filings with 500 units or more.
Below, the filing size categories are listed individually:
- Single-family – 99 permits (13 percent of total)
- Two-family – 231 permits (29 percent of total)
- Three to nine units – 130 permits (17 percent of total)
- Ten to 49 units – 177 permits (23 percent of total)
- 50 to 99 units – 100 permits (13 percent of total)
- 100 to 499 units – 46 permits (6 percent of total)
- 500 units and more – 2 permits (0.3 percent of total)
Below are the top ten permits with the highest unit counts:
- 376 Schermerhorn Street in Brooklyn (521 units)
- 21 Freeman Street in Brooklyn (503 units)
- 1057 Atlantic Avenue in Brooklyn (456 units)
- 935 Erskine Street in Brooklyn (425 units)
- 1674 Boone Avenue in the Bronx (340 units)
- 89 DeKalb Avenue in Brooklyn (324 units)
- 220-28 Jamaica Avenue in Queens (310 units)
- 37 Freeman Street in Brooklyn (298 units)
- 261 Grand Concourse in The Bronx (283 units)
- 450 Powell Street in Brooklyn (283 units)
As seen above, Brooklyn dominates among the five boroughs in terms of large multi-unit filings in the first half of 2025, housing seven out of the top-ten largest unit-count proposals in the city for the time period. Two more filings are found in The Bronx and one more in Queens, pointing to an ongoing shift in large-scale residential development from the city’s core in Manhattan (which did not place in the above-listed Top Ten list at all) toward boroughs long considered peripheral.
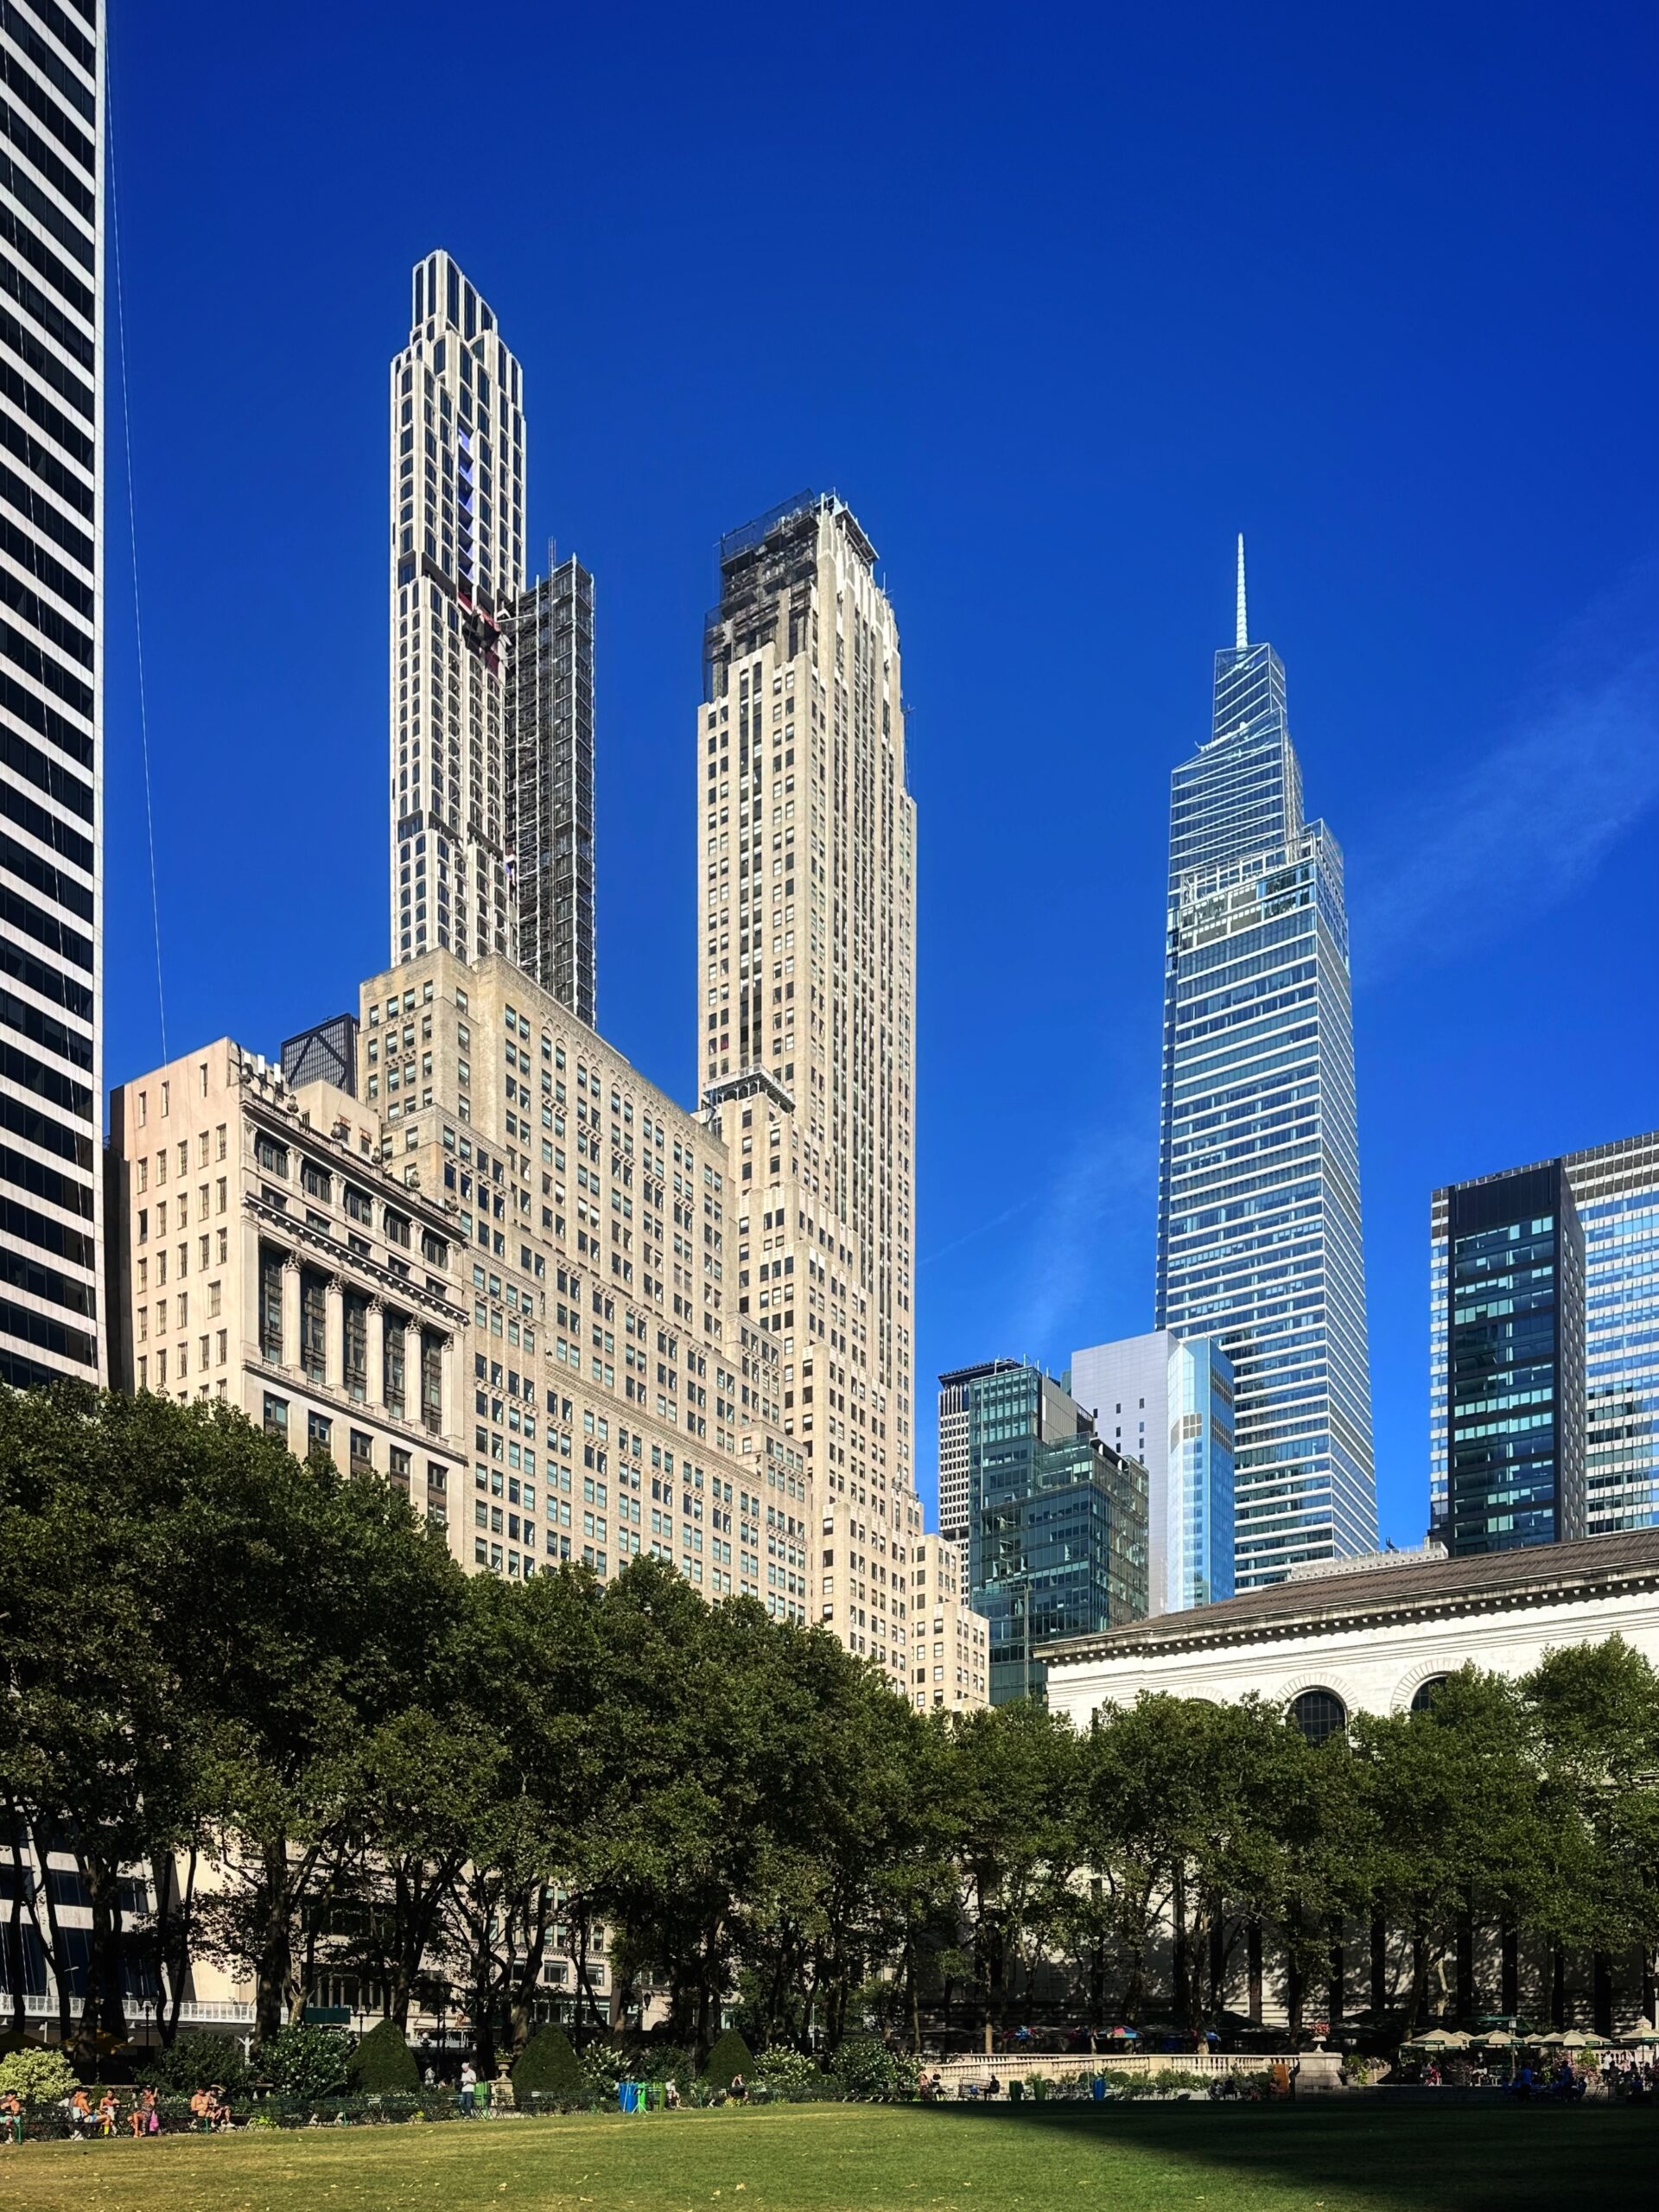
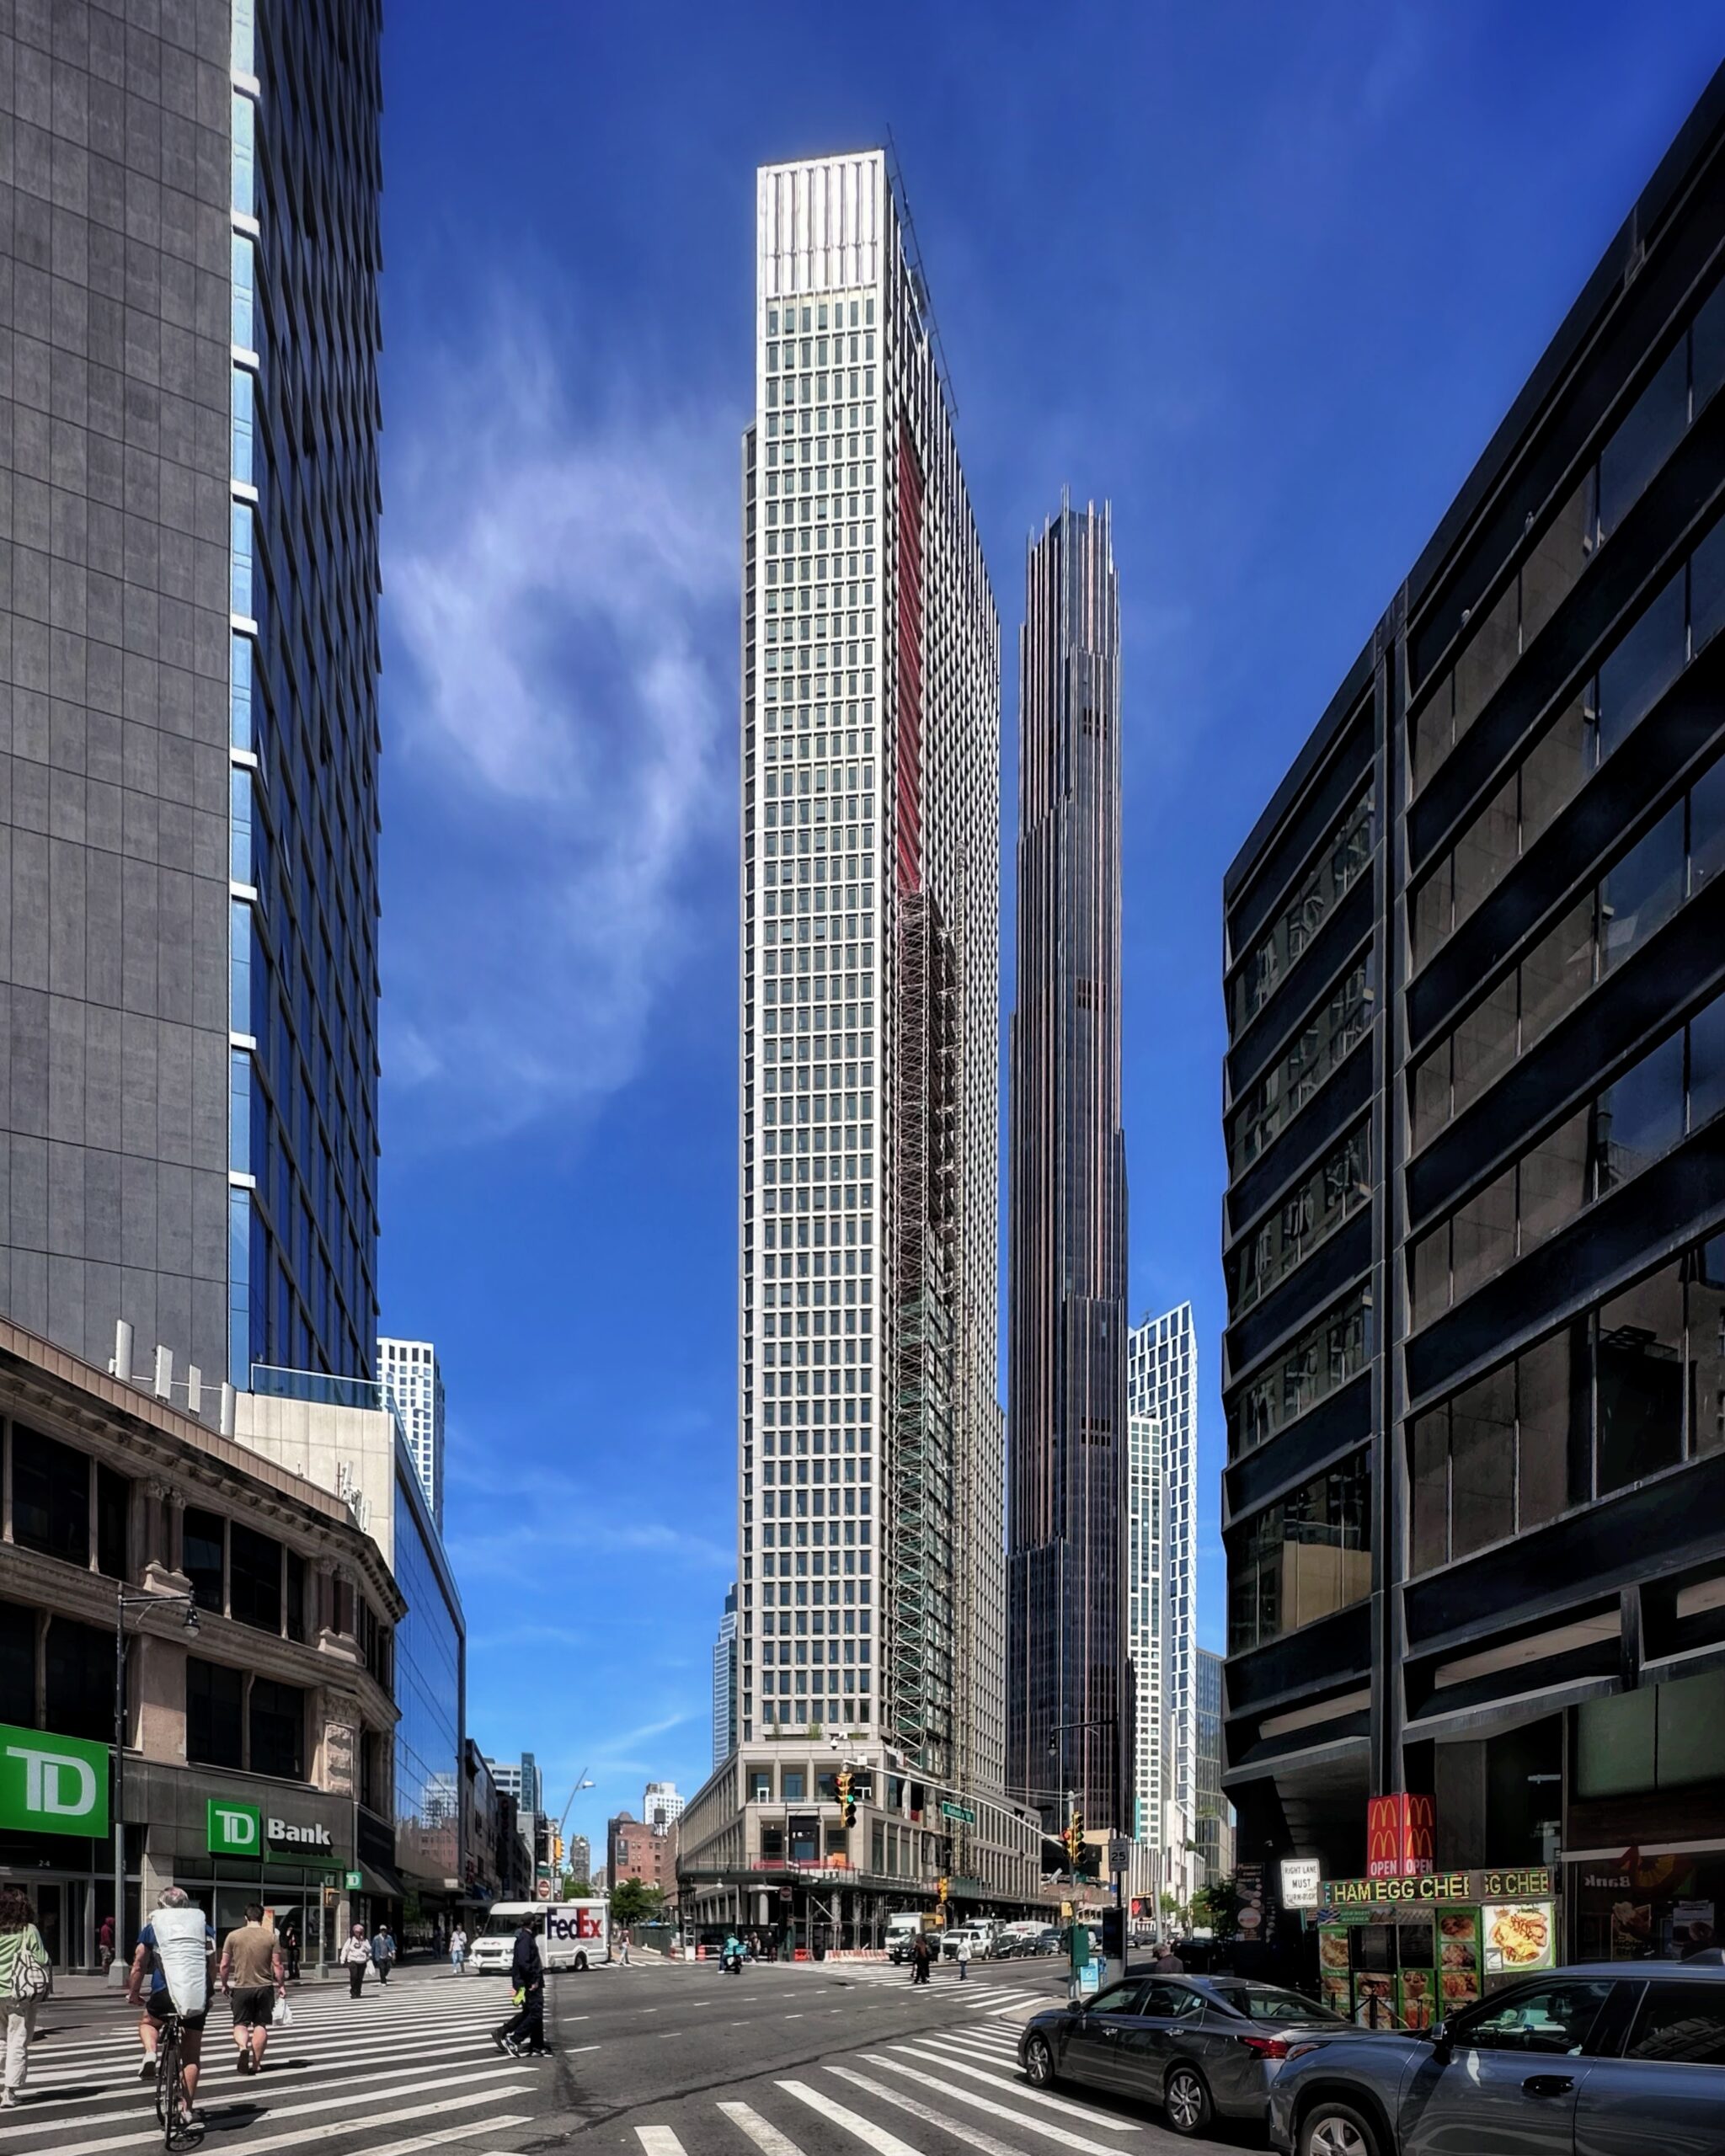
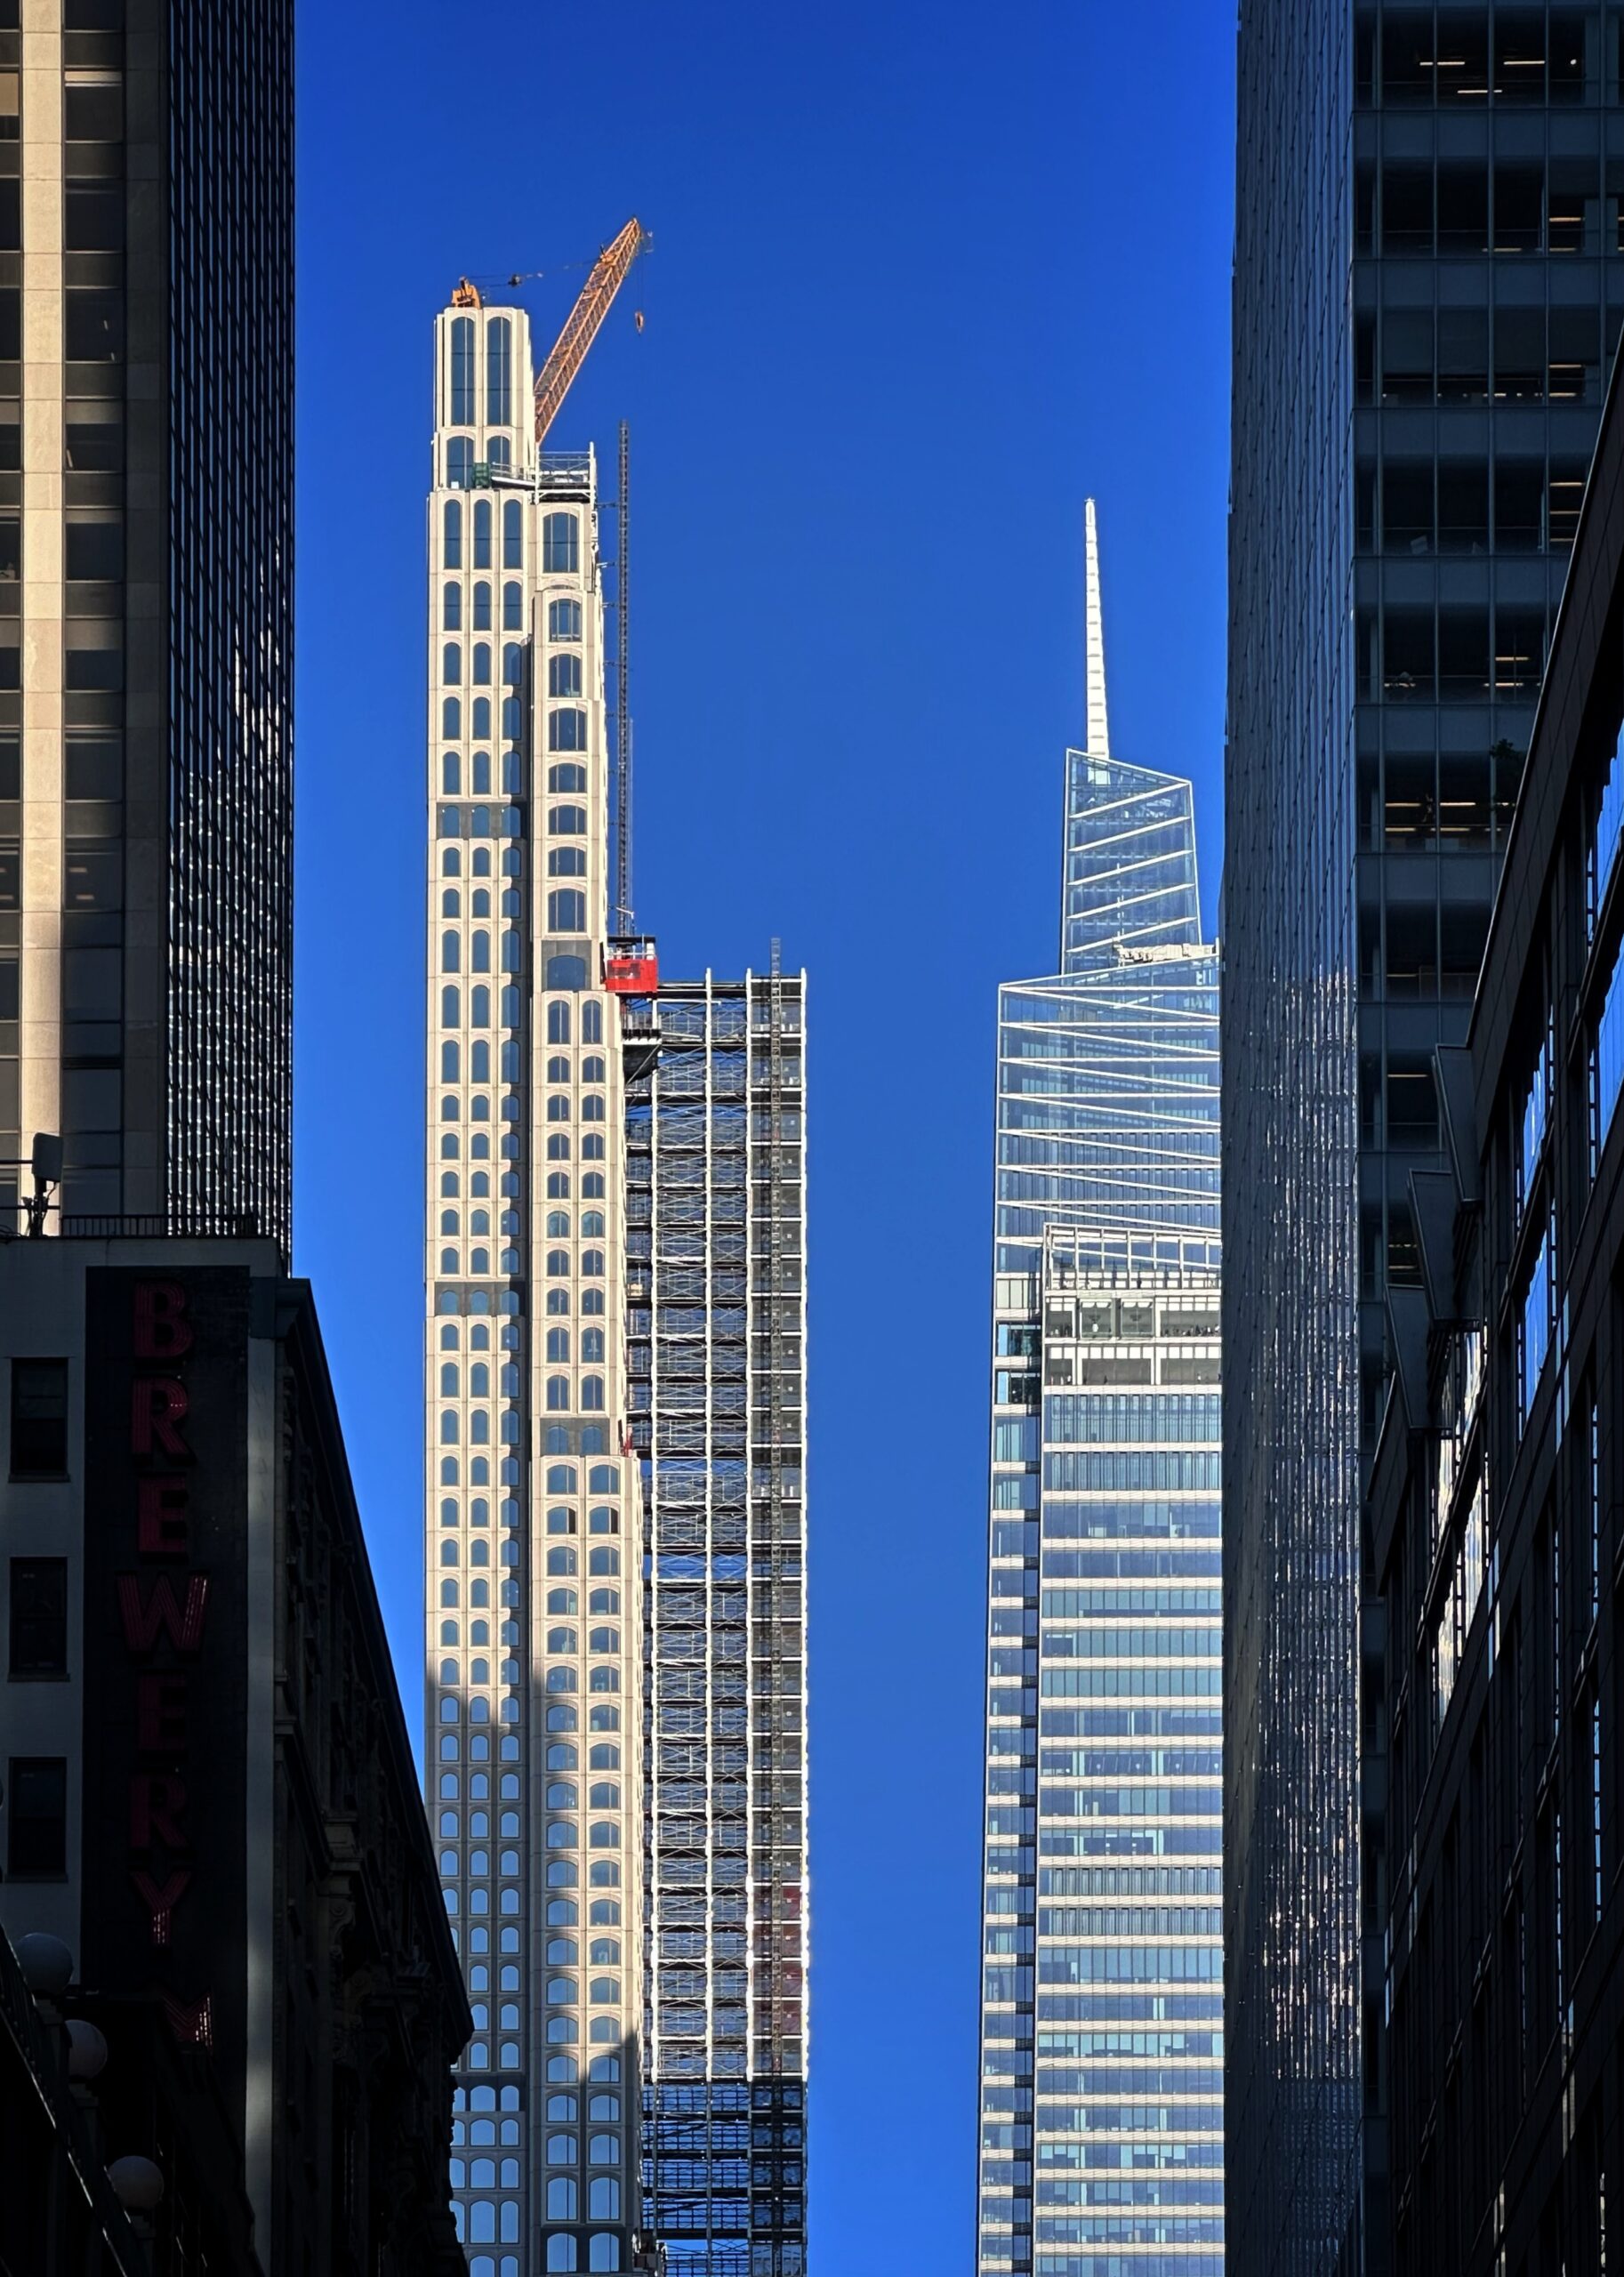
520 Fifth Avenue. Photo by Michael Young.
Residential and hotel units filed per borough
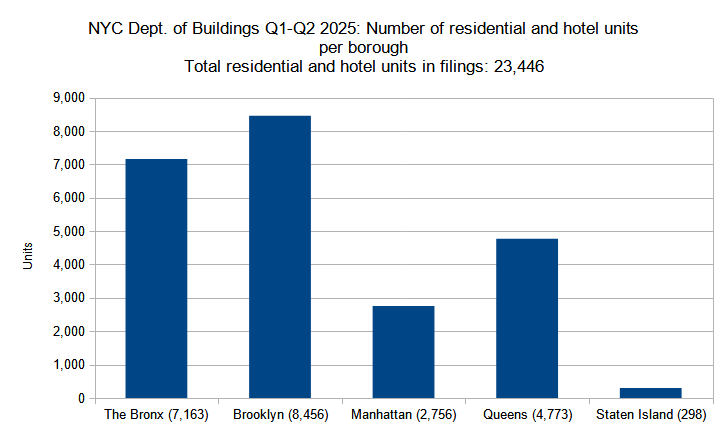
Number of residential and hotel units in new construction permits filed per borough in New York City in Q1-Q2 (January through June) 2025. Data source: the Department of Buildings. Data aggregation and graphics credit: Vitali Ogorodnikov
In the previous analysis, we found that seven out of ten largest new residential and hotel building filings by unit count for Q1 and Q2 2025 were found in Brooklyn. As such, it is unsurprising that the city’s most populous borough also leads in the cumulative number of new unit filings (8,456 units, or 36 percent of the total). The Bronx follows closely behind, with 7,163 filed-for units, followed by Queens (4,773 filings) and Manhattan (2,756 filings). Staten Island’s relatively paltry total of 298 residential filings reflects the borough’s lower-density urban makeup, where almost no filings were registered for new multi-family apartment buildings (with a few notable exceptions, as seen in the chart below) and most of the filings represent detached, suburban-style residential proposals.
Below is a by-borough comparison:
- The Bronx – 7,163 units (31 percent of total)
- Brooklyn – 8,456 units (36 percent of total)
- Manhattan – 2,756 units (12 percent of total)
- Queens – 4,773 units (20 percent of total)
- Staten Island – 298 units (1 percent of total)
Below are the filings with the highest number of units in each borough:
- The Bronx – 1674 Boone Avenue (340 units)
- Brooklyn – 376 Schermerhorn Street (521 units)
- Manhattan – 2435 Frederick Douglas Boulevard (282 units)
- Queens – 220-28 Jamaica Avenue (310 units)
- Staten Island – 541 Bay Street (92 units)
During the first half of the year, Brooklyn was the only borough to break the 500-unit threshold for individual permit filings, with 376 Schermerhorn Street (521 units) as the largest filing. Both Queens and The Bronx made it into the 300-plus-unit category; Manhattan narrowly missed the mark, as its highest-unit-count submission, at 2435 Frederick Douglas Boulevard, incorporates a total of 282 residential units. And while Staten Island predictably trailed in the ranking, the 92-unit proposal at 541 Bay Street is nevertheless impressive for the predominantly low-density, detached-house borough, hopefully indicating a long-awaited shift to higher densities along its key downtown corridors.
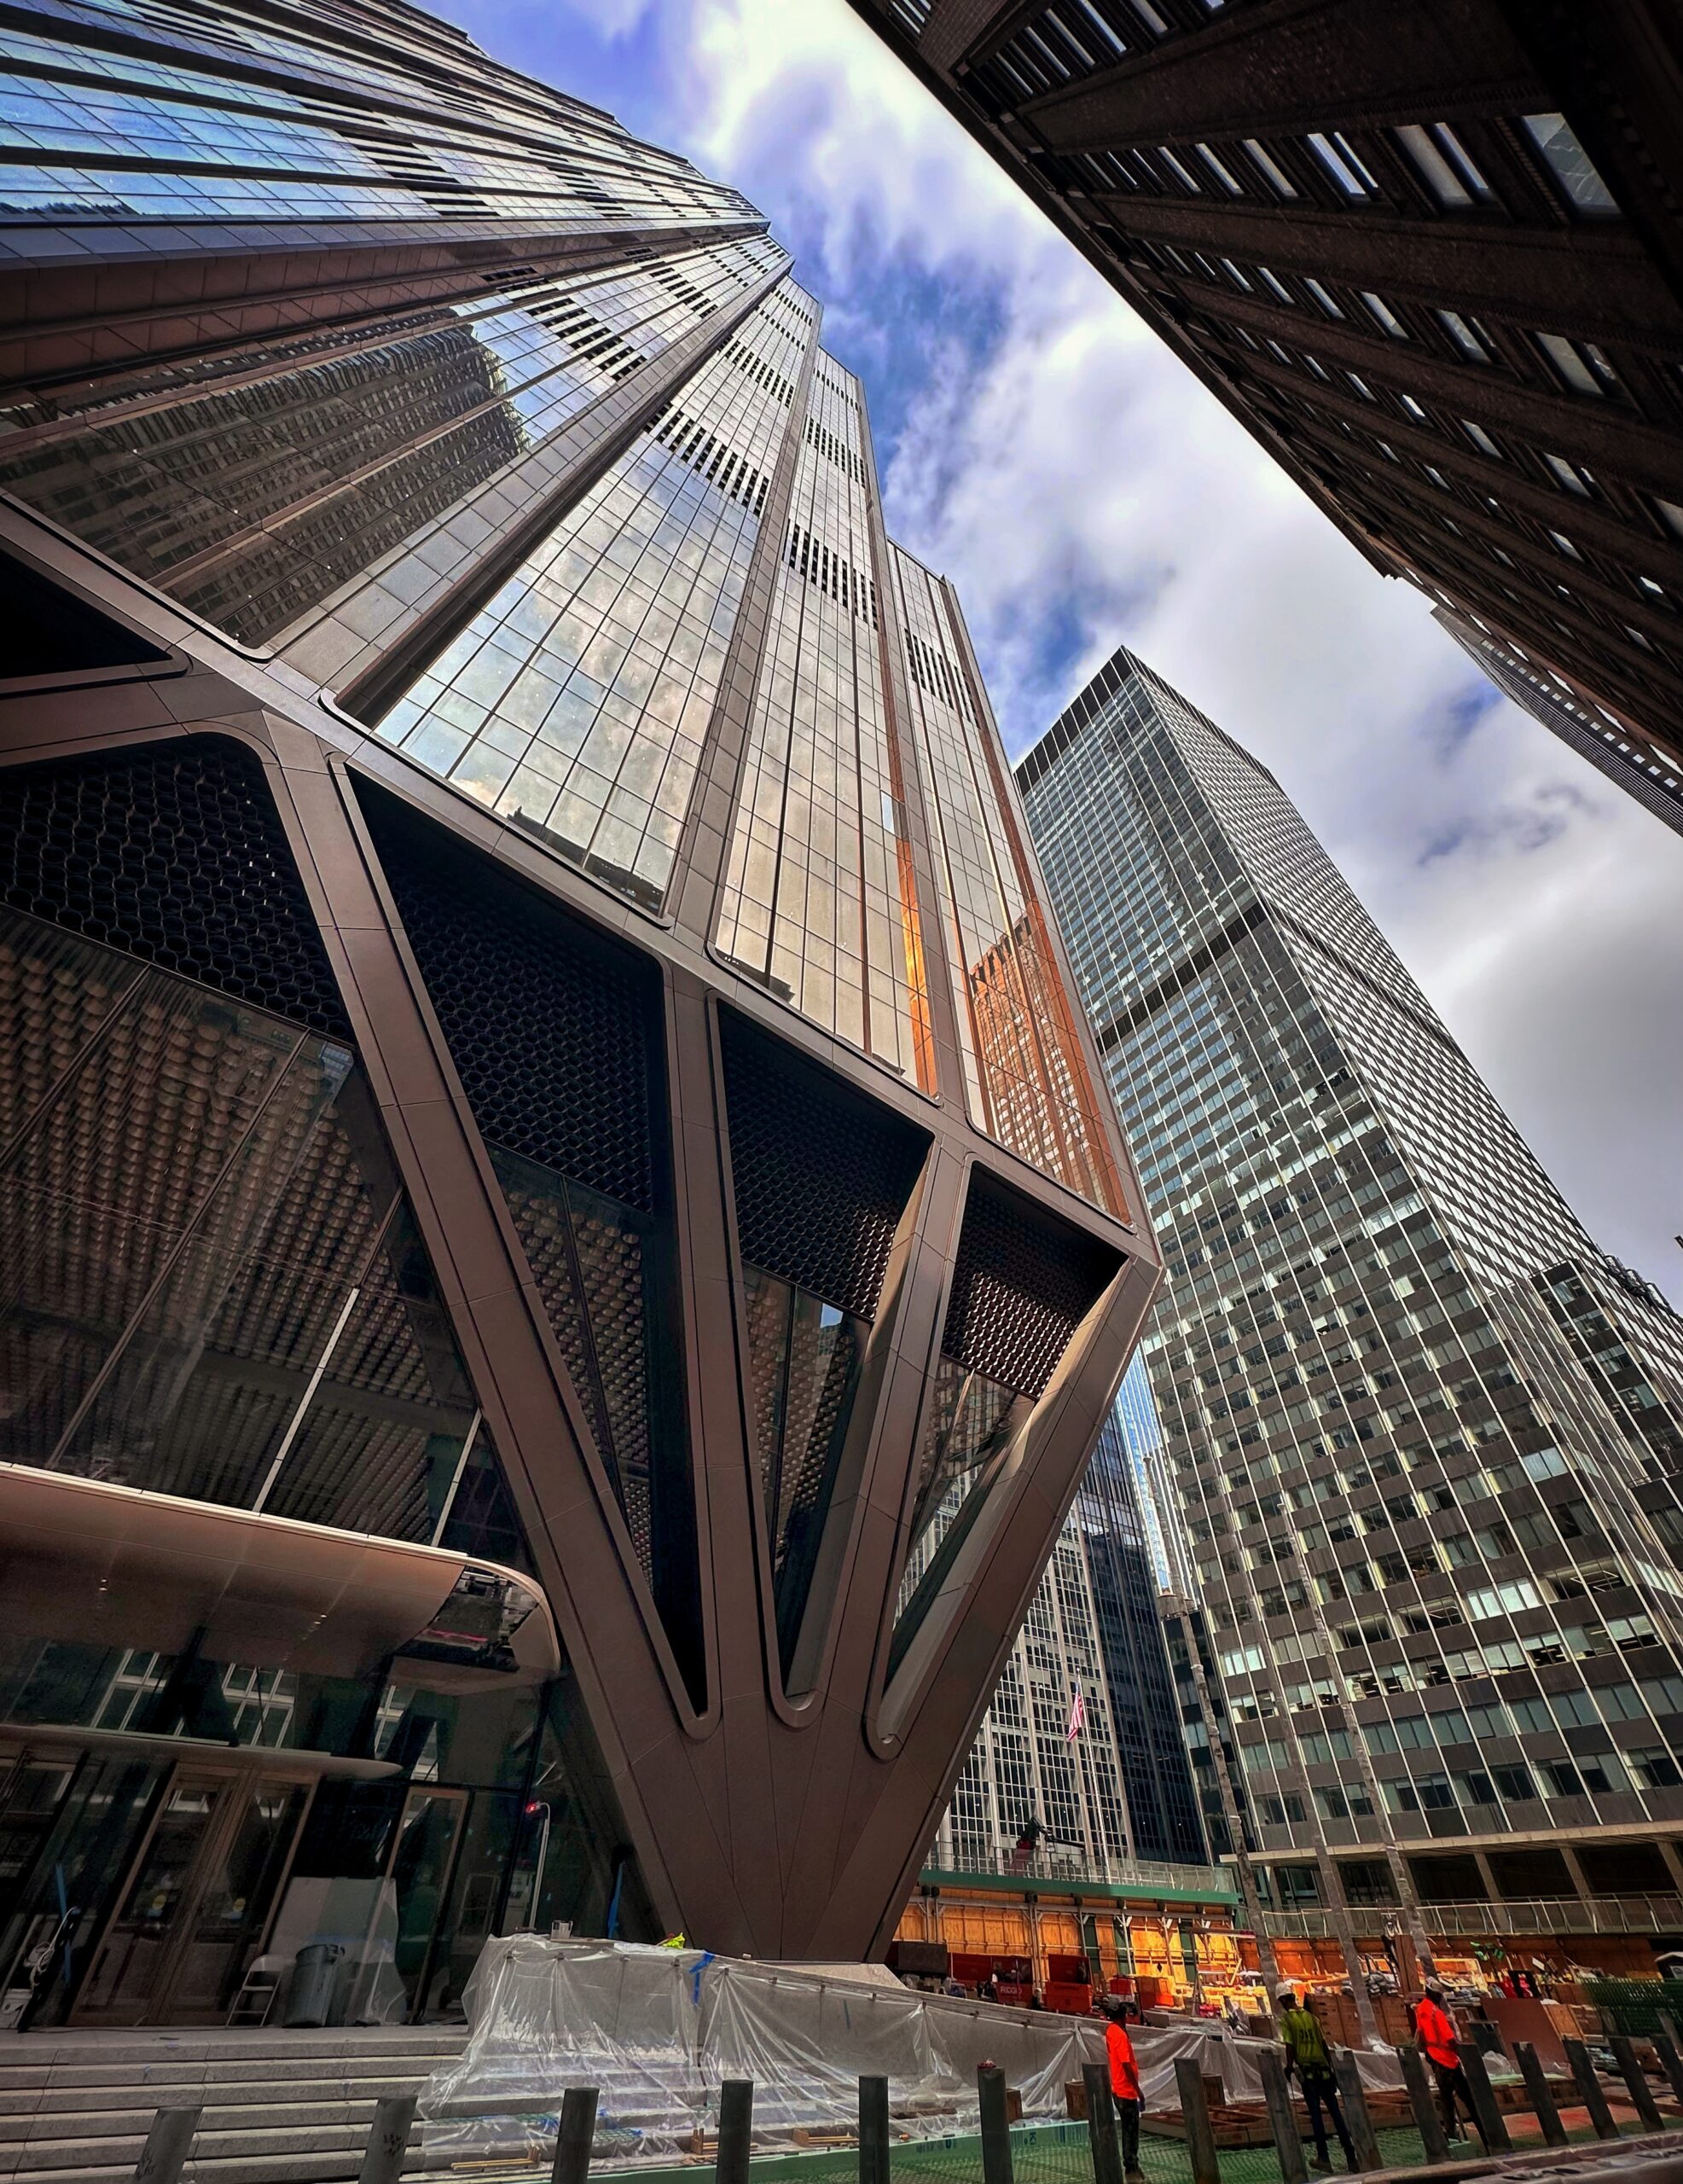
The Torch. Photo by Michael Young.
Permits listed by average unit count per filing
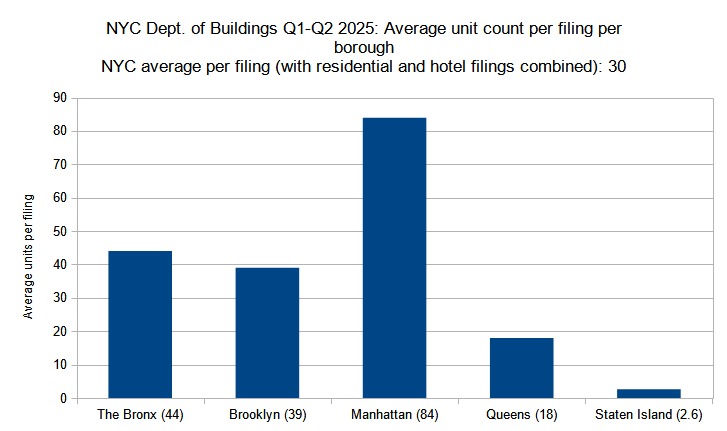
Average unit count (residential and hotel) per new construction permit per borough filed in New York City in Q1-Q2 (January through June) 2025. Data source: the Department of Buildings. Data aggregation and graphics credit: Vitali D. Ogorodnikov.
Brooklyn holds the seven out of ten largest unit-count filings for the first half of 2025. However, as a permit analysis by average unit count per residential or hotel filing shows, Manhattan still decisively leads the pack, with an 84-unit per-filing average that approximately doubles the second- and third-place runners up, which are The Bronx with 44 units per average filing and Brooklyn with 39 units per average filing. With an average of 18 units, the average residential or hotel filing in Queens holds around half the units of the average filing in The Bronx or Brooklyn, and just under a quarter of those found in Manhattan, a number that sets it squarely into the second-to-last place among the boroughs yet still shows a seven-fold advantage over Staten Island’s average count of 2.6 residential units per filing.
Below is a by-borough comparison:
- The Bronx – 44 units per filing (47 percent above borough average)
- Brooklyn – 39 units per filing (30 percent above borough average)
- Manhattan – 84 units per filing (180 percent above borough average)
- Queens – 18 units per filing (40 percent below borough average)
- Staten Island – 2.6 units per filing (91 percent below borough average)
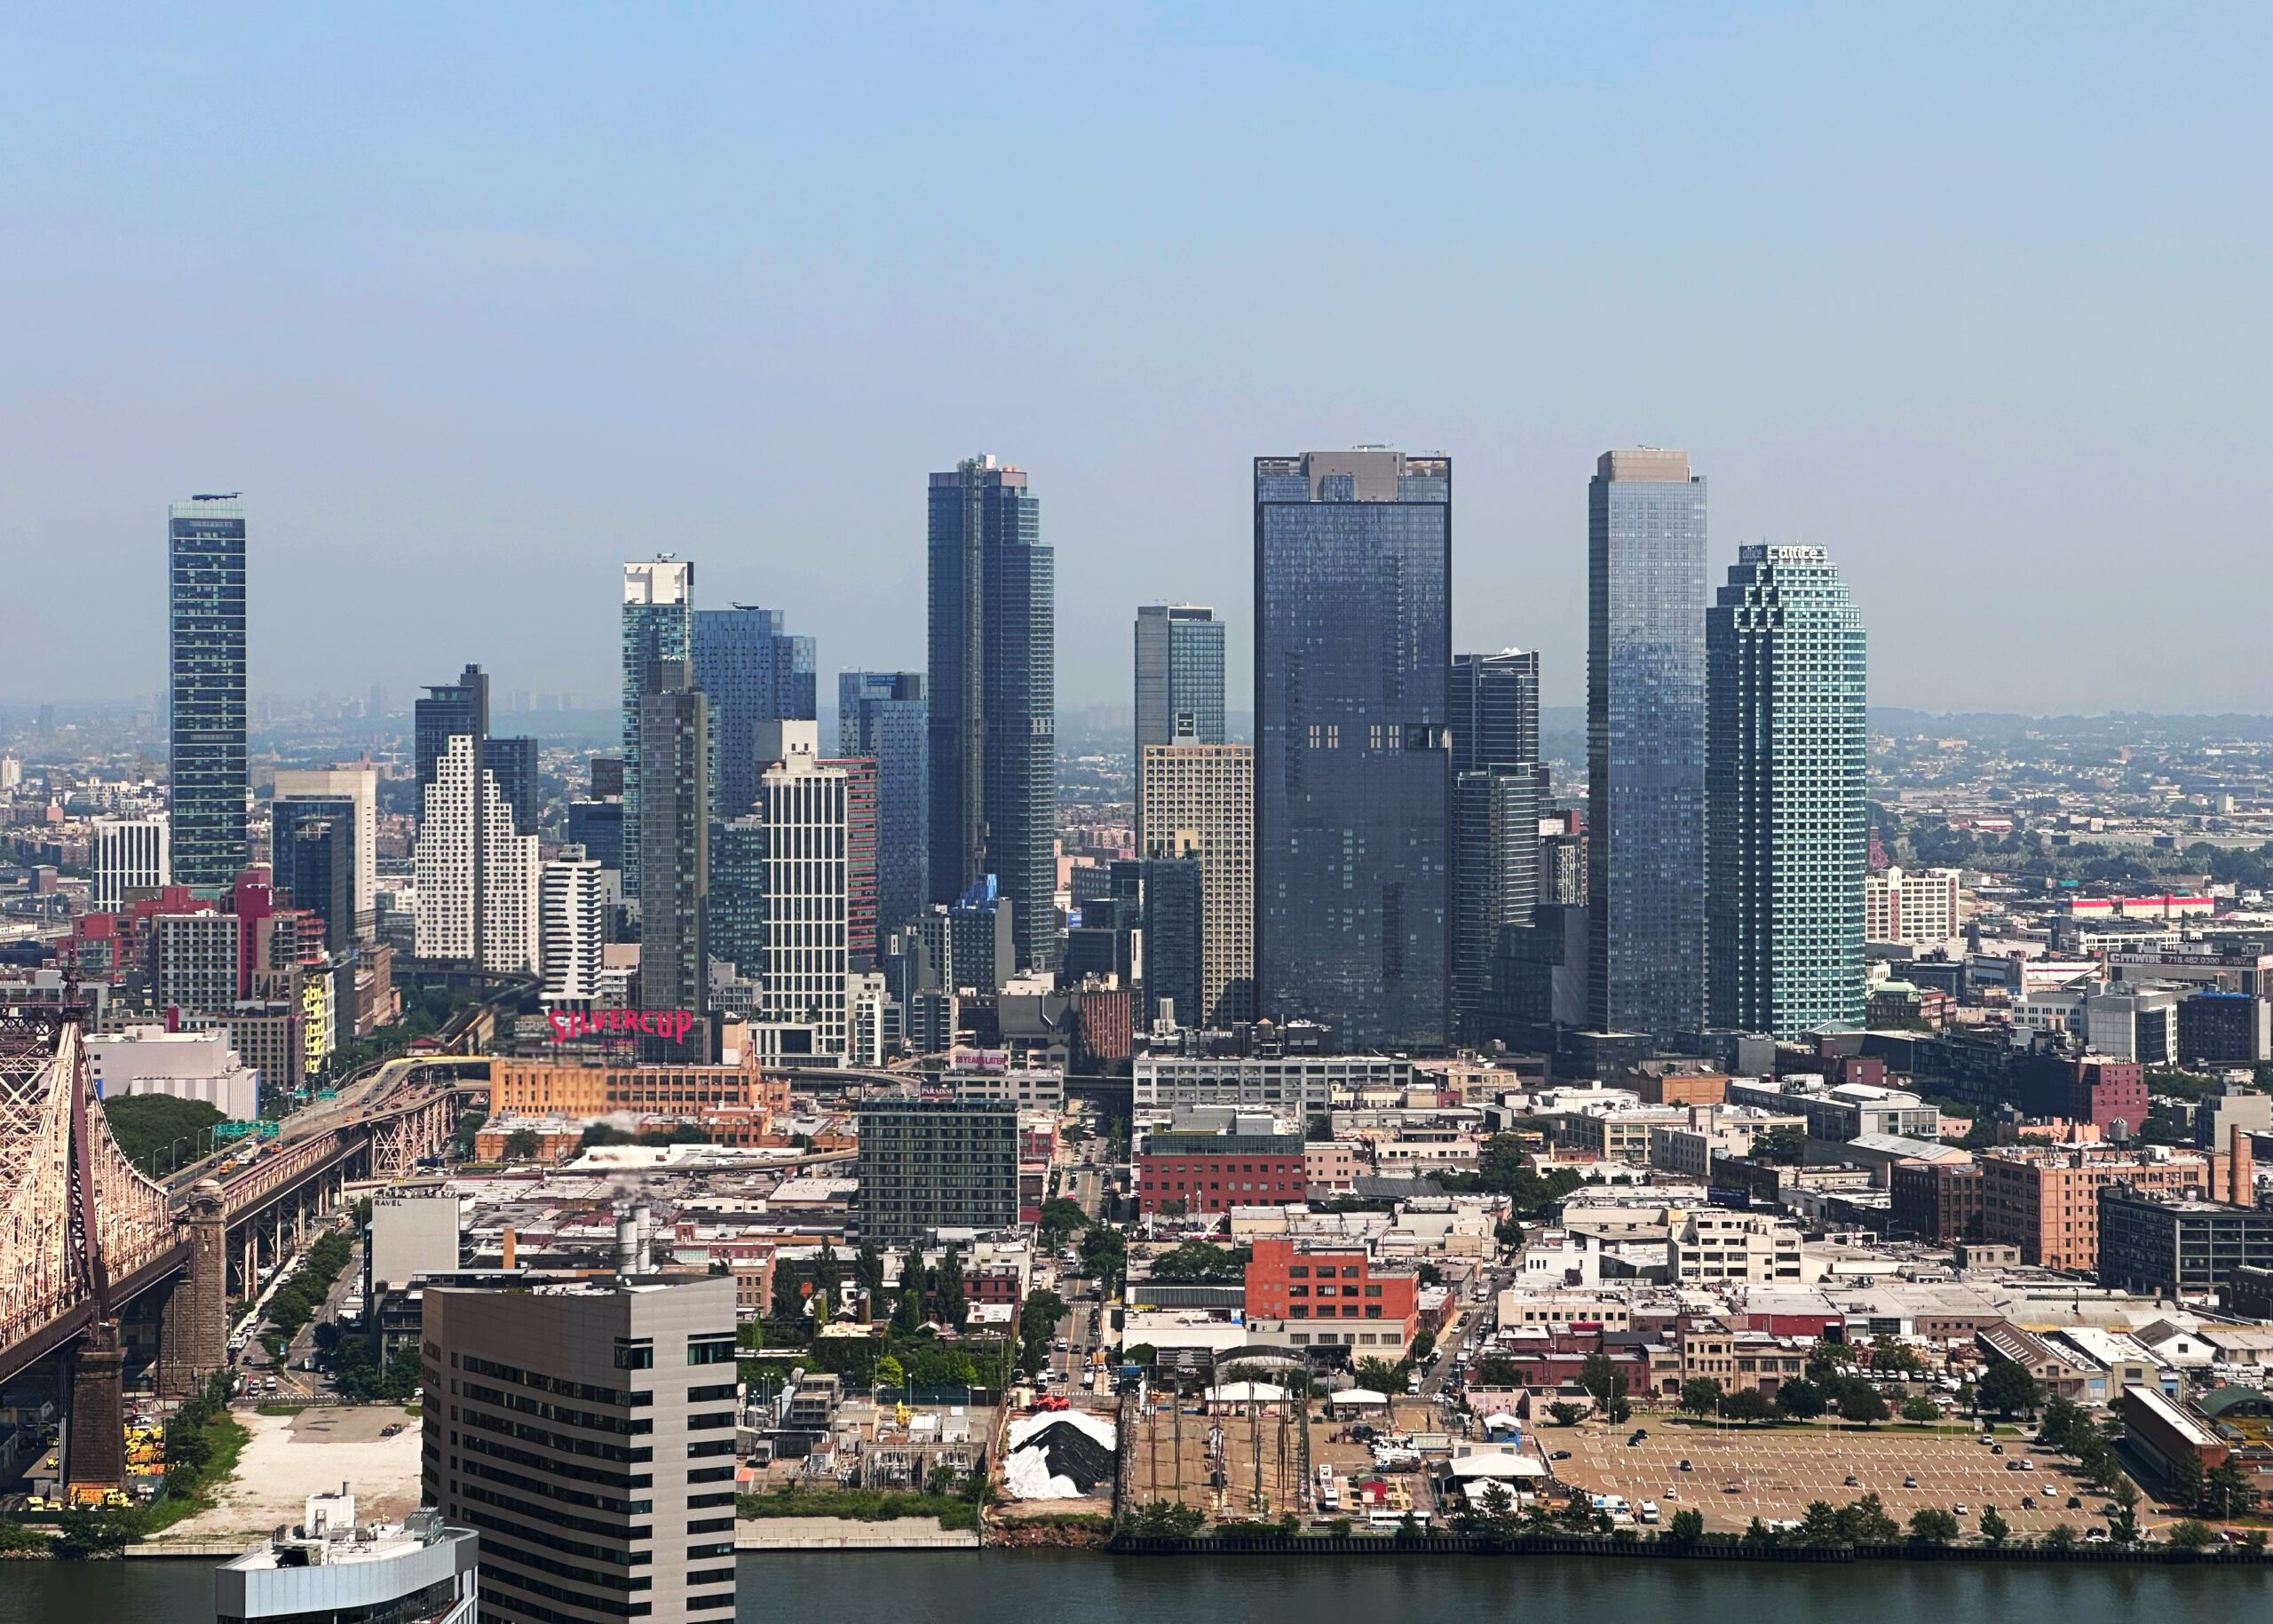
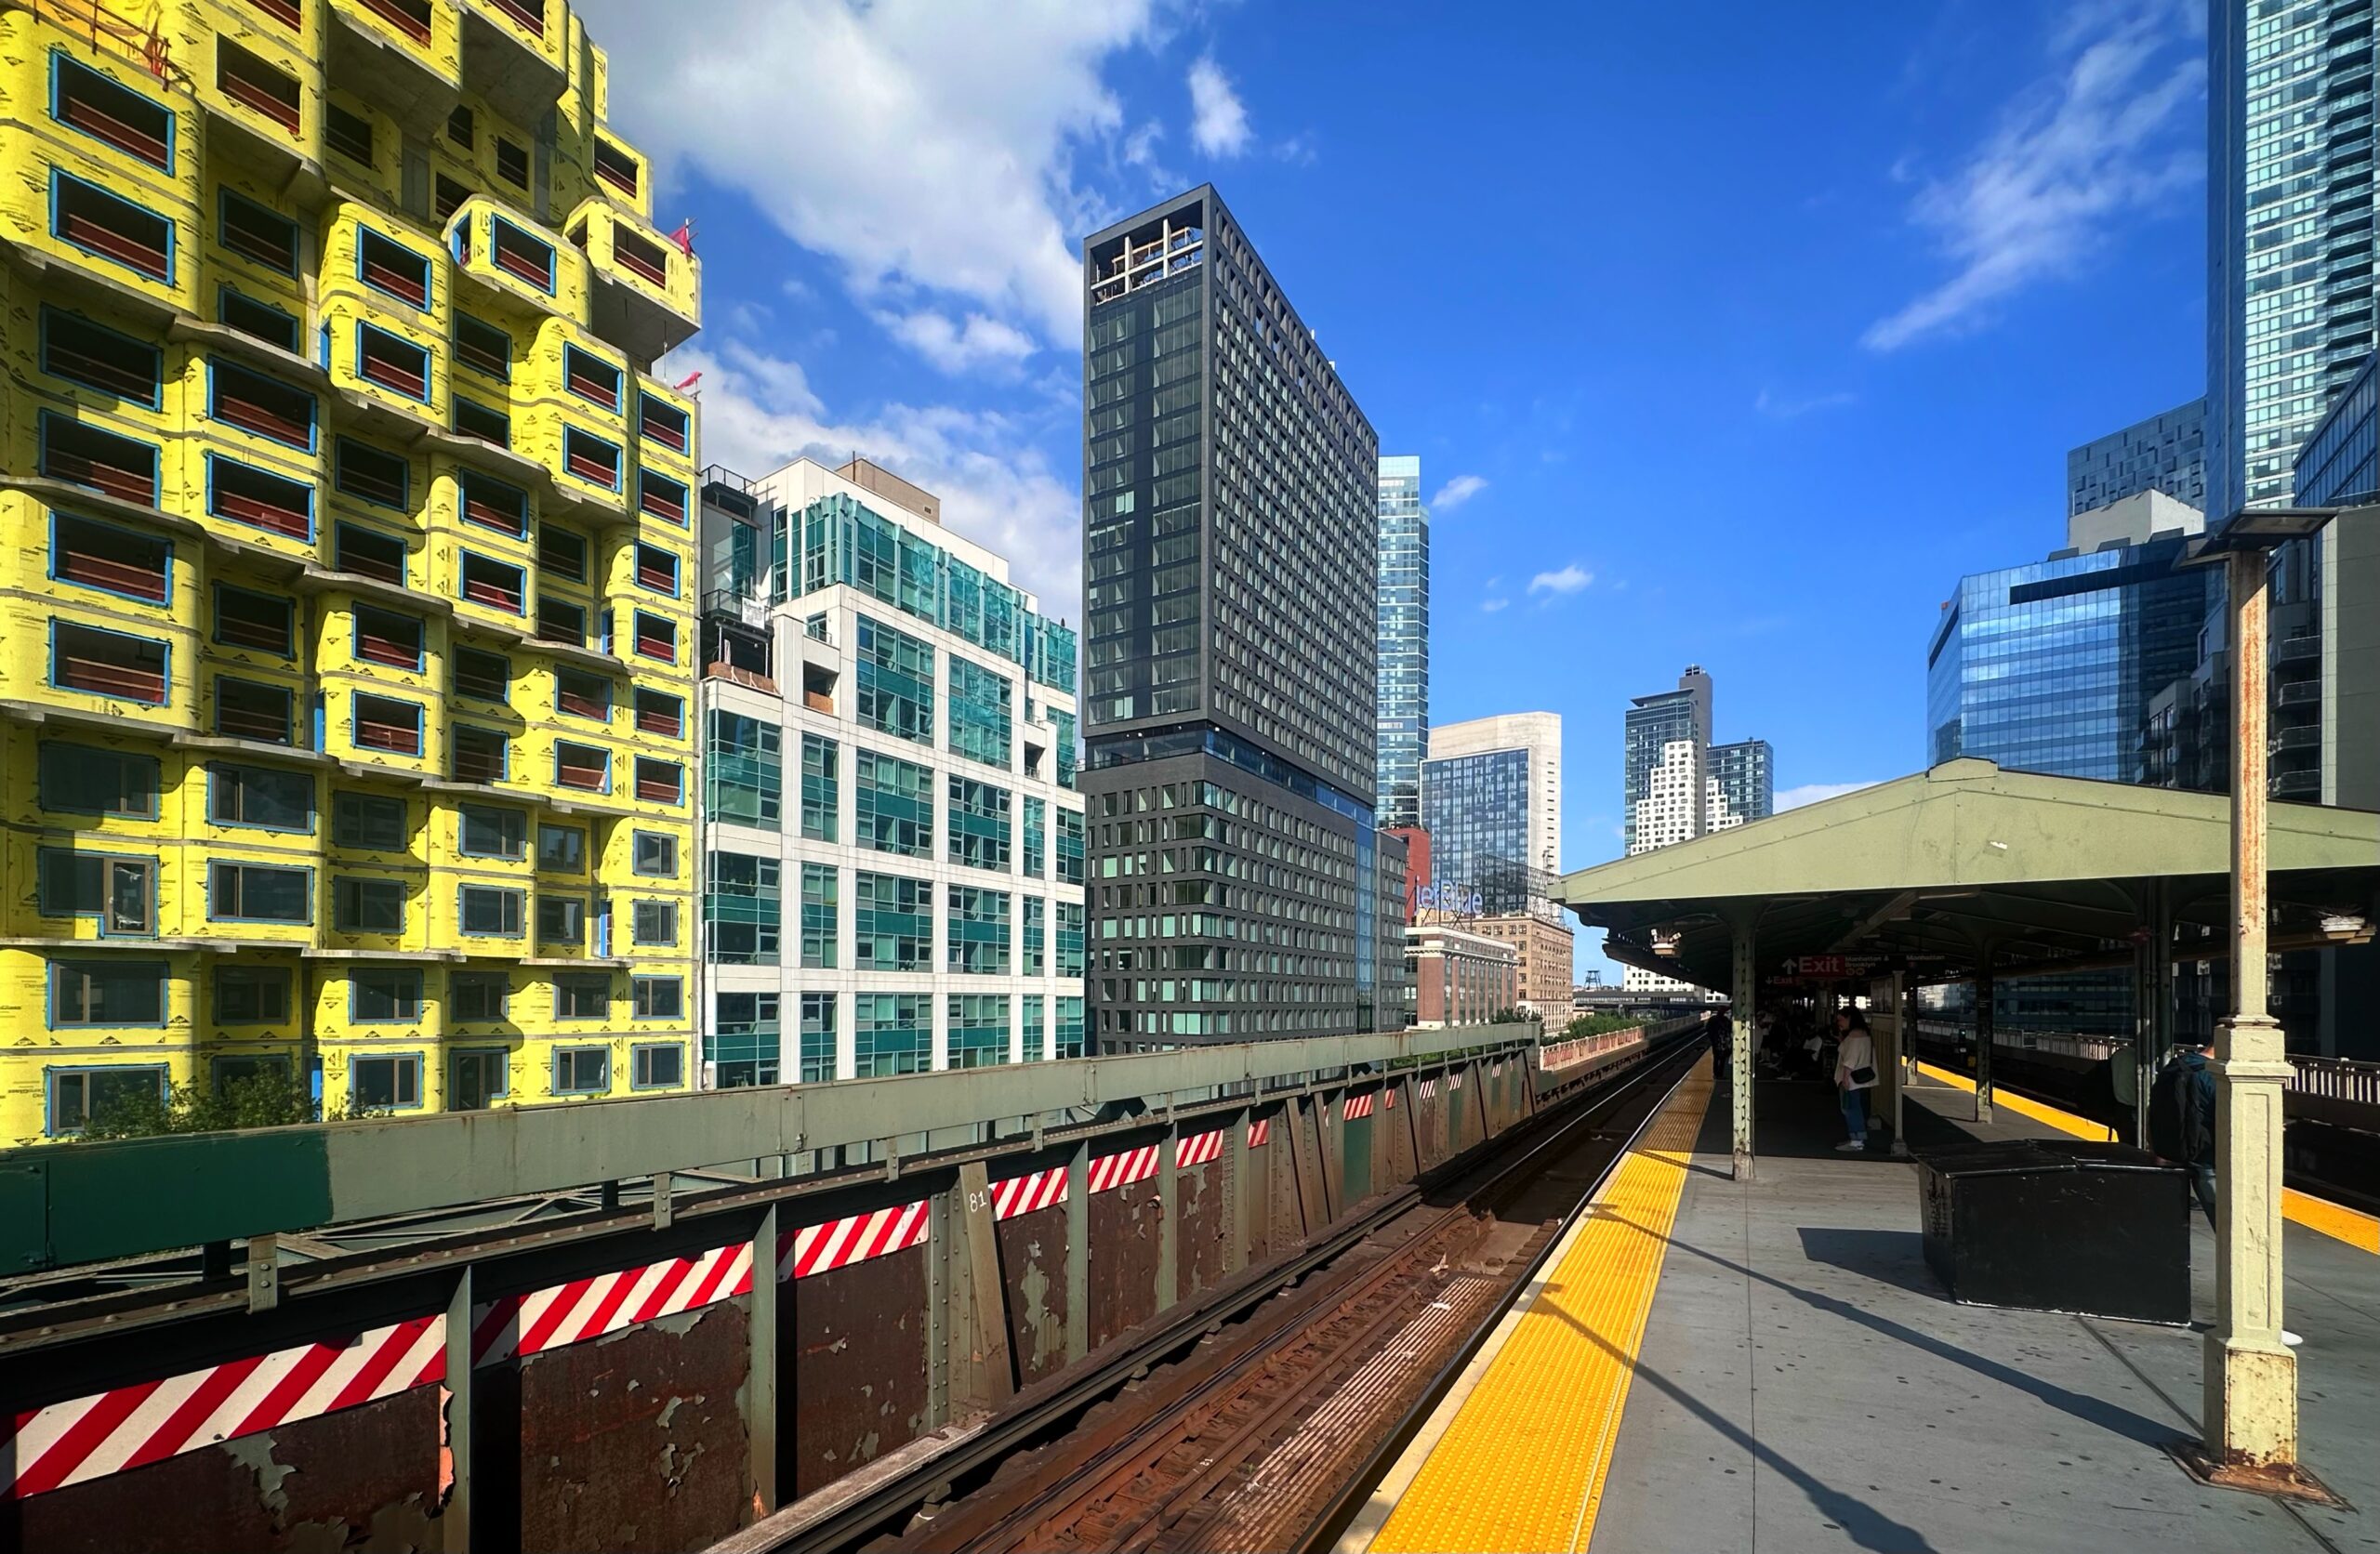
Lumen LIC. Photo by Michael Young.
Permit filings by floor count category
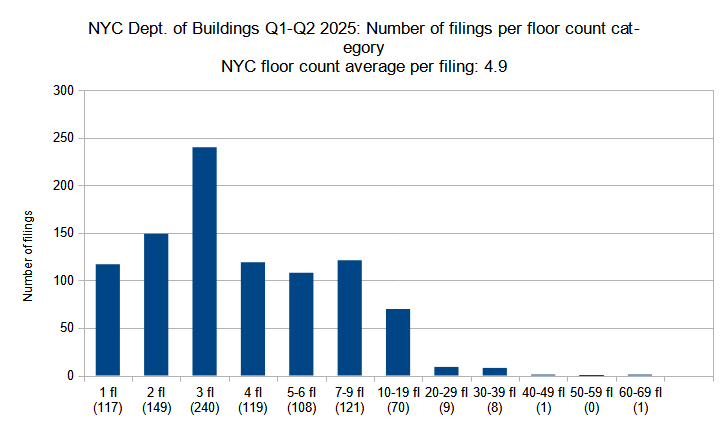
New construction permits filed in New York City in Q1-Q2 (January through June) 2025, grouped by floor count. Data source: the Department of Buildings. Data aggregation and graphics credit: Vitali D. Ogorodnikov.
While New York City remains a predominantly low-rise city despite its ever-growing skyline, it also sees a relatively high number of mid-rise, “missing middle” housing filings that are so frequently absent from many American cities. These findings are reflected in the new building filing submissions for the first half of 2025. The largest floor-count permit category reflects buildings projected to rise three stories high, with 240 filings within the group. However, each of the six categories representing buildings between one and nine stories in height registers triple-digit filing counts, and the following category, which groups buildings projected to rise from ten to 19 stories, follows closely behind with a total of 70 filings.
In the higher floor-count categories, the second quarter of 2025 registered a total of nine filings in the 20- to 29-story range, eight measuring 30 to 39 floors, and one each in the 40–49- and 60–69-floor categories.
Below is a comparison per floor-count category between the two quarters:
- Single-story – 117 permits (12 percent of total)
- Two-story – 149 permits (16 percent of total)
- Three-story – 240 permits (25 percent of total)
- Four-story – 119 permits (13 percent of total)
- Five to six floors – 108 permits (11 percent of total)
- Seven to nine floors – 121 permits (13 percent of total)
- Ten to 19 floors – 70 permits (7 percent of total)
- 20 to 29 floors – 9 permits (1 percent of total)
- 30 to 39 floors – 8 permits (0.9 percent of total)
- 40 to 49 floors – 1 permit (0.1 percent of total)
- 50 to 59 floors – 0 permits
- 60 to 69 floors – 1 permit (0.1 percent of total)
Below are the top ten permit filings, in order:
- 376 Schermerhorn Street in Brooklyn (62 floors)
- 21 Freeman Street in Brooklyn (40 floors)
- 413 9th Avenue in Manhattan (34 floors)
- 185 East 80th Street in Manhattan (34 floors)
- 250 East 83th Street in Manhattan (32 floors)
- 1026 3rd Avenue in Manhattan (31 floors)
- 5 West 13th Street in Manhattan (30 floors)
- 16 West 45th Street in Manhattan (30 floors)
- 89 DeKalb Avenue in Brooklyn (30 floors)
- 37 Freeman Street in Brooklyn (30 floors)
As seen above, Manhattan and Brooklyn dominate the top-ten highest floor-count filings, with six filings in the former and four in the latter.
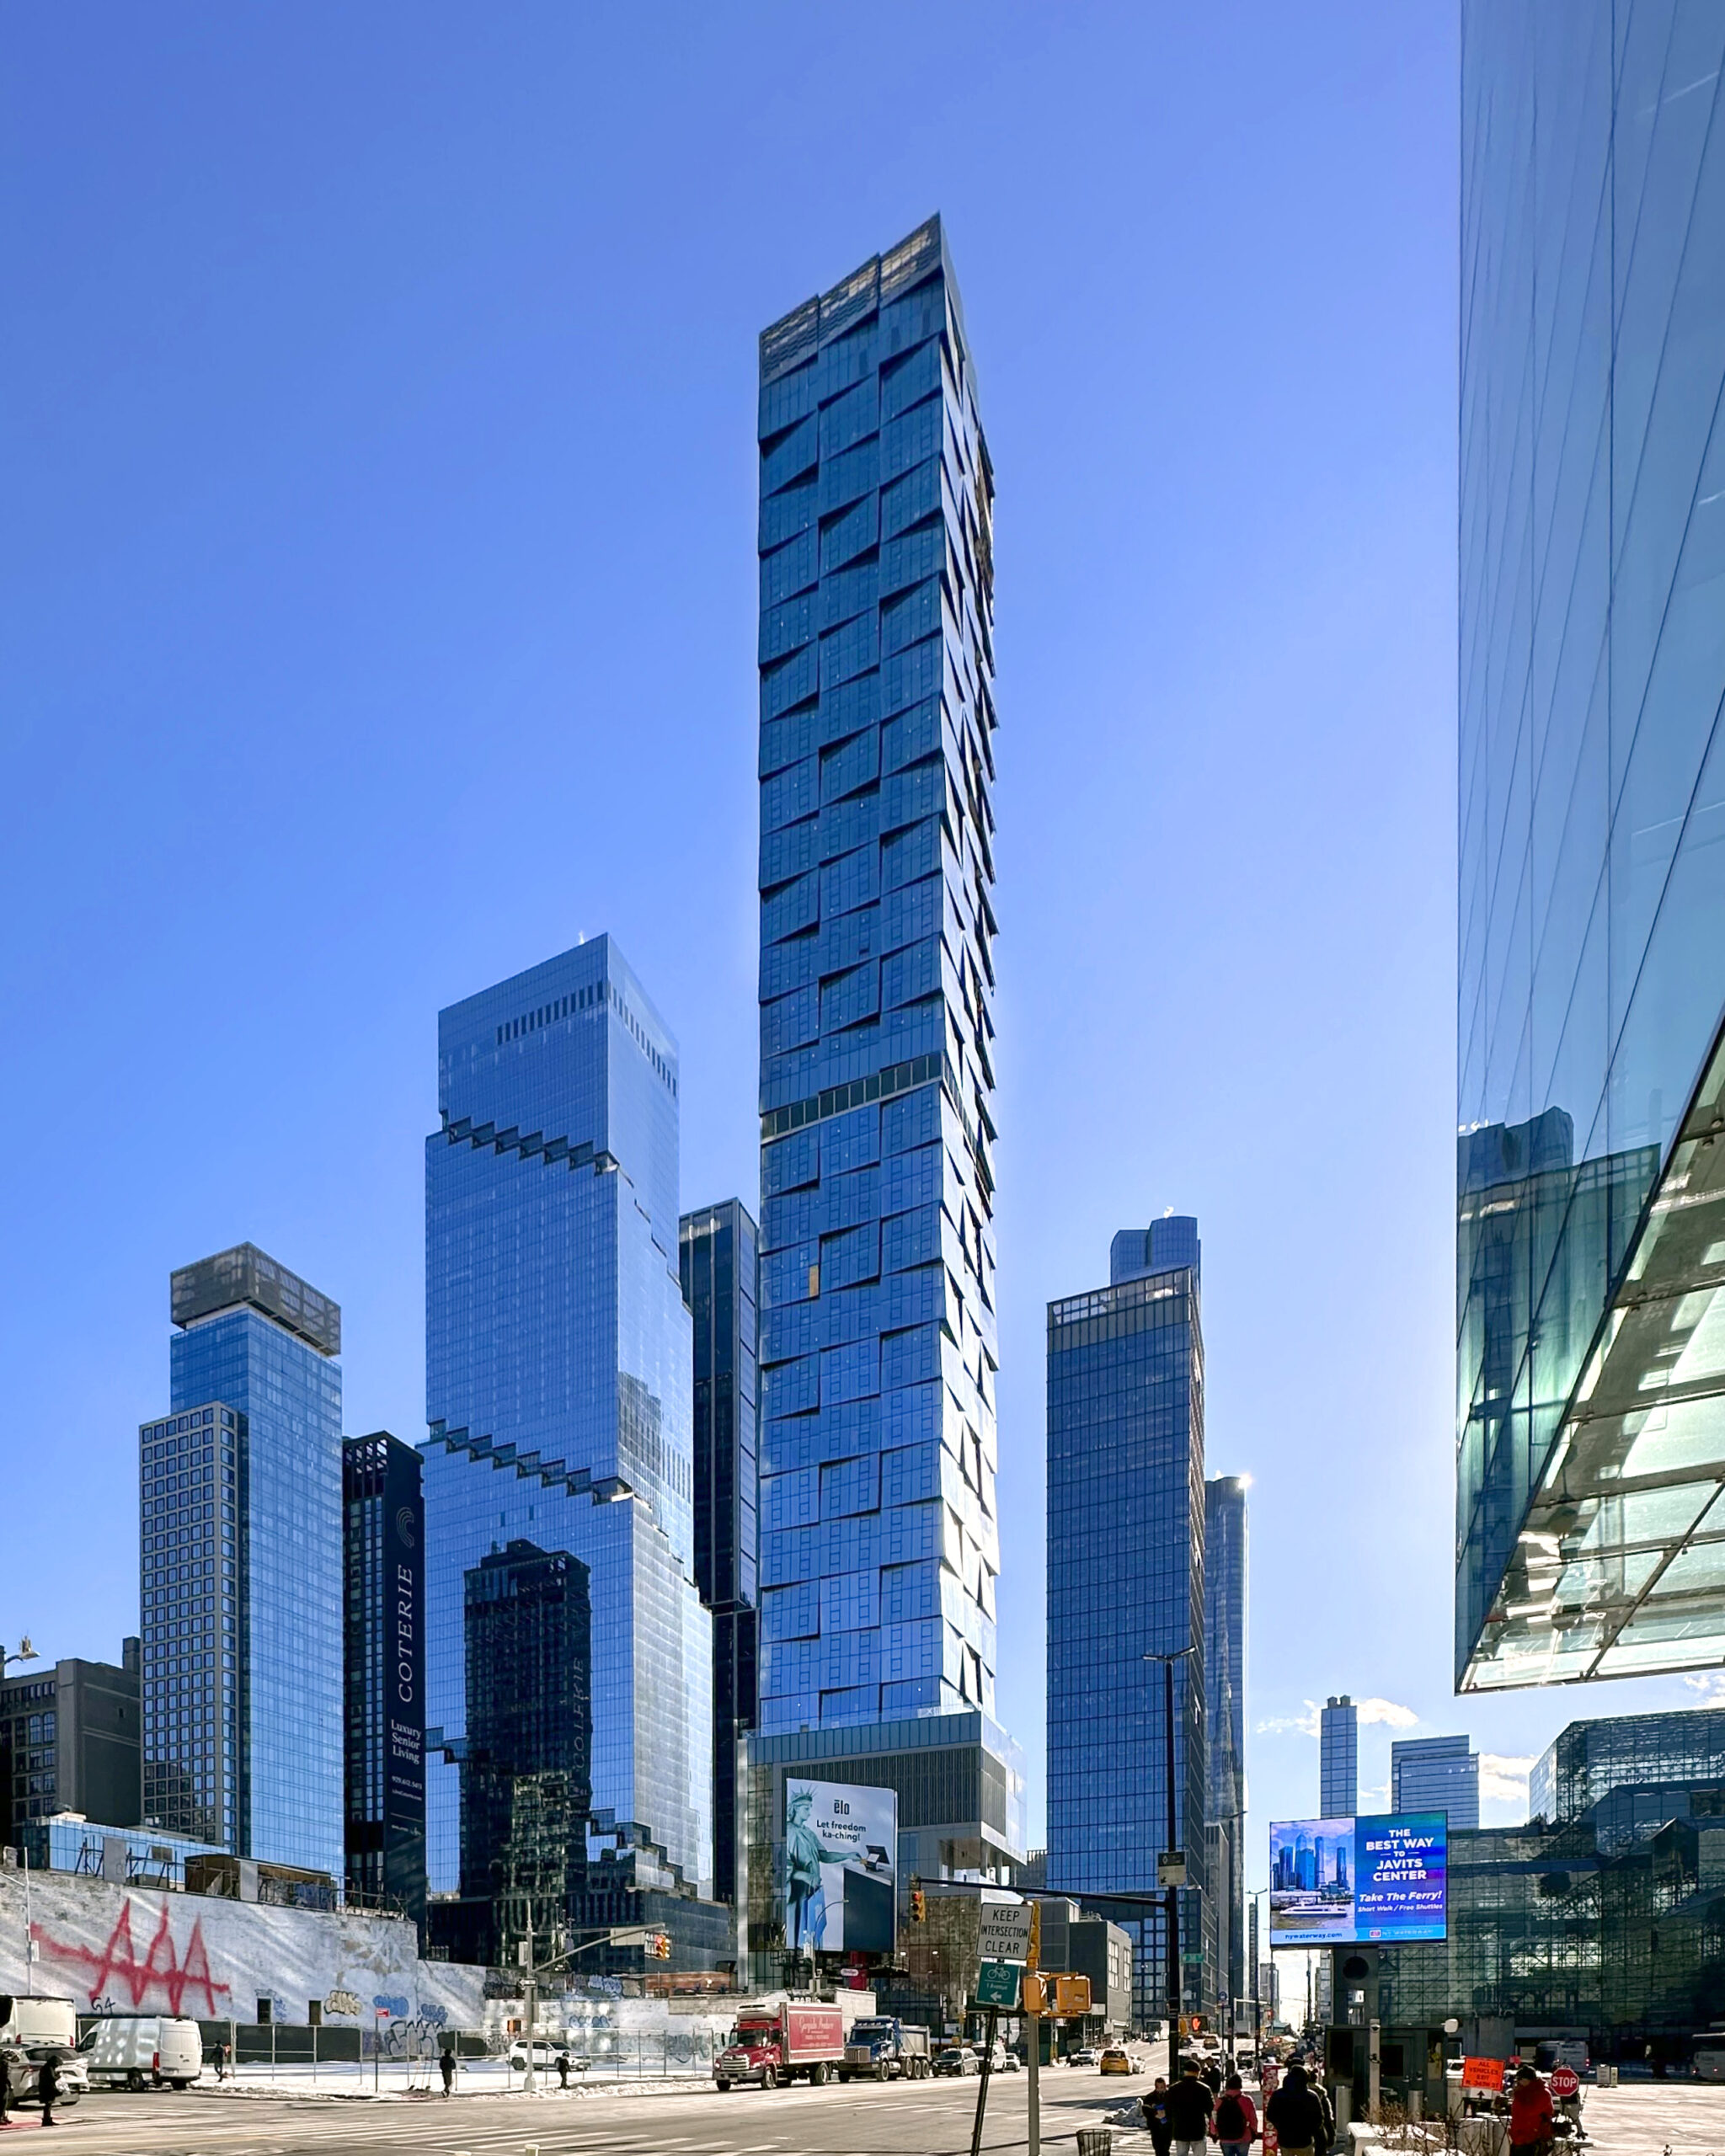
Photo by Michael Young.
Average number of floors per filing per borough
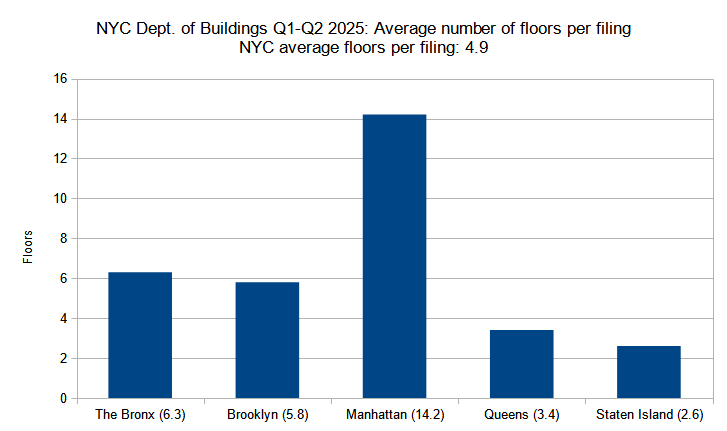
Average number of floors per new construction permit per borough filed in New York City in Q1-Q2 (January through June) 2025. Data source: the Department of Buildings. Data aggregation and graphics credit: Vitali D. Ogorodnikov.
As expected for the city’s most densely built-up borough, Manhattan registers the highest average floor count per average filing, at 14.2 average floors. The Bronx and Brooklyn compete in a tight race for the second place, with averages of 6.3 and 5.8 stories per borough, respectively, both well above the city’s borough average of 4.9 floors. Queens trails behind with an average of 3.4 stories per filing, with Staten Island rounding off the group with an average of 2.6 floors per average new building filing.
Below is the by-borough comparison:
- The Bronx – 6.3 floors (29 percent above city average)
- Brooklyn – 5.8 floors (18 percent above city average)
- Manhattan – 14.2 floors (190 percent above city average)
- Queens – 3.4 floors (31 percent below city average)
- Staten Island – 2.6 floors (47 percent below city average)
The following are the permit filings in each borough with the highest floor counts:
- The Bronx – 1674 Boone Avenue (18 floors)
- Brooklyn – 376 Schermerhorn Street (62 floors)
- Manhattan – 413 Ninth Avenue (34 floors)
- Queens – 138-32 Northern Boulevard (17 floors)
- Staten Island – 541 Bay Street (7 floors)
Of the five boroughs, Brooklyn is the only one to surpass the 60-story threshold, with a 62-story new building filing at 376 Schermerhorn Street. Manhattan is the runner-up, with a 34-story filing at 413 Ninth Avenue. None of the remaining three boroughs registered any filings rising above 20 stories.
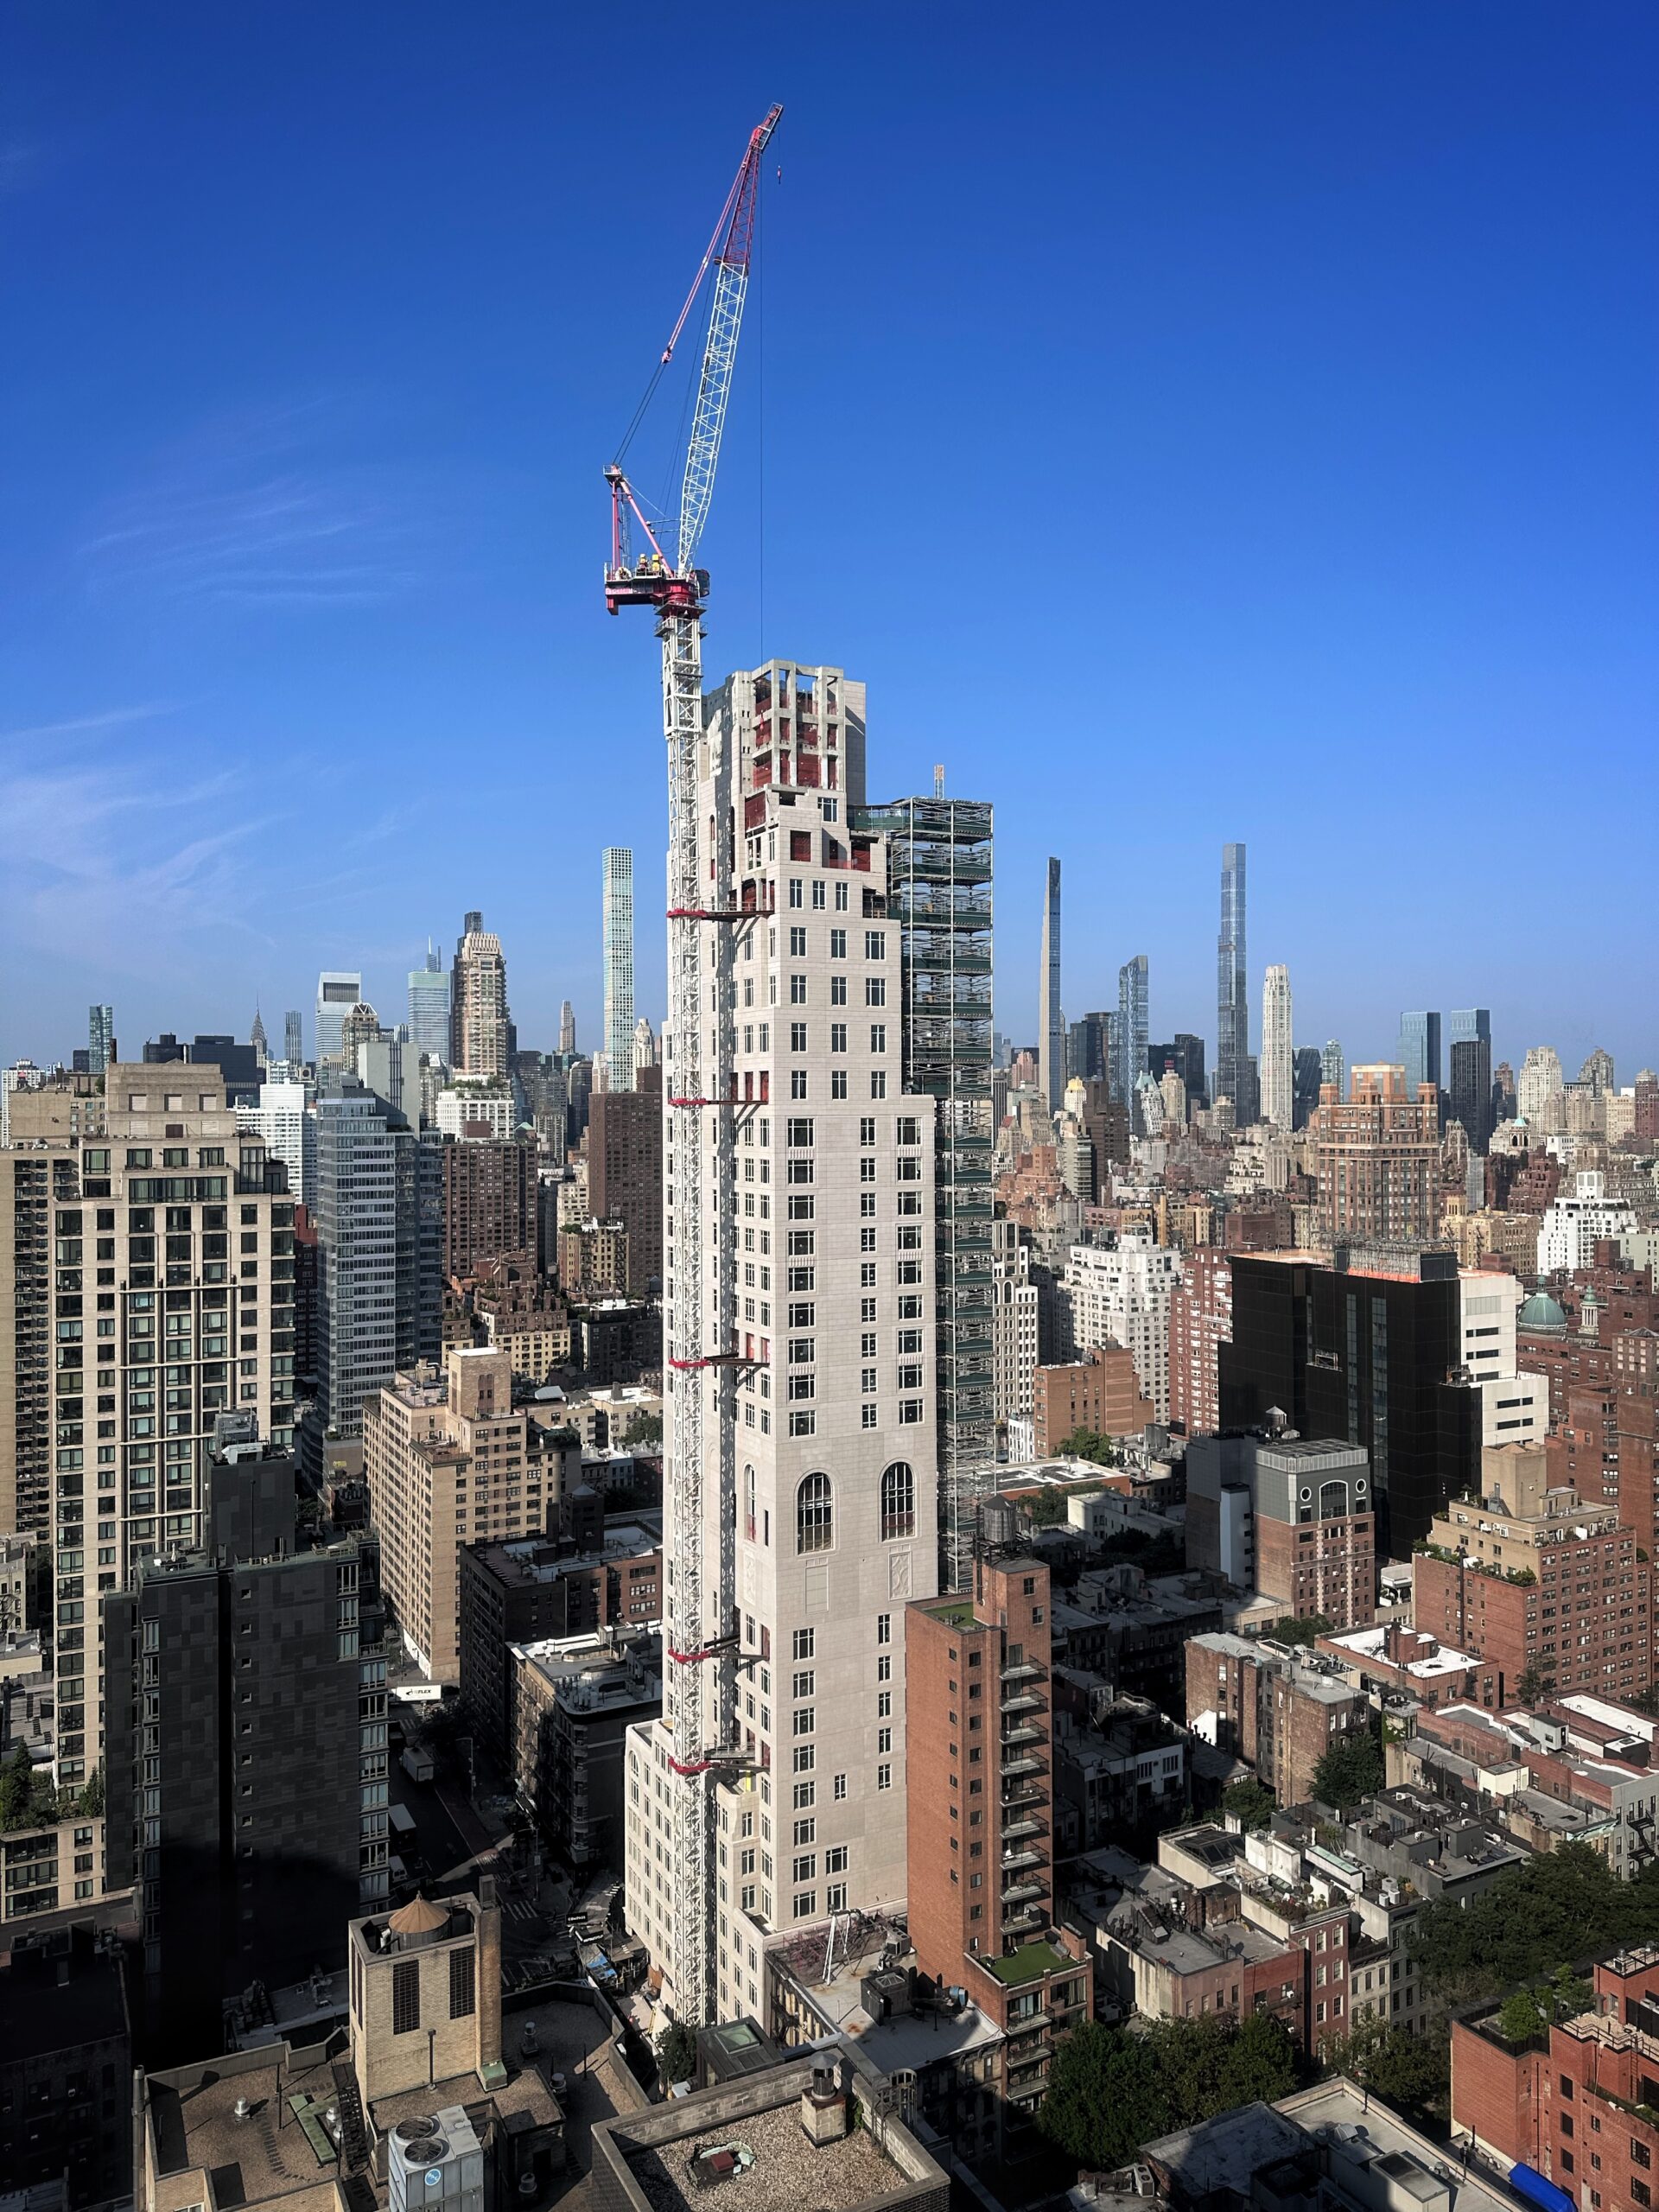
255 East 77th Street. Photo by Michael Young.
Permits listed by floor area per filing
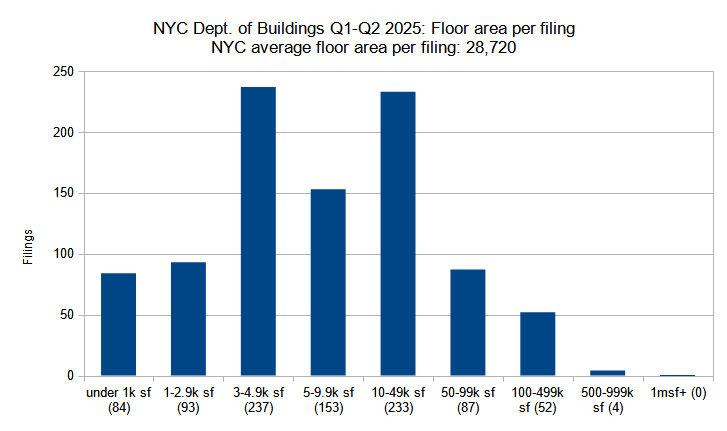
New construction permits filed in New York City in Q1-Q2 (January through June) 2025, grouped by total floor area. Data source: the Department of Buildings. Data aggregation and graphics credit: Vitali D. Ogorodnikov.
In the first two quarters of 2025, two-thirds of all new building permit filings (66 percent) ranged from 3,000 to 100,000 square feet. The broader category of building filings under 500,000 square feet includes almost all of the filed-for permits, with four exceptions. Each of these four entrants, however, spans a significant amount of square footage (ranging from half a million up to 1 million square feet each), carrying a significant proportion of the filed-for square footage in the two quarters.
Below is a breakdown by floor area category:
- Under 1,000 square feet – 84 permits (9 percent of total)
- 1,000 to 2,999 sf – 93 permits (10 percent of total)
- 3,000 to 4,999 sf – 237 permits (25 percent of total)
- 5,000 to 9,999 sf – 153 permits (16 percent of total)
- 10,000 to 49,999 sf – 233 permits (25 percent of total)
- 50,000 to 99,999 sf – 87 permits (9 percent of total)
- 100,000 to 499,999 sf – 52 permits (6 percent of total)
- 500,000 to 999,999 sf – 4 permits (0.4 percent of total)
Below are the top ten permits with the largest floor area, in order:
- 431 East 66th Street in Manhattan (730,492 square feet)
- 376 Schermerhorn Street in Brooklyn (639,873 square feet)
- 21 Freeman Street in Brooklyn (509,447 square feet)
- 12-18 38th Avenue in Queens (504,527 square feet)
- 1057 Atlantic Avenue in Brooklyn (473,780 square feet)
- 935 Erskine Street in Brooklyn (382,733 square feet)
- 4660 Broadway in Manhattan (350,489 square feet)
- 48-37 48th Street in Queens (347,623 square feet)
- 89 DeKalb Avenue in Brooklyn (343,710 square feet)
- 69 Adams Street in Brooklyn (323,995 square feet)
Of the top ten largest floor area filings for the first half of 2025, six are found in Brooklyn and two apiece in Manhattan and Queens.
Casoni. Photo by Michael Young.
Total floor area filed by borough
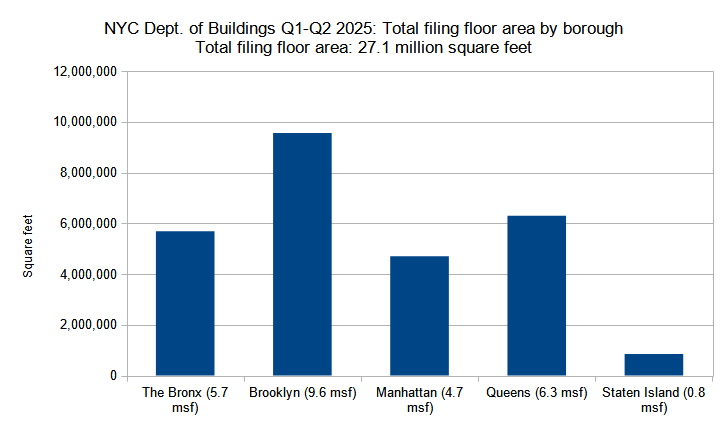
Combined floor area of new construction permits filed per borough in New York City in Q1-Q2 (January through June) 2025. Data source: the Department of Buildings. Data aggregation and graphics credit: Vitali D. Ogorodnikov.
In the first half of 2025, 9.6 million of the 27.1 million filed-for square feet, or one-third of the city’s total, were found in Brooklyn. Queens, The Bronx, and Manhattan each registered considerably lower, though still significant, totals of 6.3, 5.7, and 4.7 million square feet, respectively. Staten Island trails the group with a total of just under 1 million square feet, representing around 3 percent of the city’s total.
Below are the square footage totals per borough:
- The Bronx – 5,686,879 square feet (21 percent of total)
- Brooklyn – 9,560,176 square feet (35 percent of total)
- Manhattan – 4,695,923 square feet (17 percent of total)
- Queens – 6,294,096 square feet (23 percent of total)
- Staten Island – 845,431 square feet (3 percent of total)
The following are the permit filings in each borough with the largest floor area:
- The Bronx – 1674 Boone Avenue (271,714 square feet)
- Brooklyn – 376 Schermerhorn Street (639,873 square feet)
- Manhattan – 431 East 66th Street (730,492 square feet)
- Queens – 12-18 38th Avenue (504,527 square feet)
- Staten Island – 45 Cleveland Place (184,800 square feet)
In the first half of 2025, three of the city’s five boroughs (Brooklyn, Manhattan, and Queens) registered filings spanning more than half a million square feet. Surprisingly, The Bronx, which tends to have numbers comparable to Brooklyn, fell well below the threshold during this period, with a 271,714-square-foot filing (at 1674 Boone Avenue) that measures only slightly larger than the most sizable entrant in Staten Island (45 Cleveland Place), which measures 184,800 square feet.
Lumen LIC. Photo by Michael Young.
Average floor area per permit filing by borough
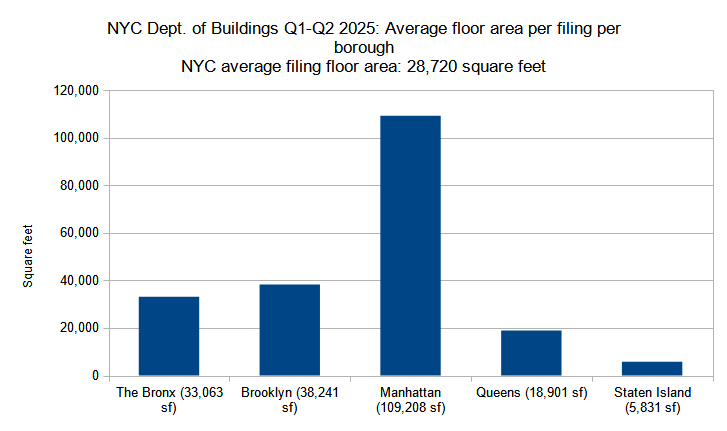
Average floor area per new construction permit per borough filed in New York City in Q1-Q2 (January through June) 2025. Data source: the Department of Buildings. Data aggregation and graphics credit: Vitali Ogorodnikov
In the first two quarters of 2025, the largest square footage average per new building filing registers in Manhattan (with 109,208 average square feet per filing), as expected for the space-limited, high-density borough. Brooklyn and The Bronx trail well behind, with respective averages of 38,241 and 33,063 square feet. Queens and Staten Island round off the group, with averages of 18,901 and 5,831 square feet, respectively.
Below is the quarterly comparison for the boroughs for filing size averages:
- The Bronx – 33,063 square feet (15 percent above city average)
- Brooklyn – 38,241 square feet (33 percent above city average)
- Manhattan – 109,208 square feet (280 percent above city average)
- Queens – 18,901 square feet (34 percent below city average)
- Staten Island – 5,831 square feet (80 percent below city average)
Casoni at 989 6th Avenue. Photo by Michael Young.
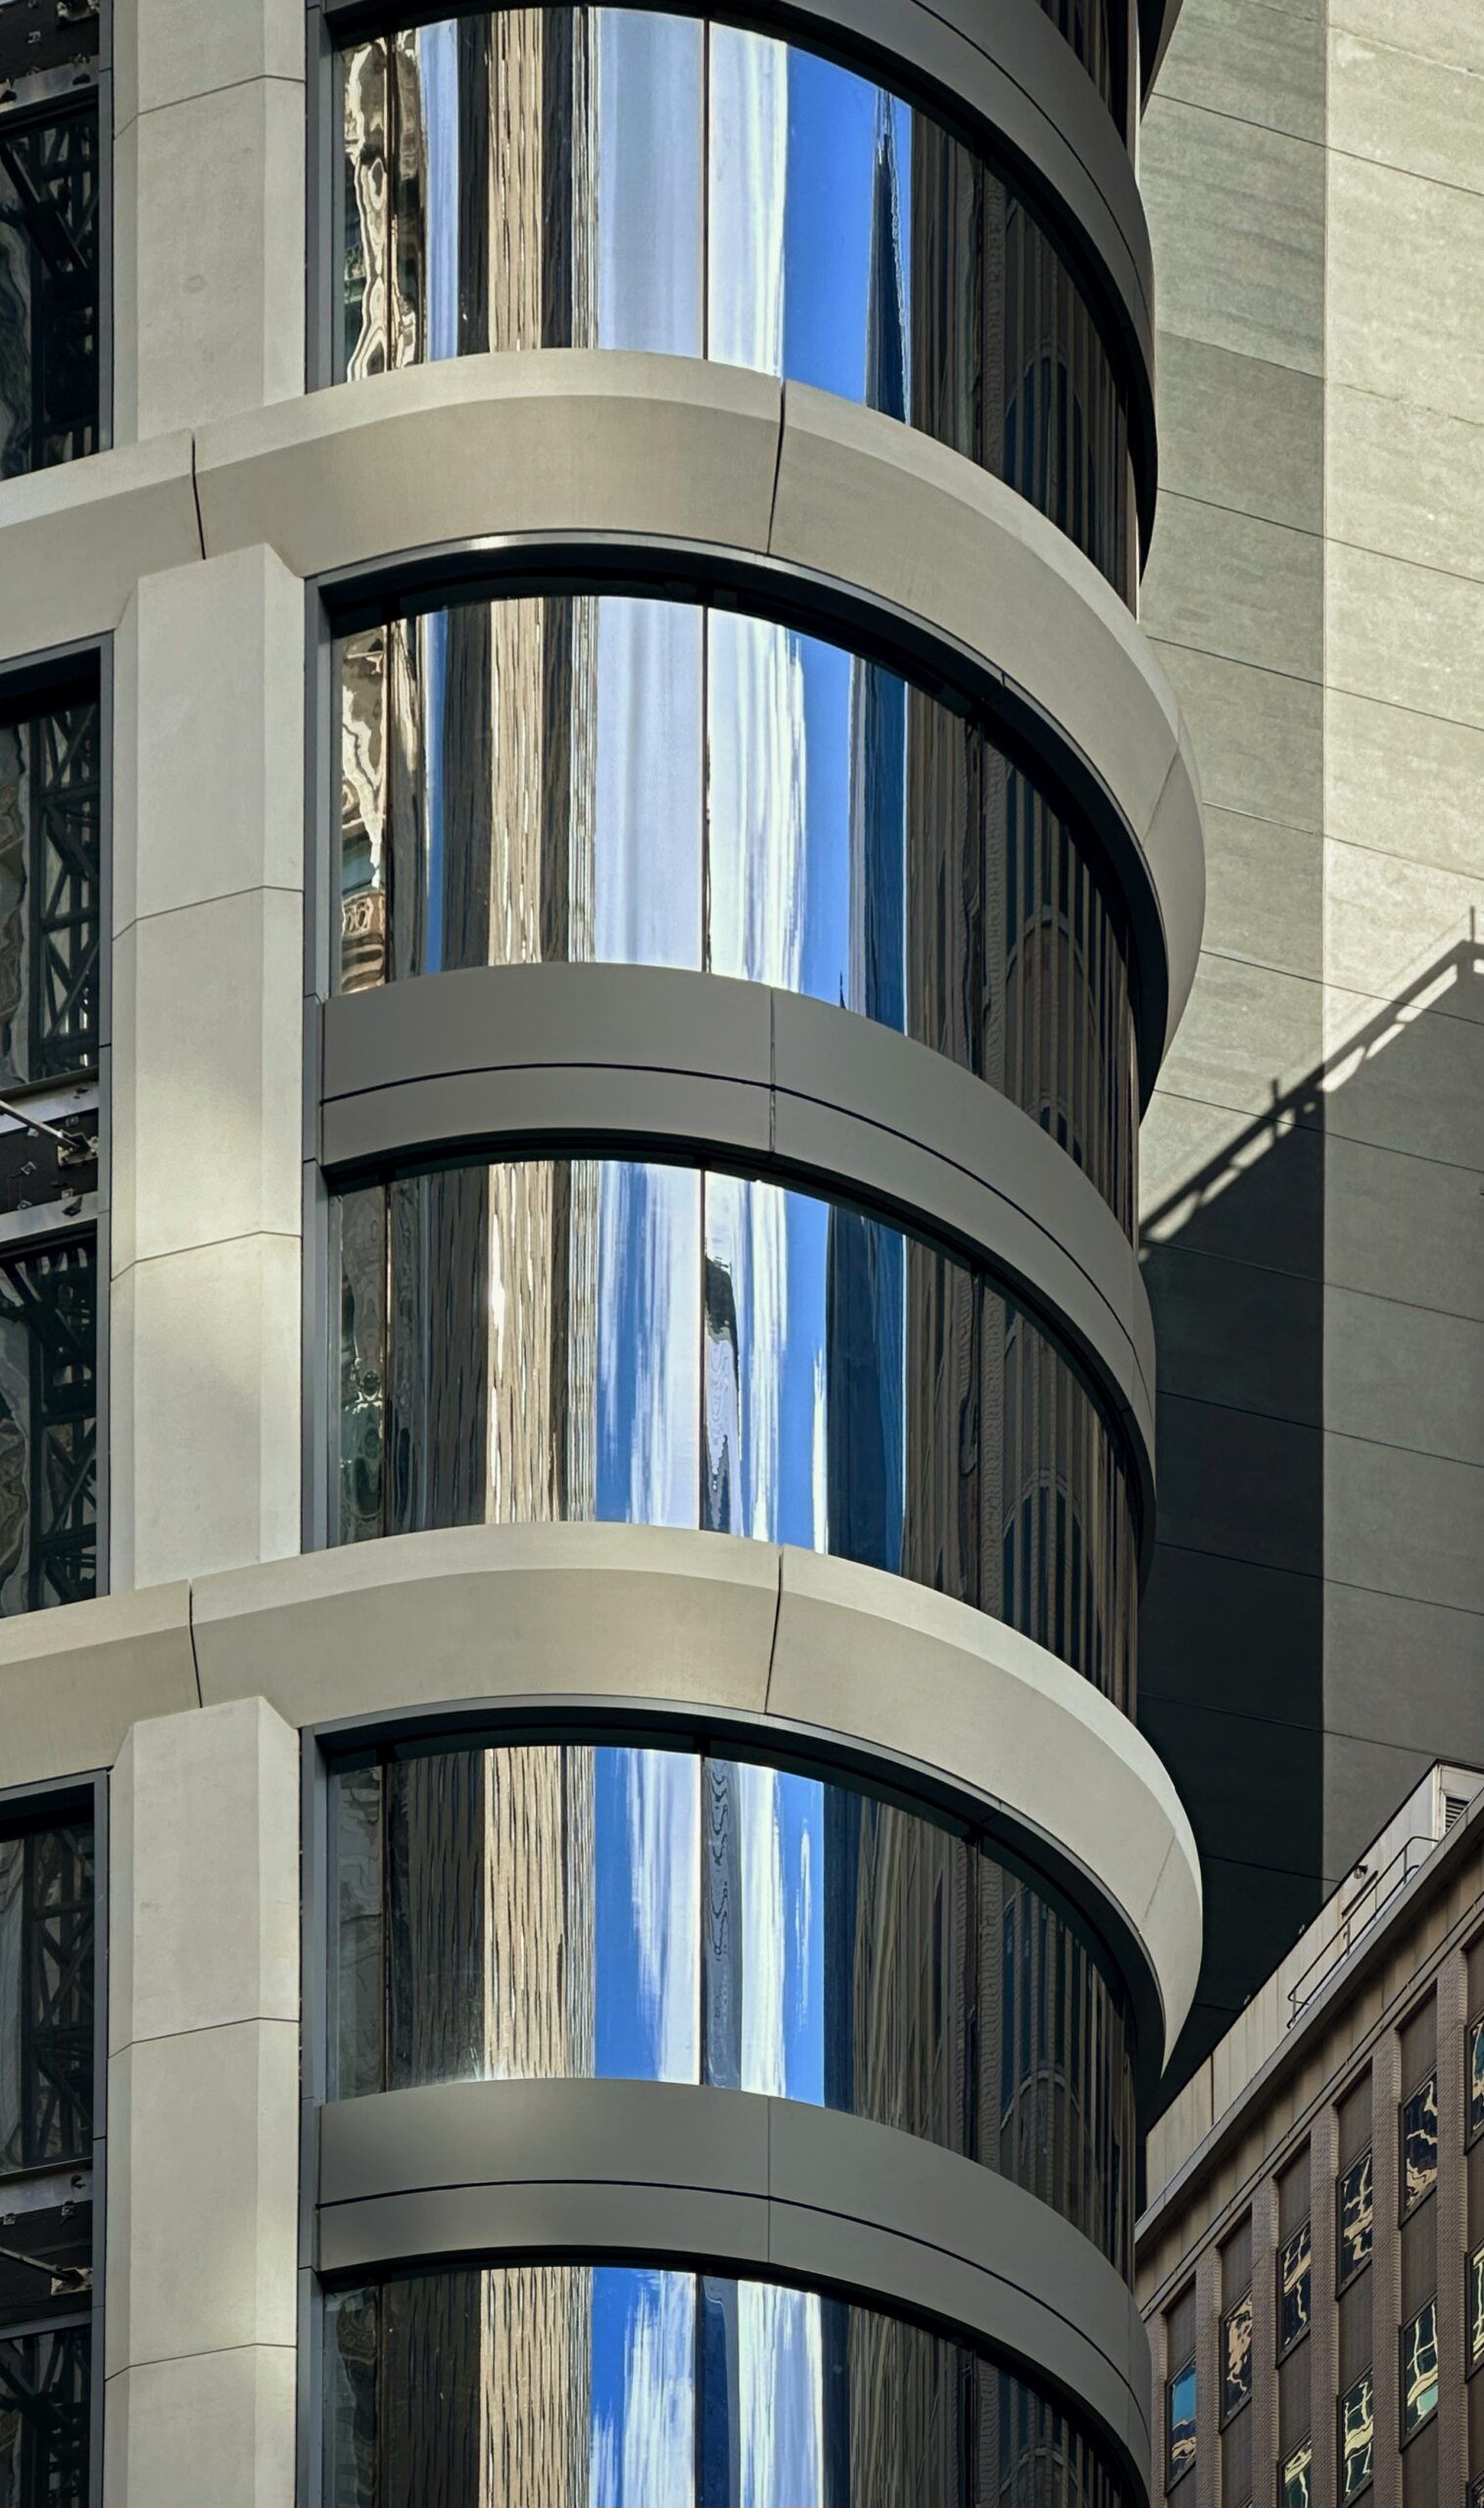
520 Fifth Avenue. Photo by Michael Young.
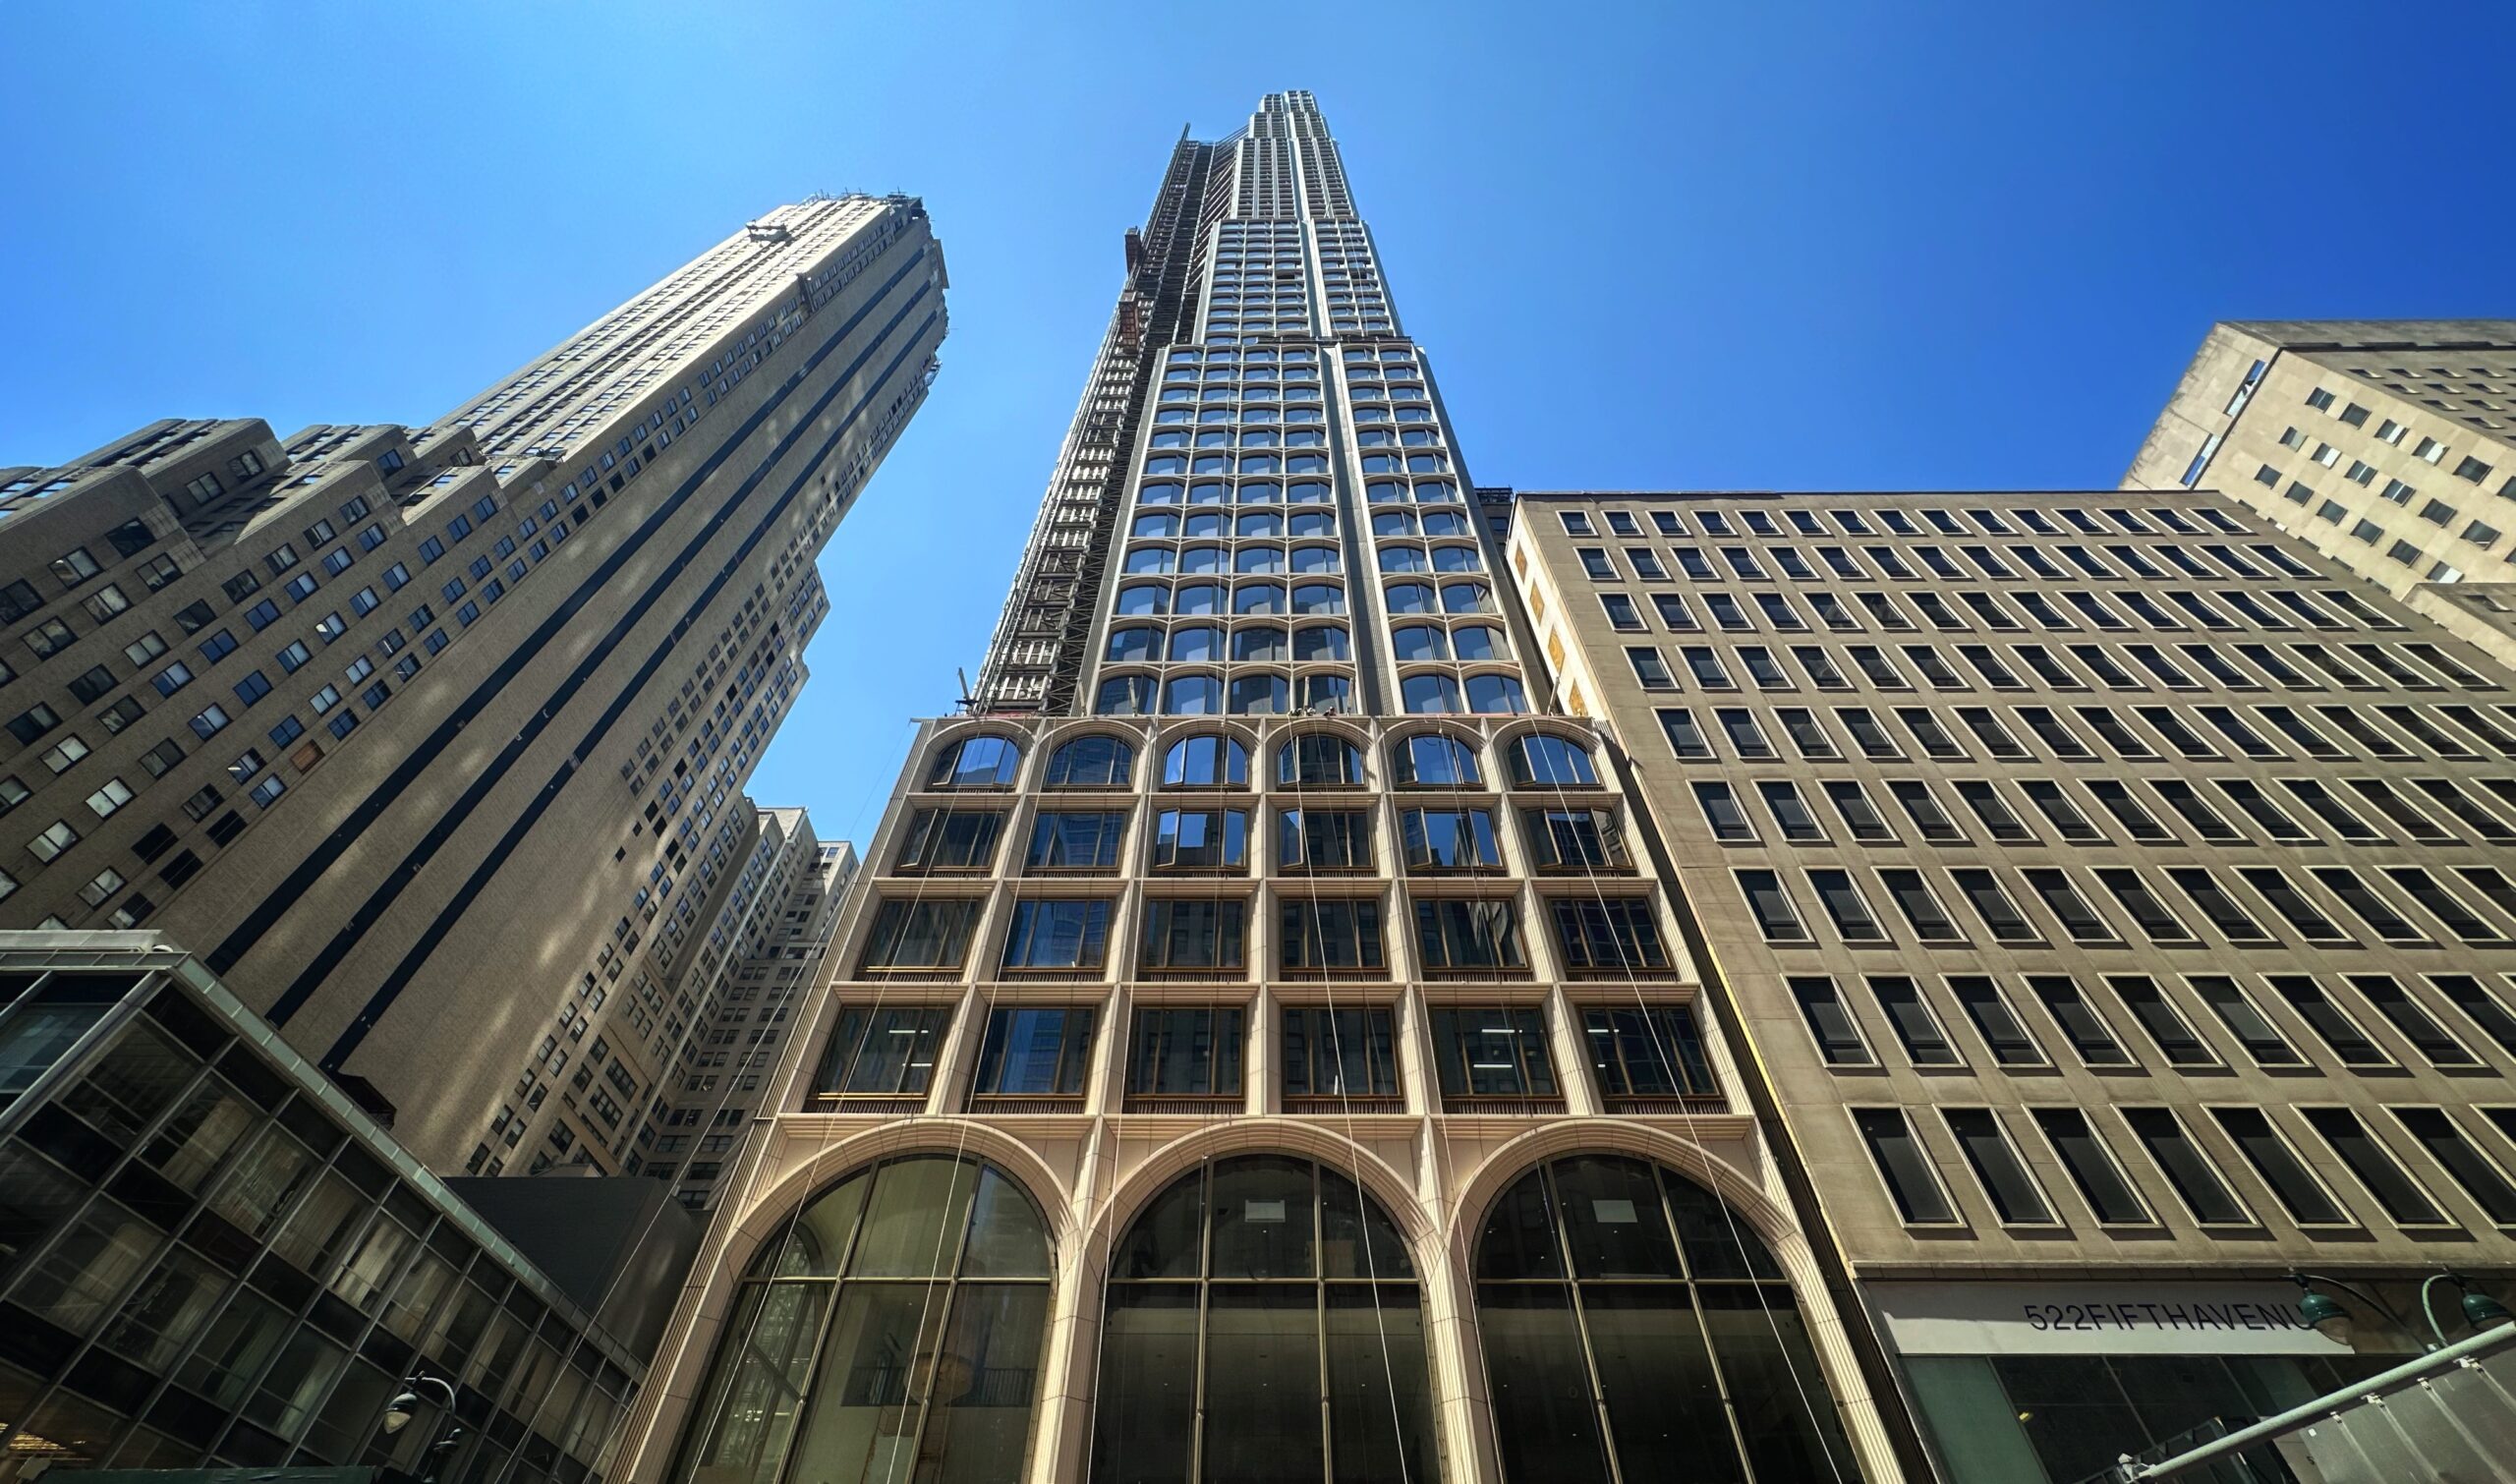
520 Fifth Avenue. Photo by Michael Young.

326 Rockaway Avenue. Photo by Michael Young.
25-01 Queens Plaza North. Photo by Michael Young
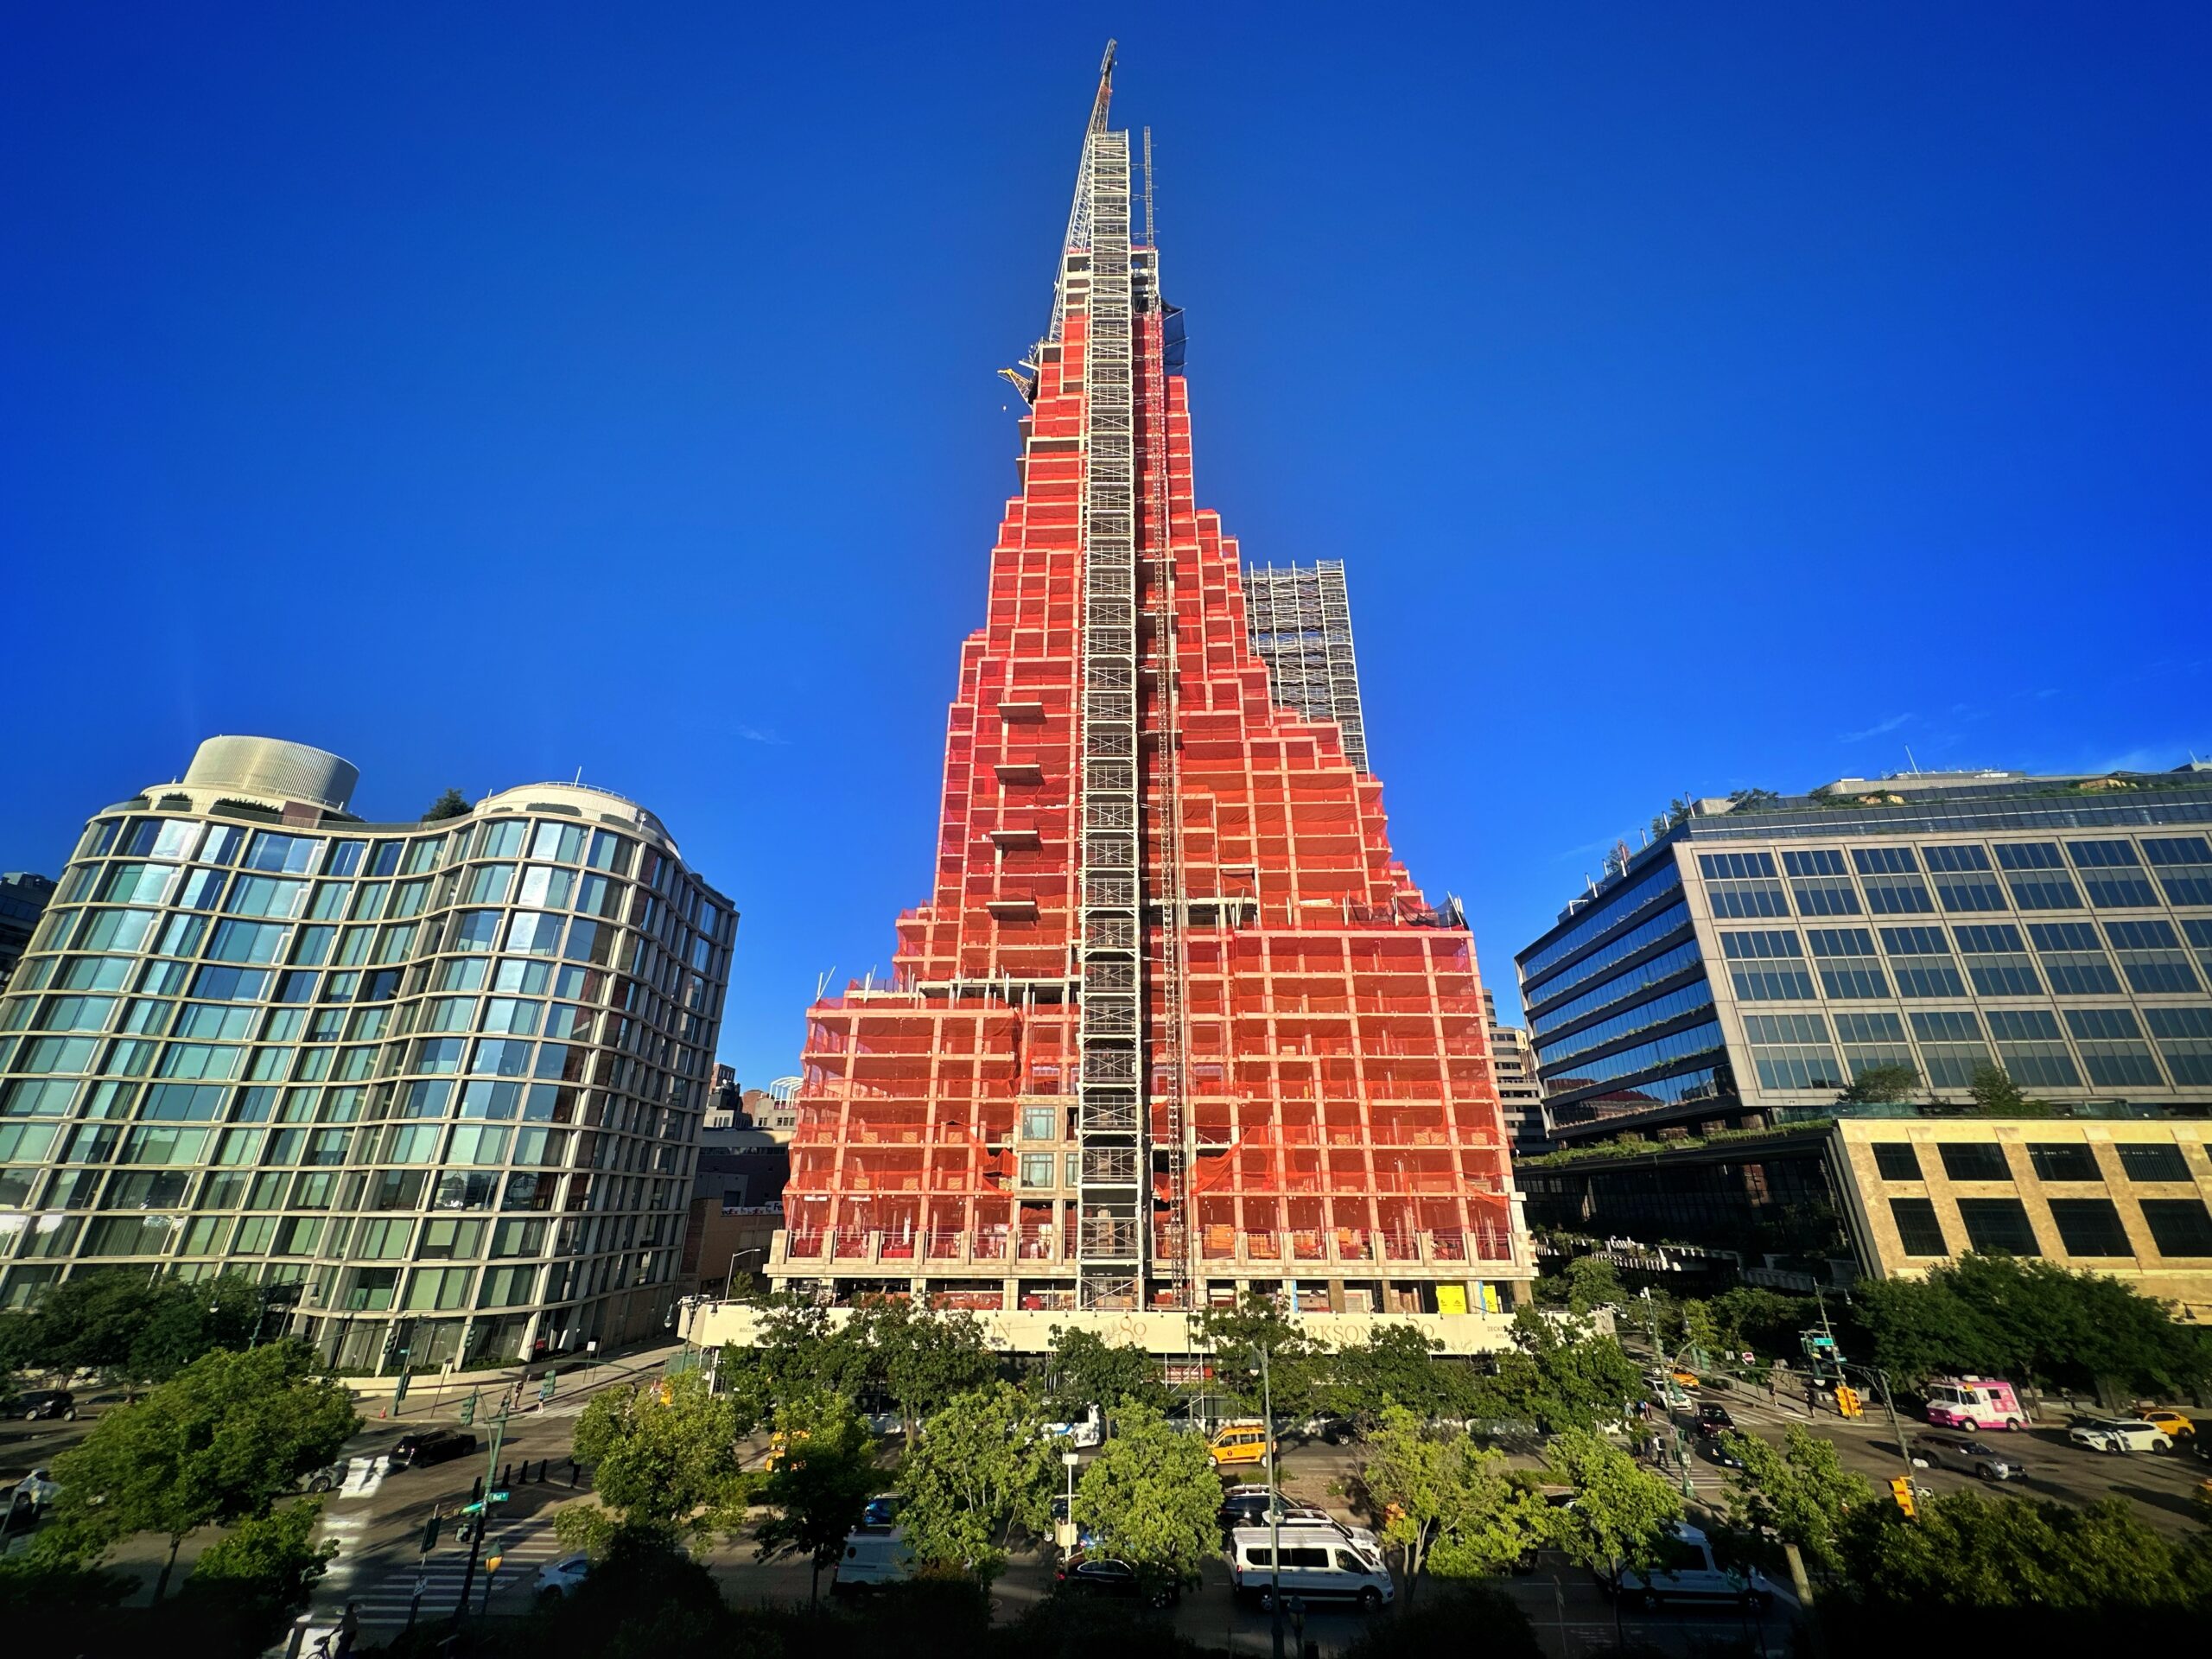
80 Clarkson. Photo by Michael Young.
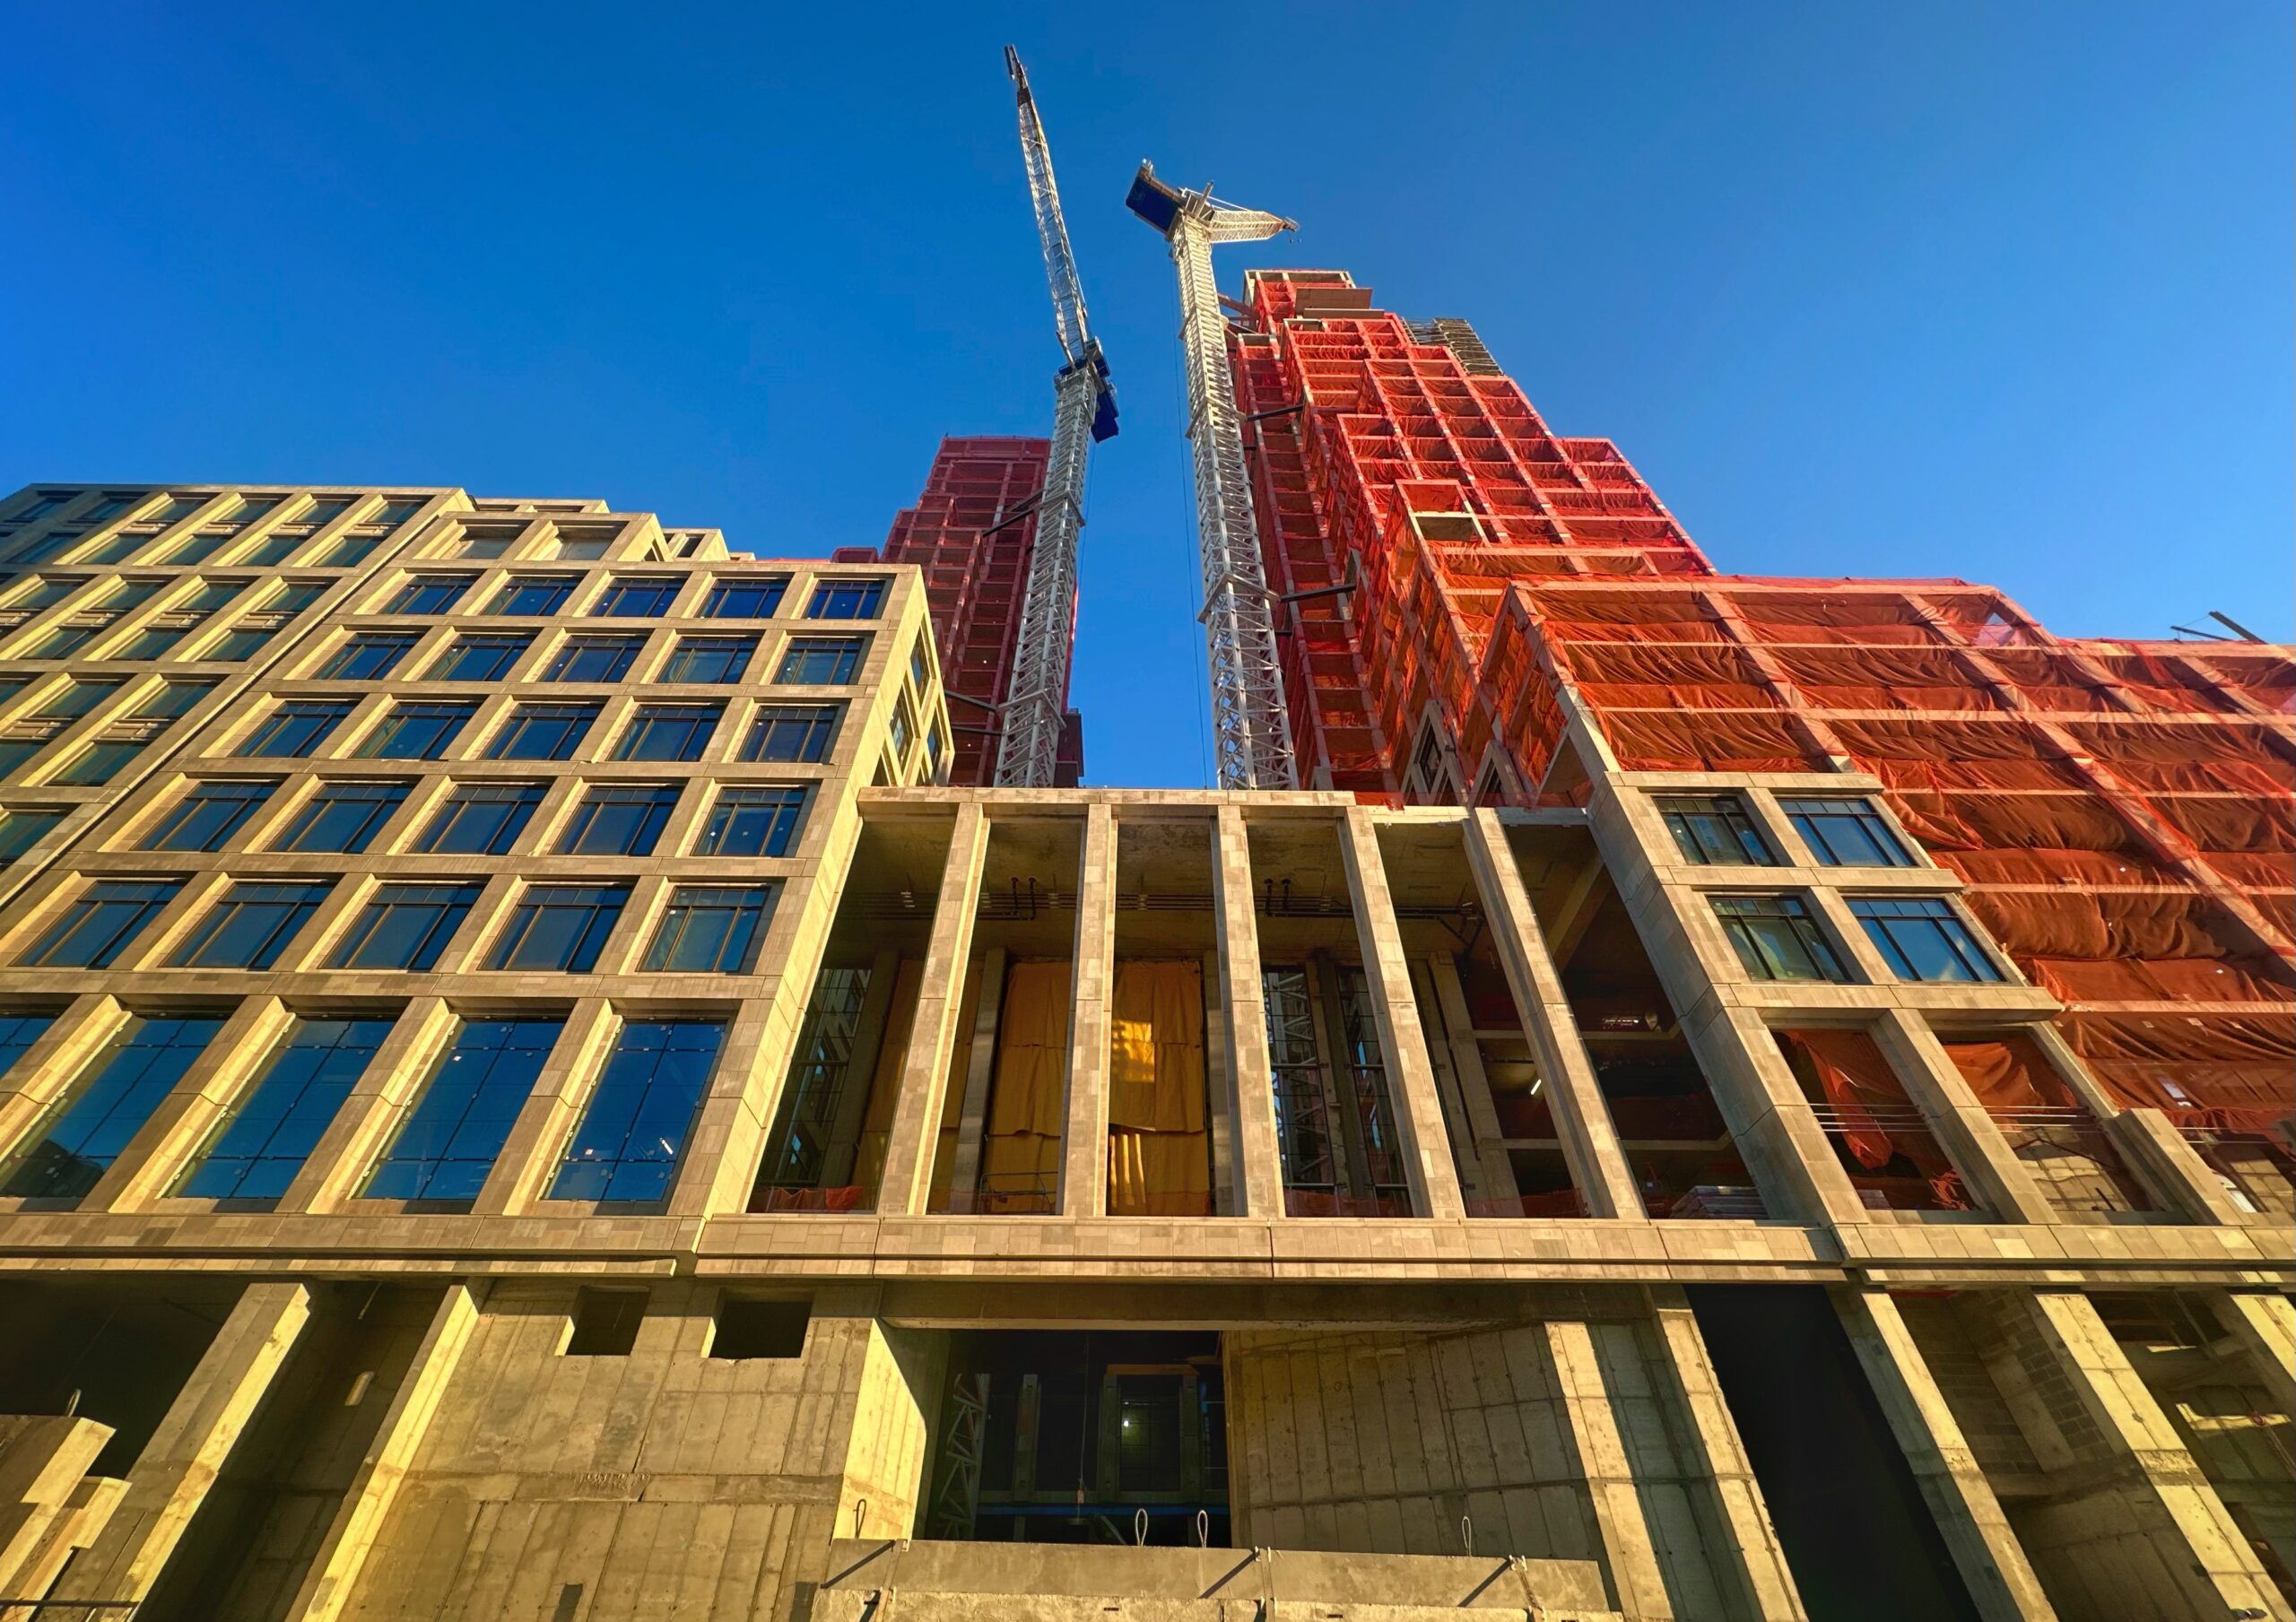
80 Clarkson. Photo by Michael Young.
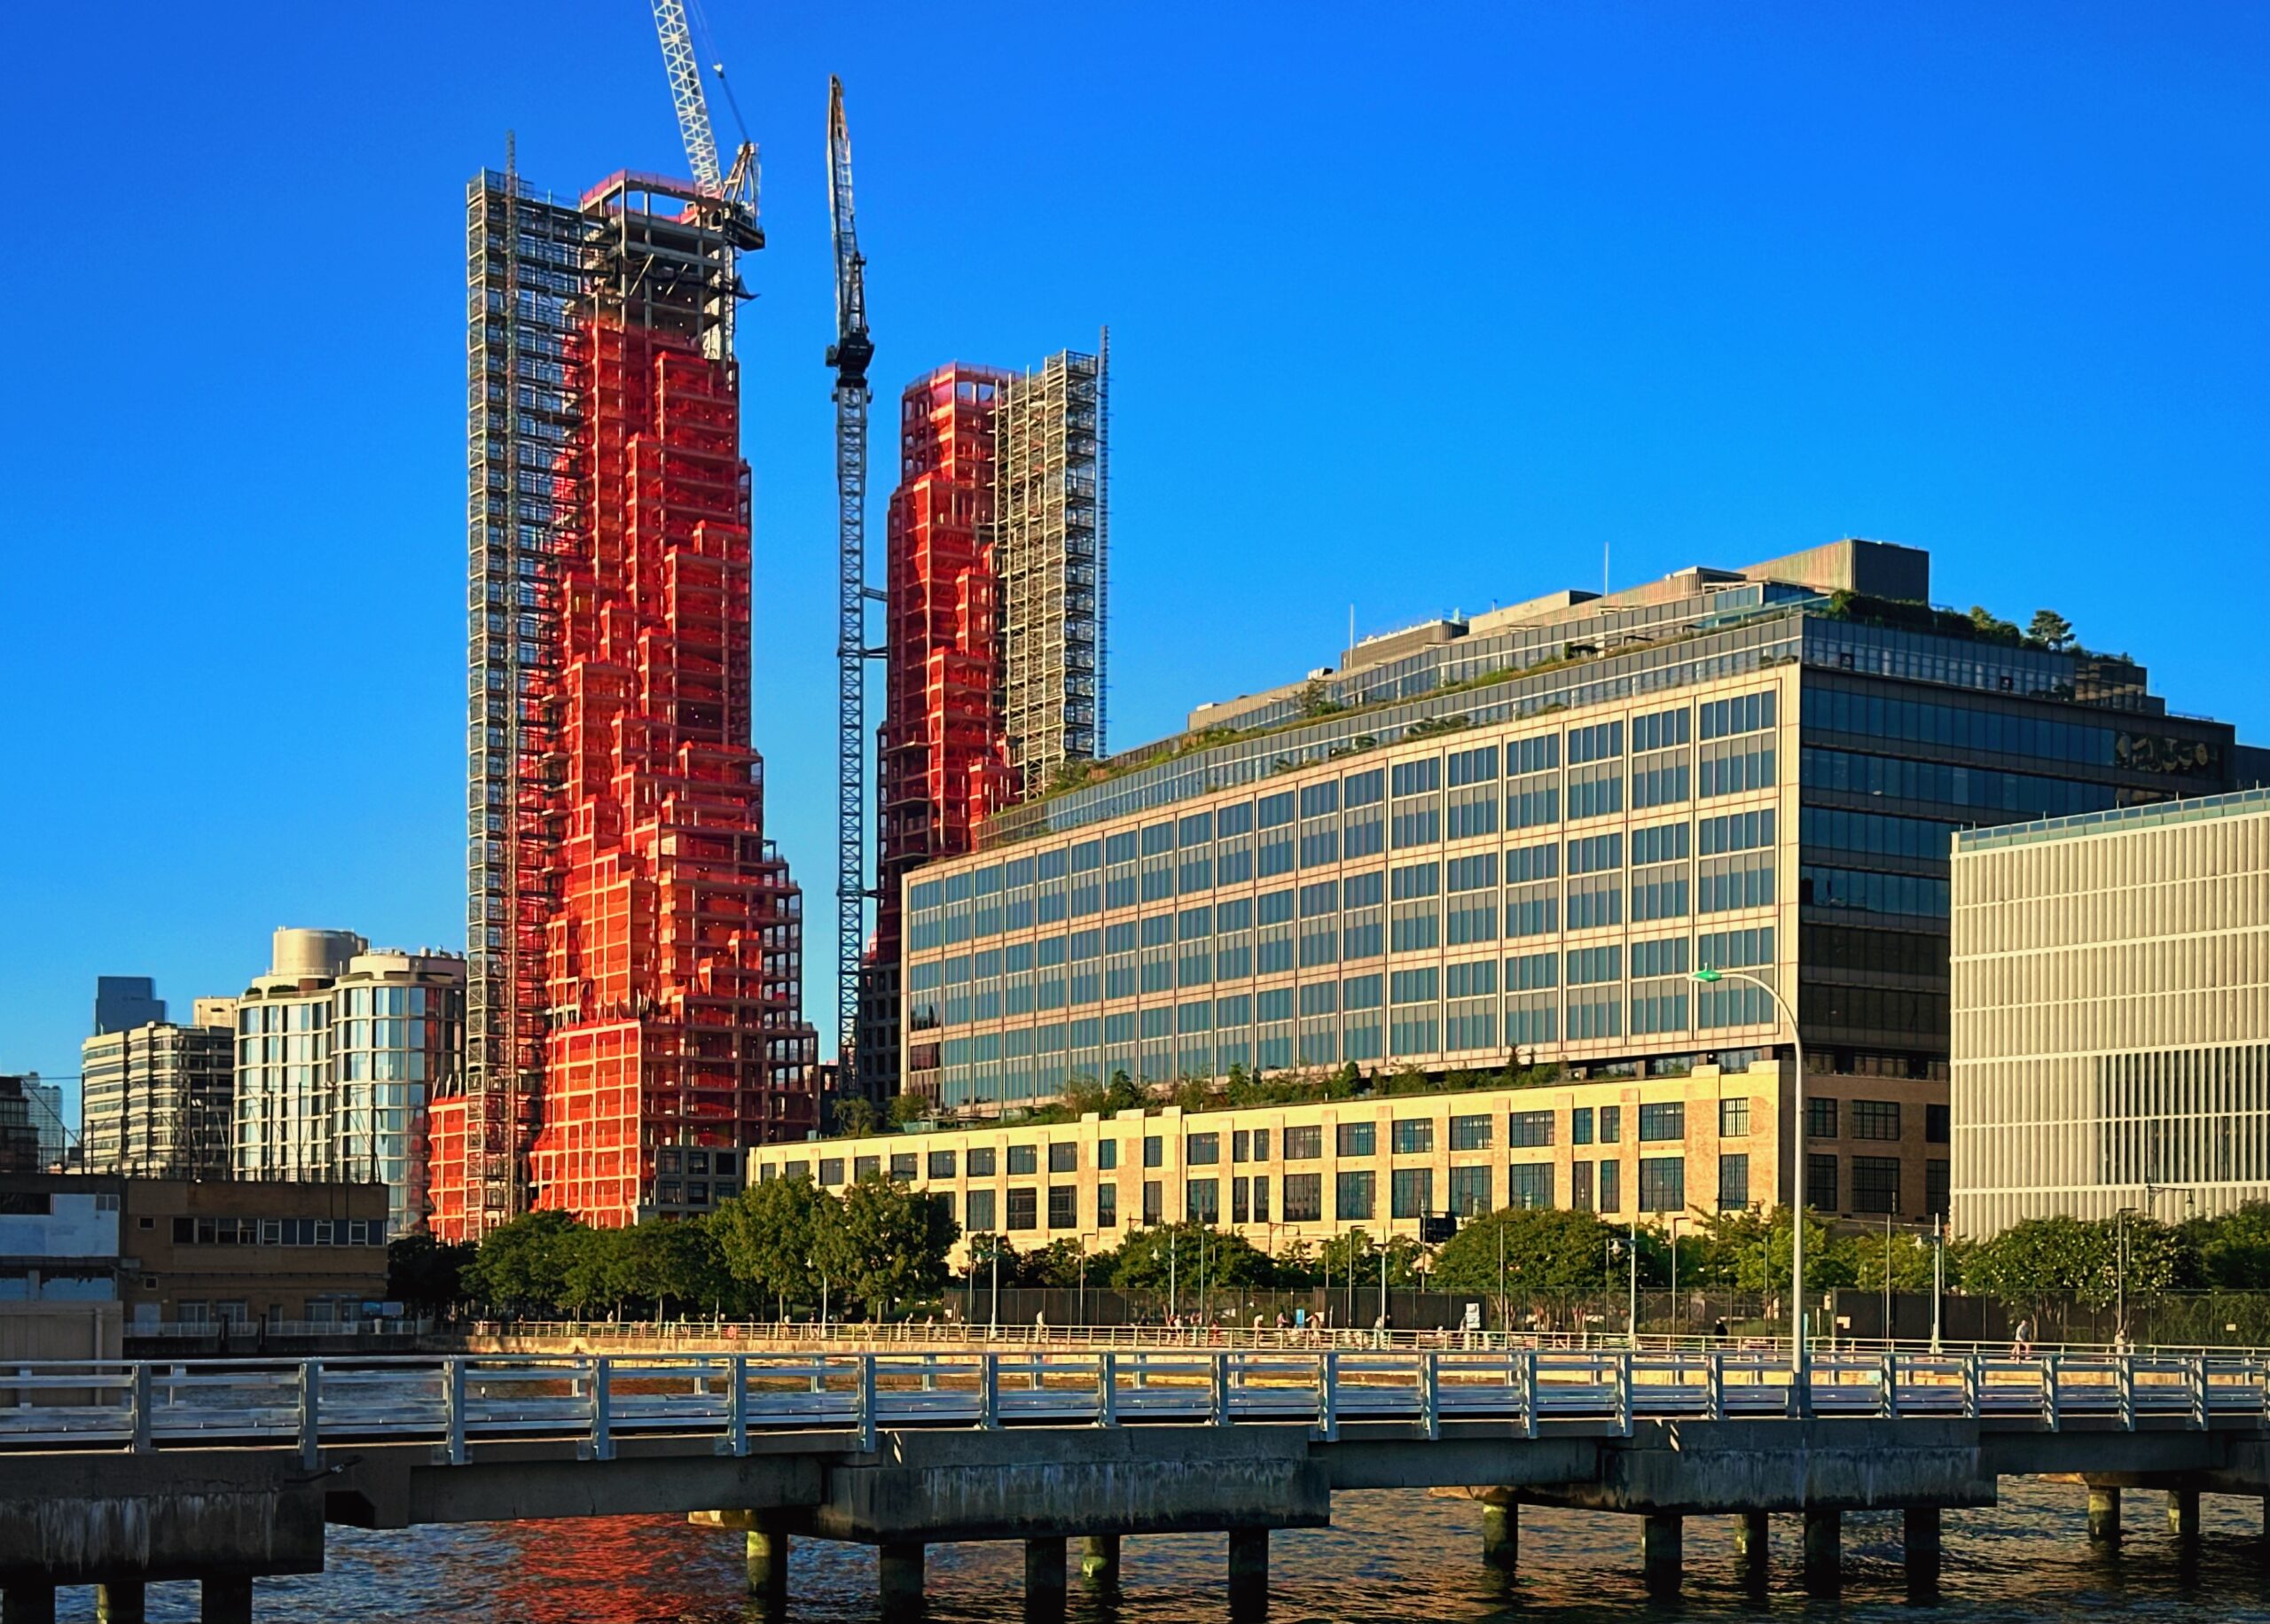
80 Clarkson. Photo by Michael Young.
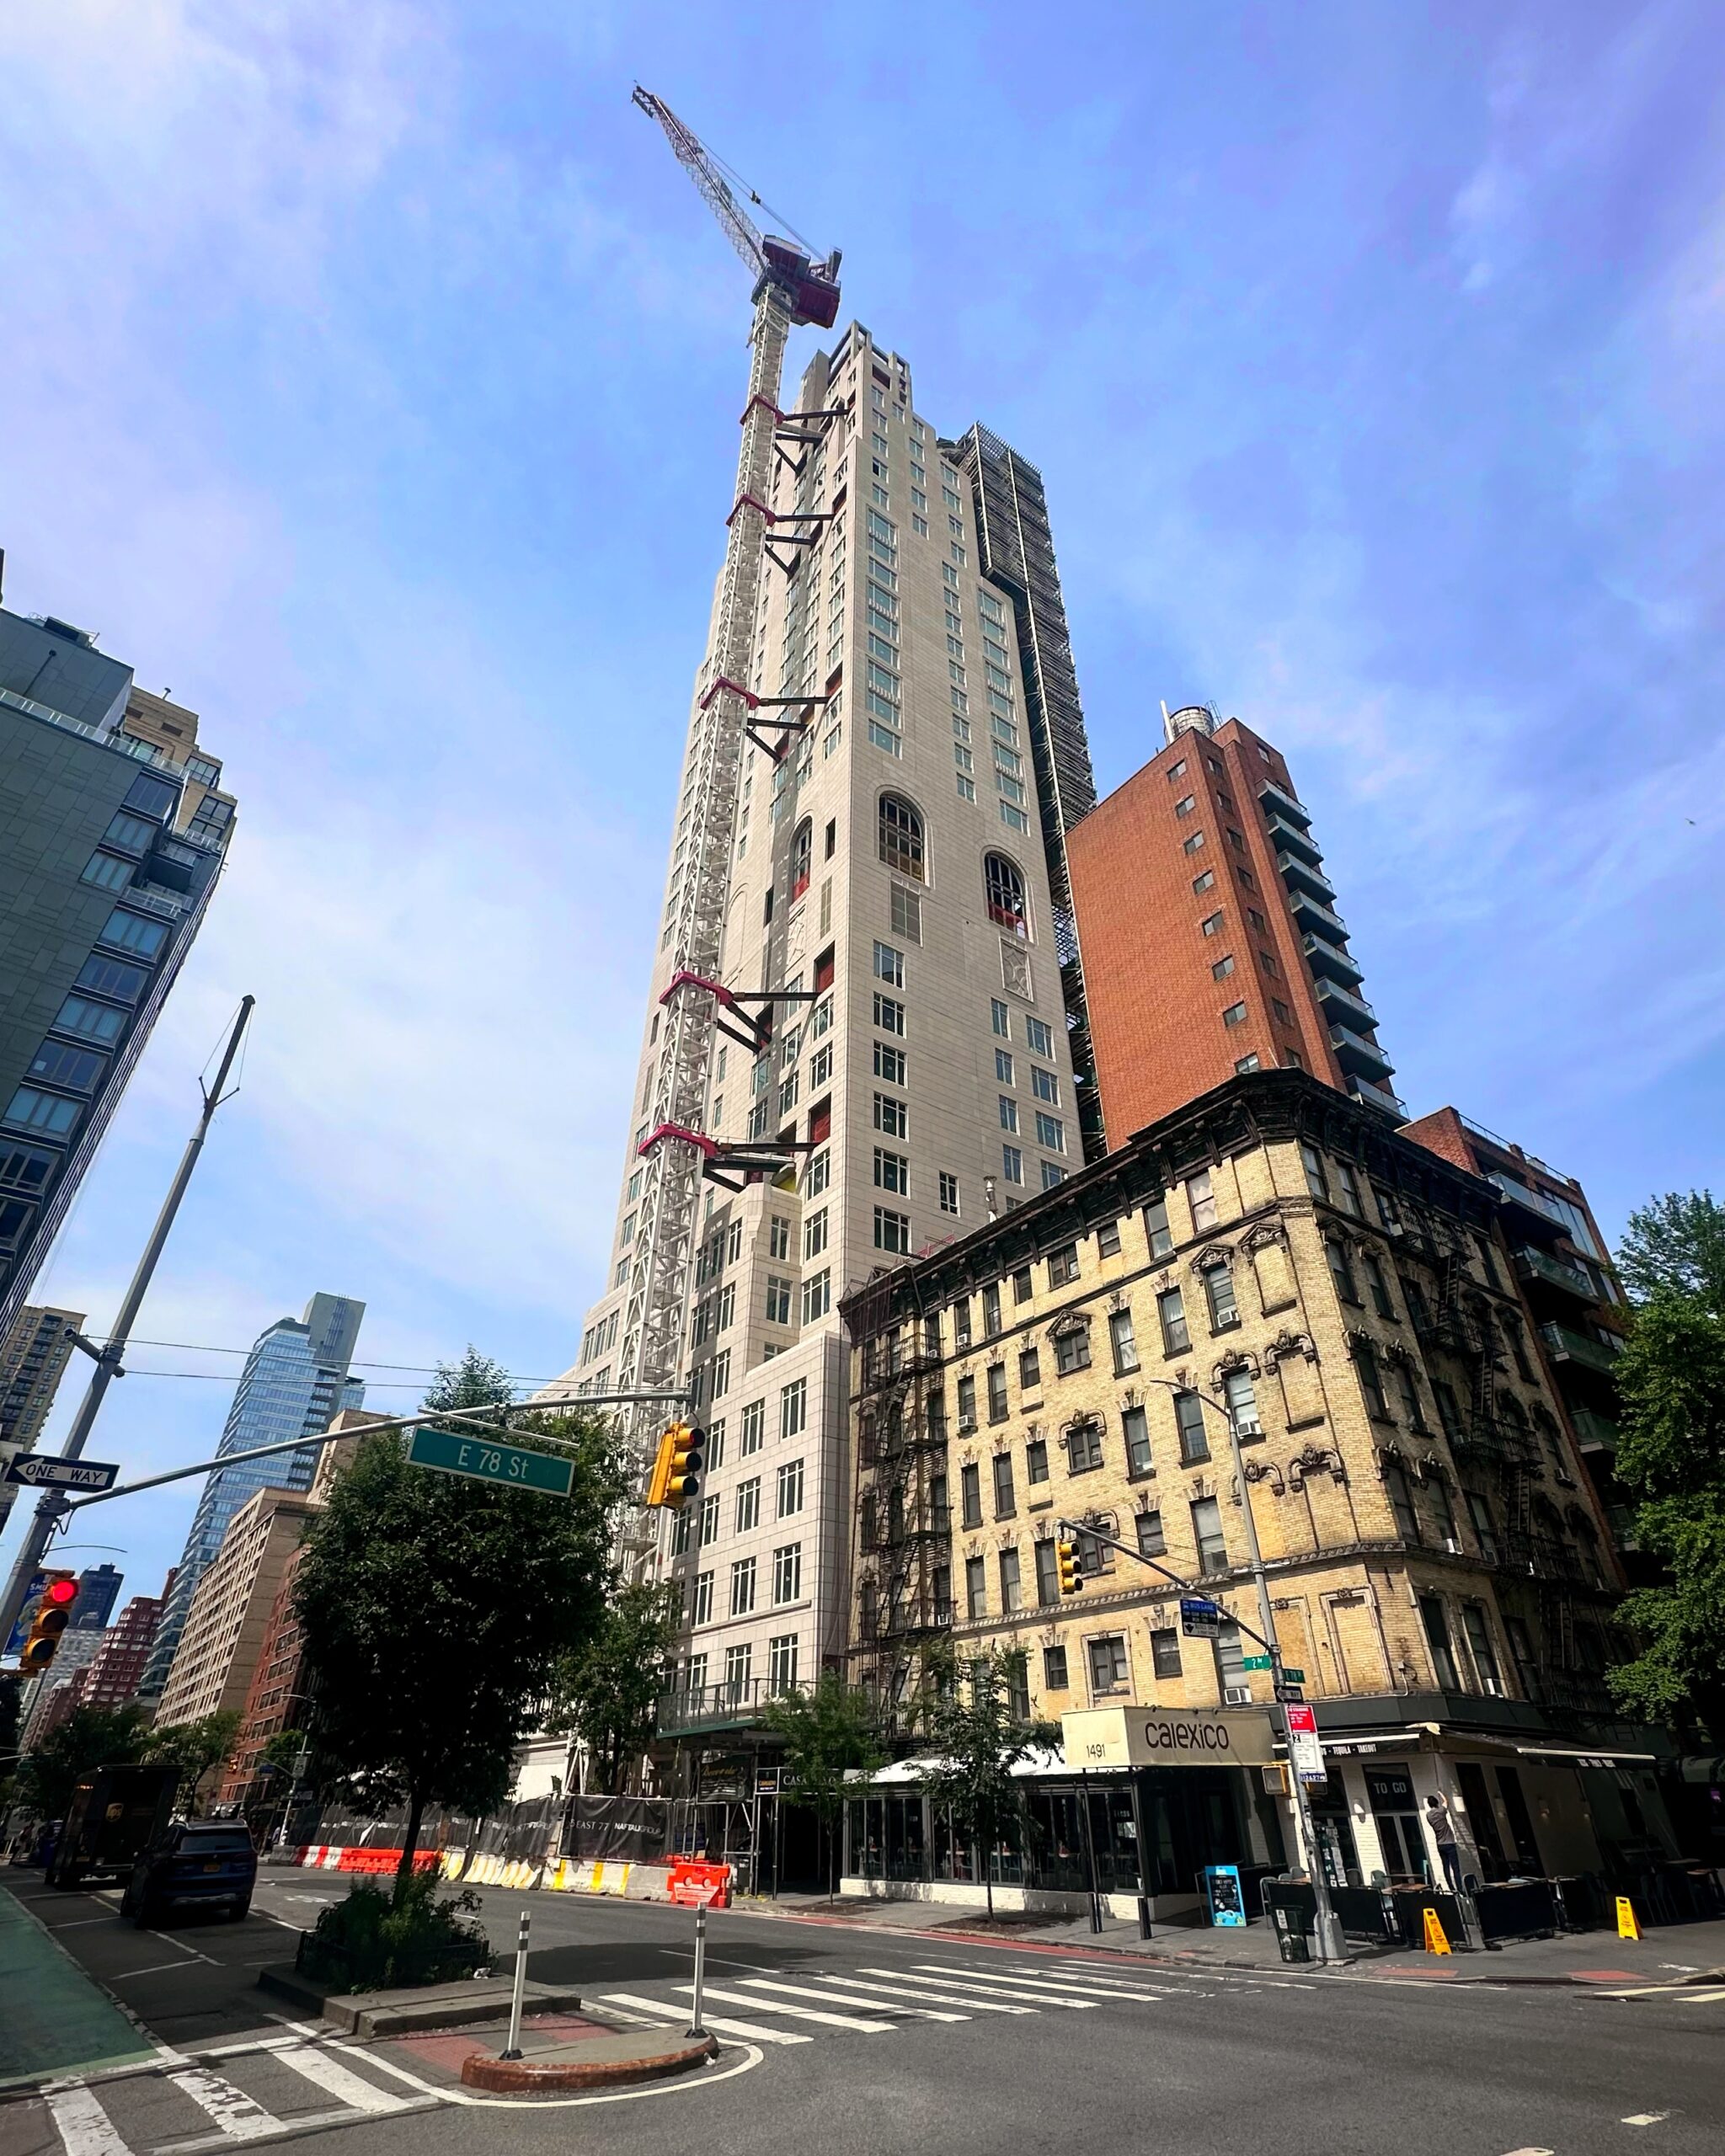
255 East 77th Street. Photo by Michael Young.
450 11th Avenue. Photo by Michael Young.
Casoni at 989 6th Avenue. Photo by Michael Young.
Casoni at 989 6th Avenue. Photo by Michael Young.
660 Lexington Avenue. Photo by Michael Young.
The Remi at 1026 Third Avenue. Photo by Michael Young.
358 West 58th Street. Photo by Michael Young.
125 West 57th Street. Photo by Michael Young.
Manhattan’s Upper East Side. Photo by Michael Young.
520 Fifth Avenue. Photo by Michael Young.
1 Park Row. Photo by Michael Young.
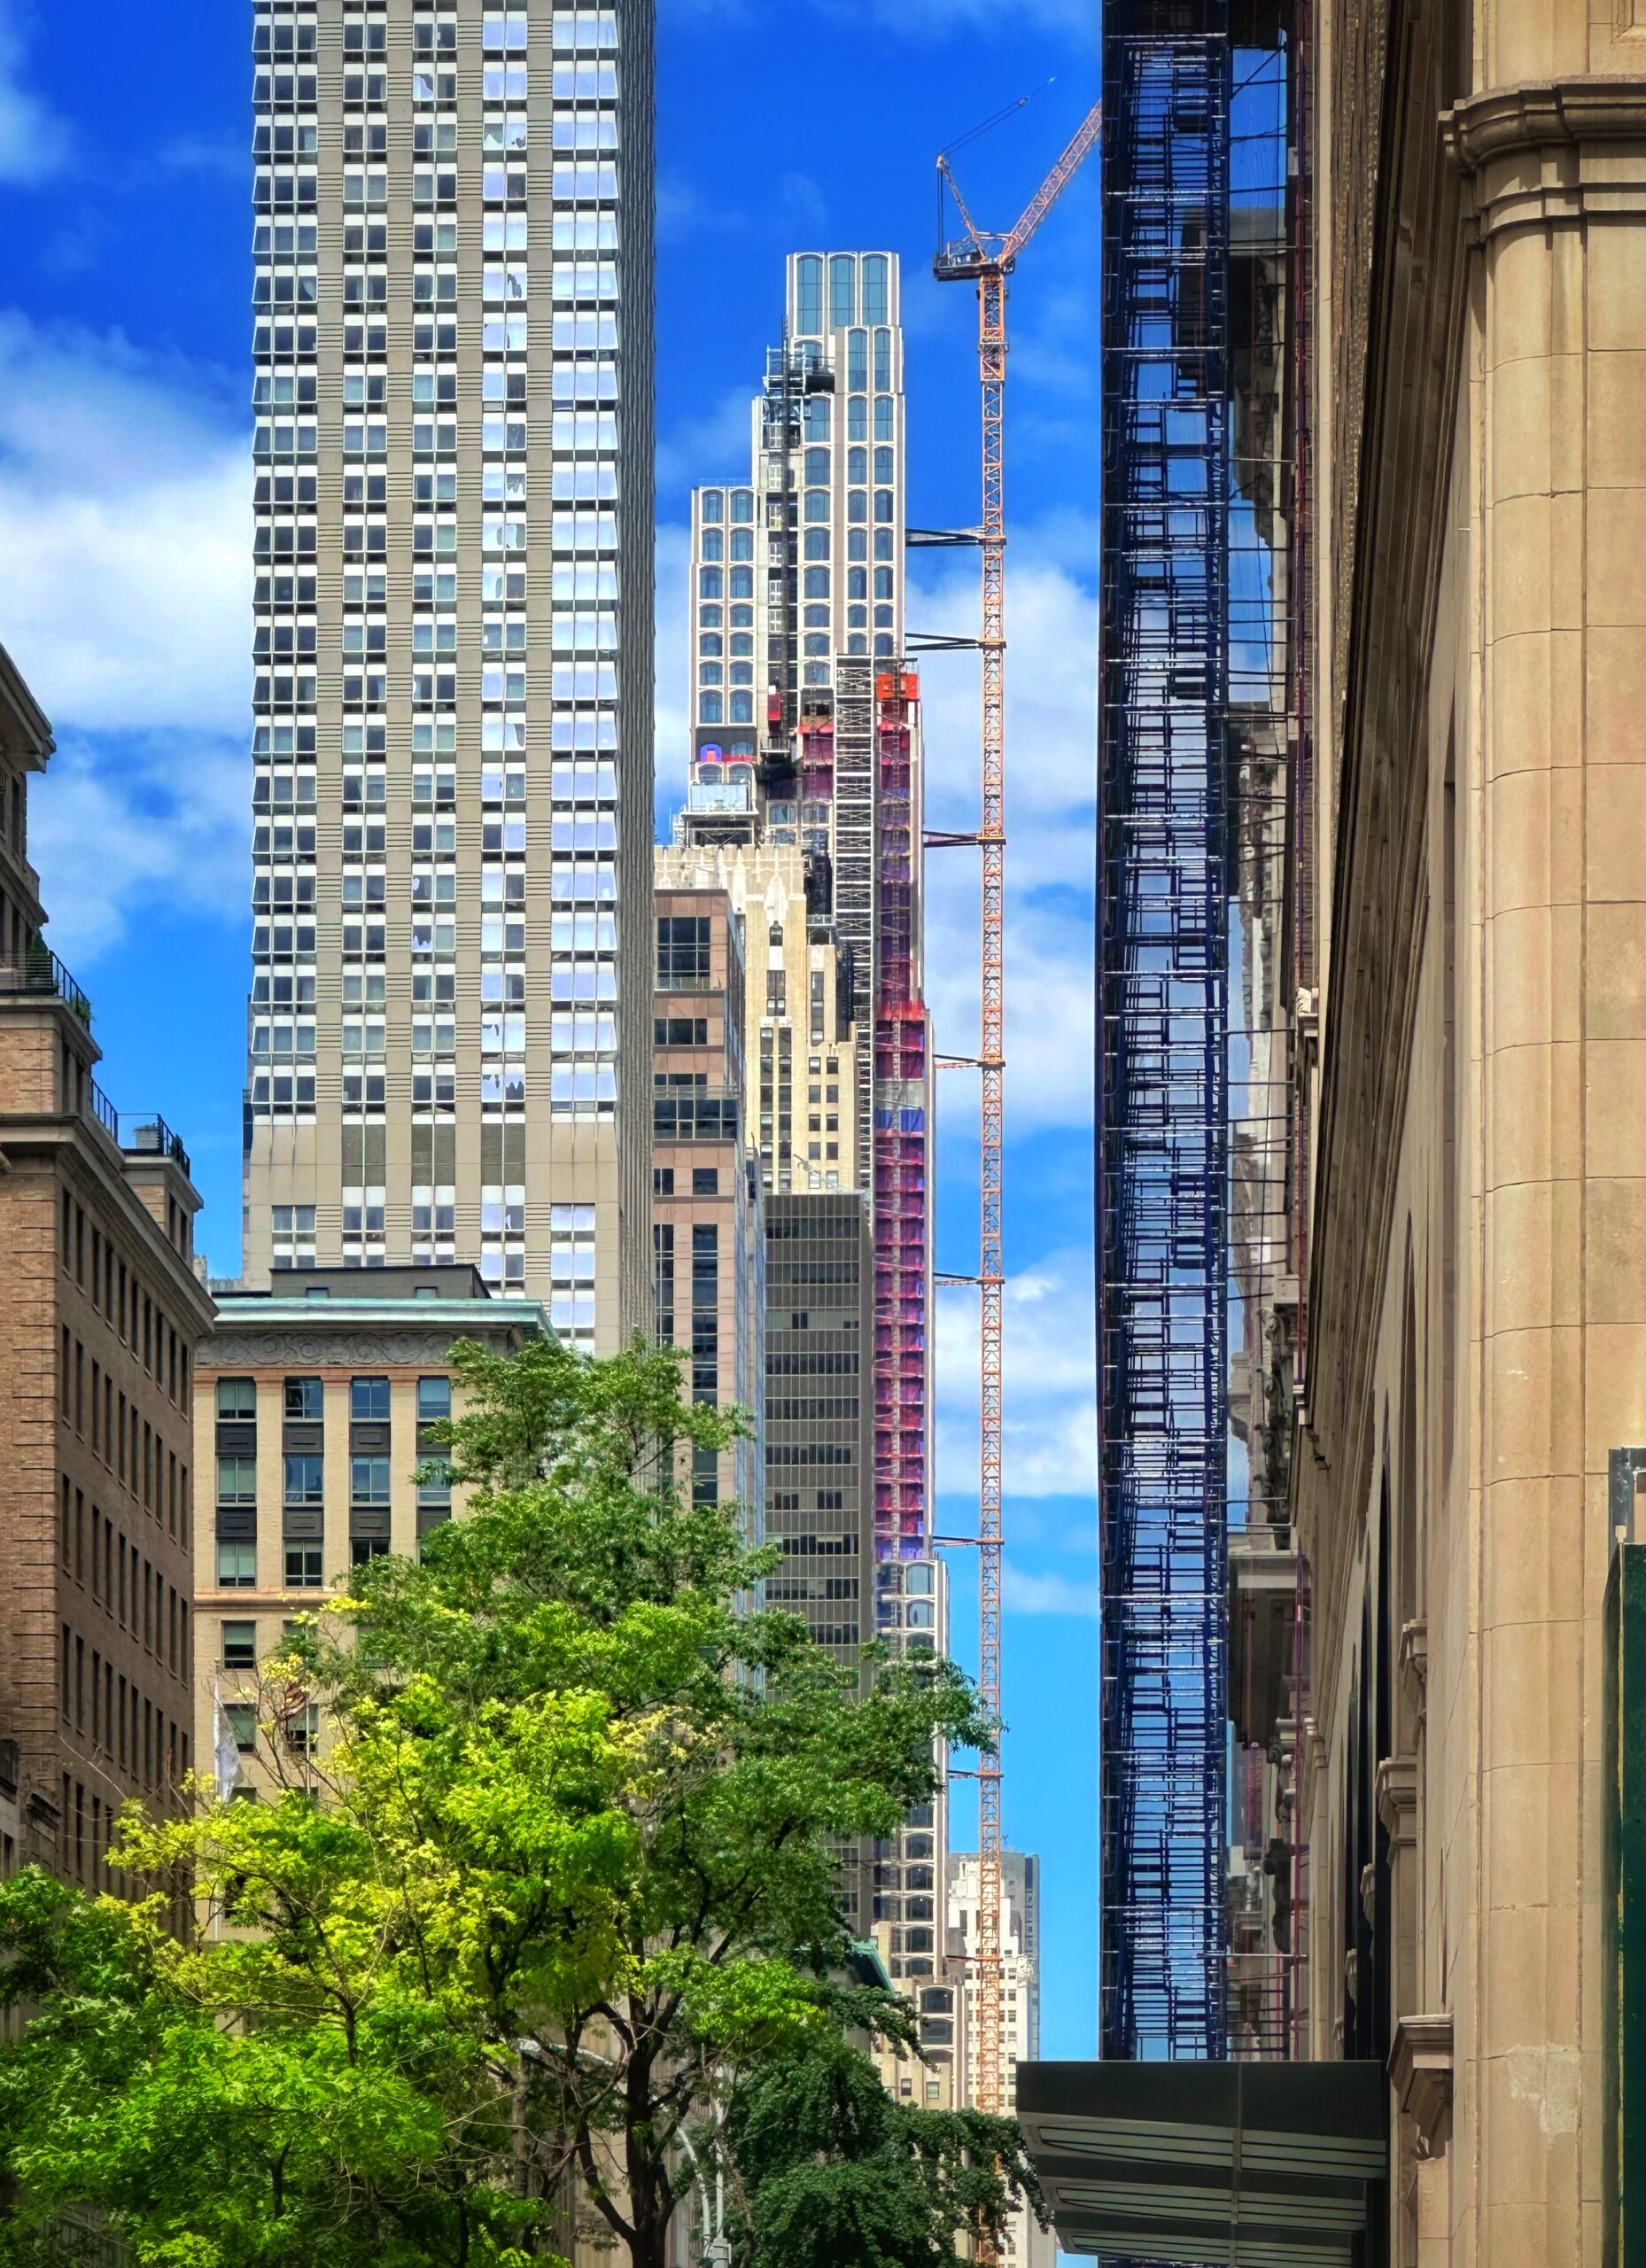
520 Fifth Avenue. Photo by Michael Young.

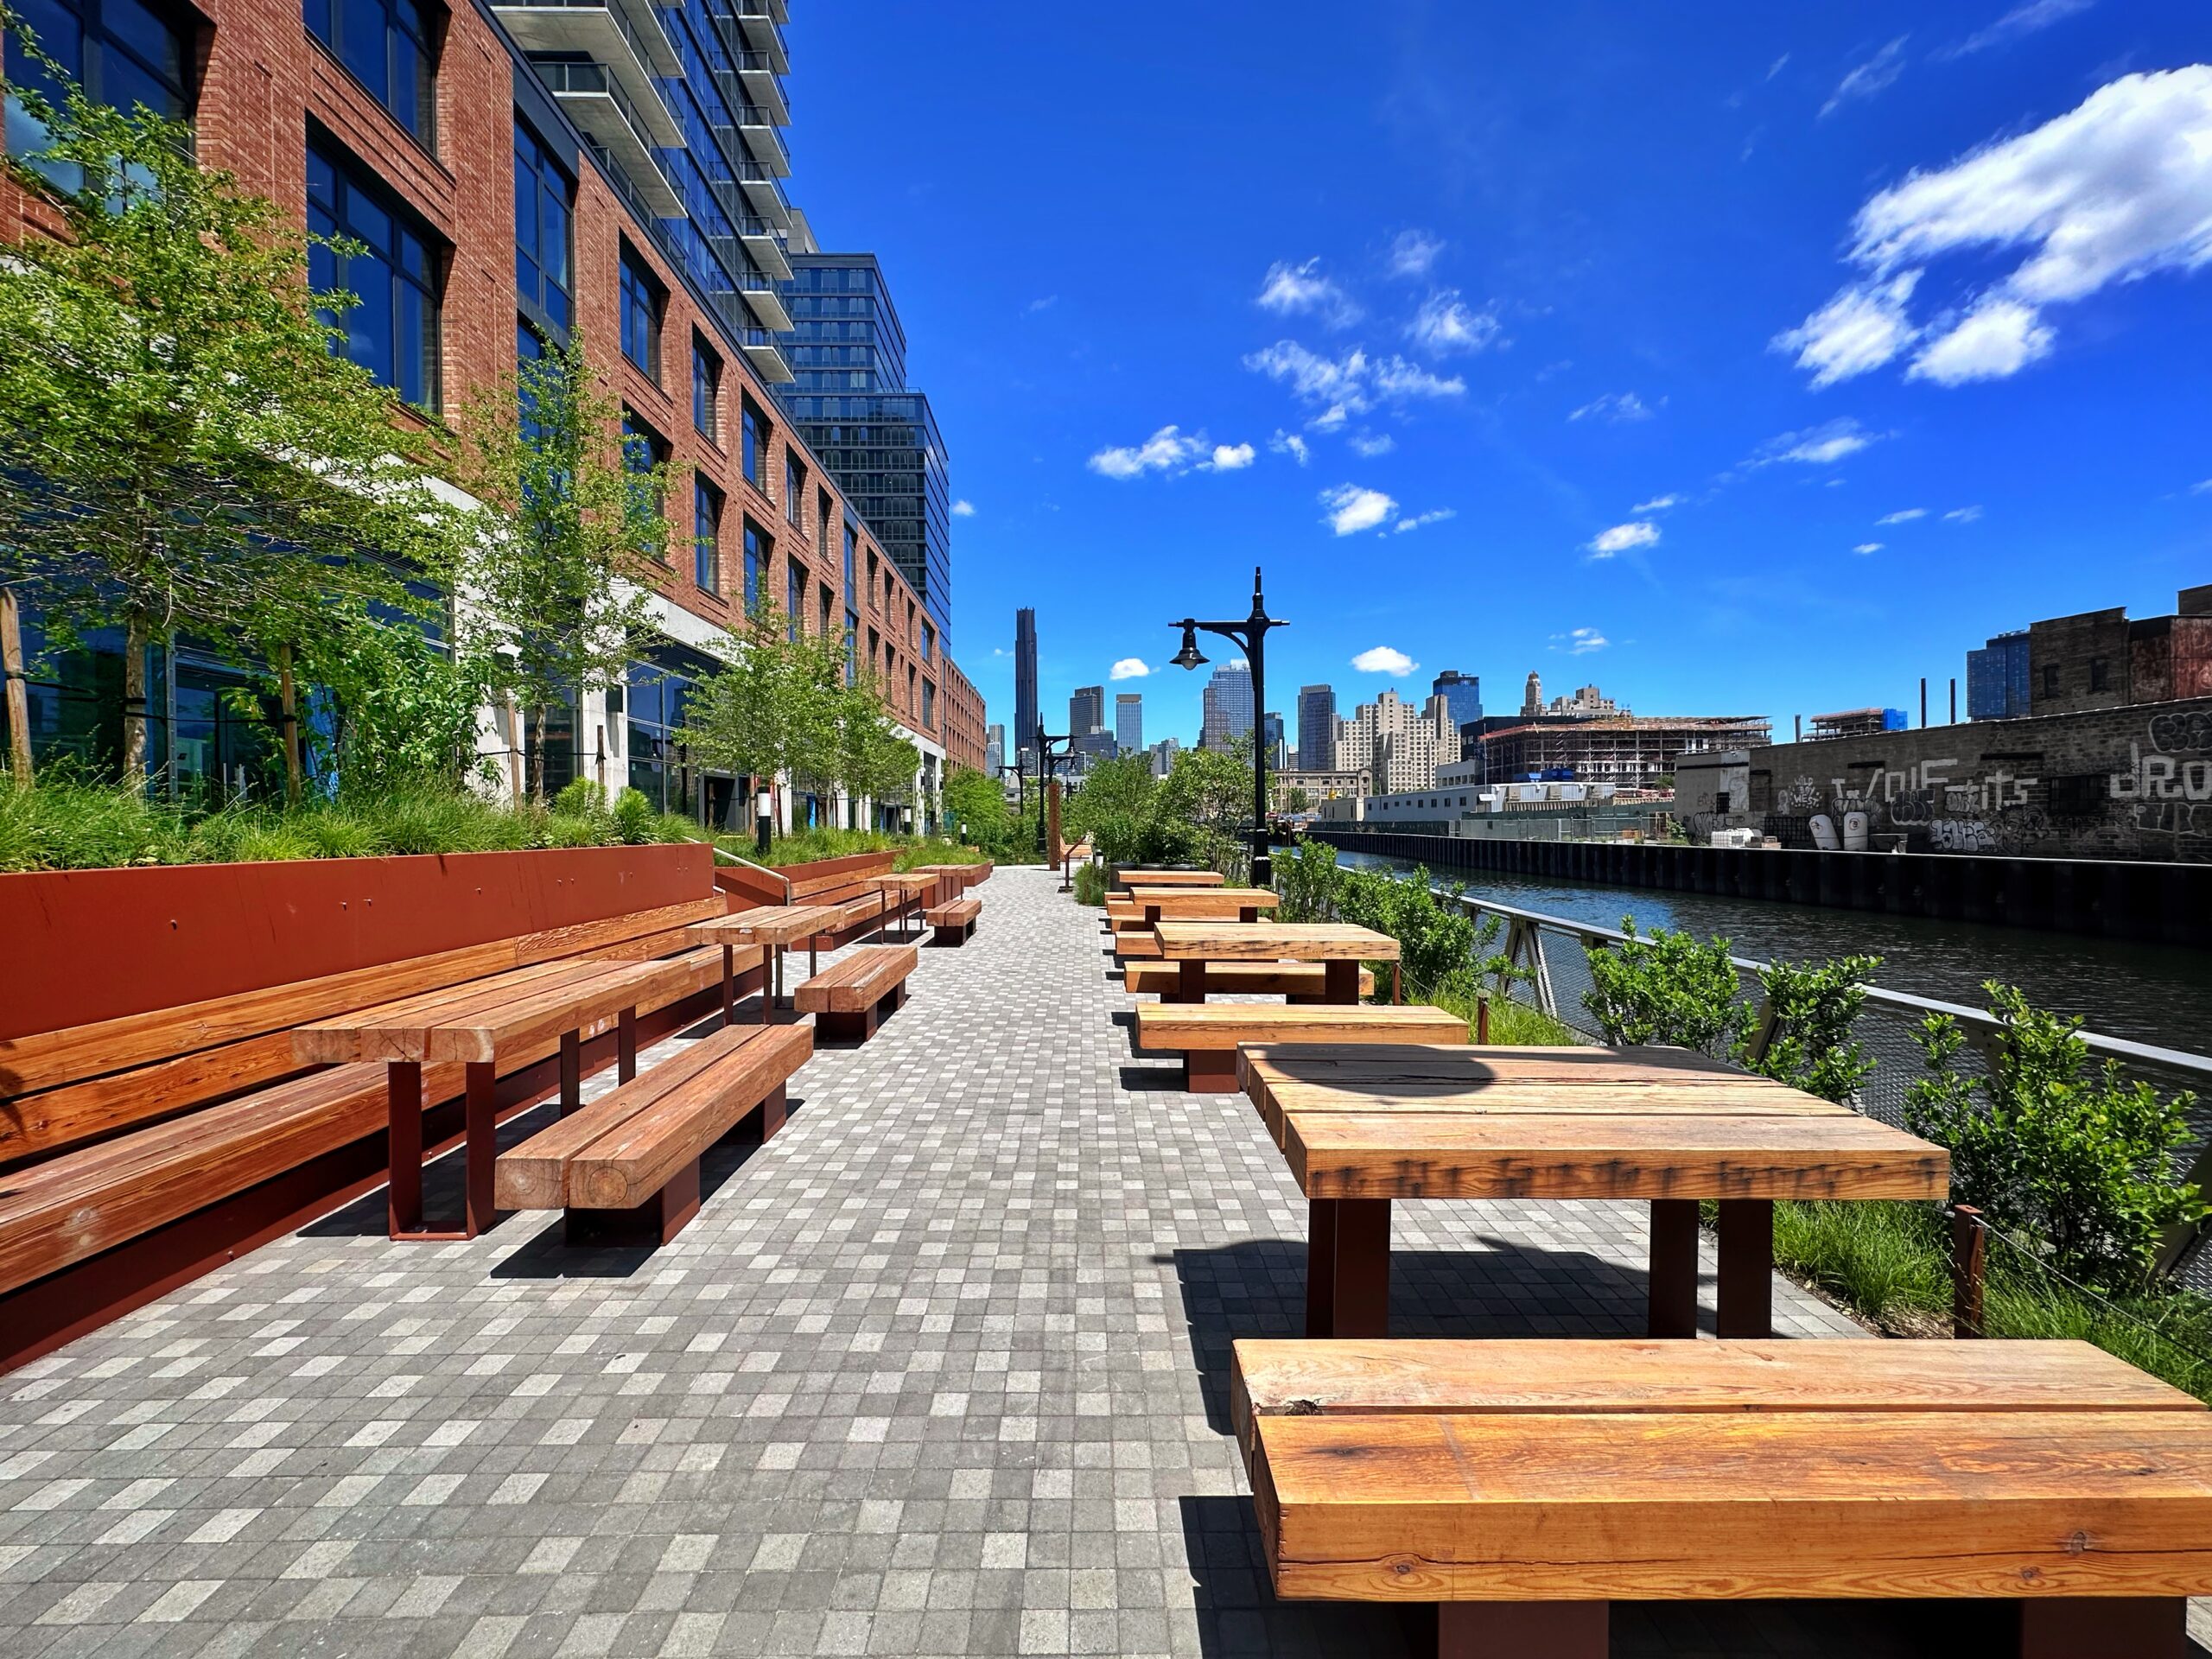
Outdoor seating and landscaping at Society Brooklyn and Sackett Place. Photo by Michael Young.
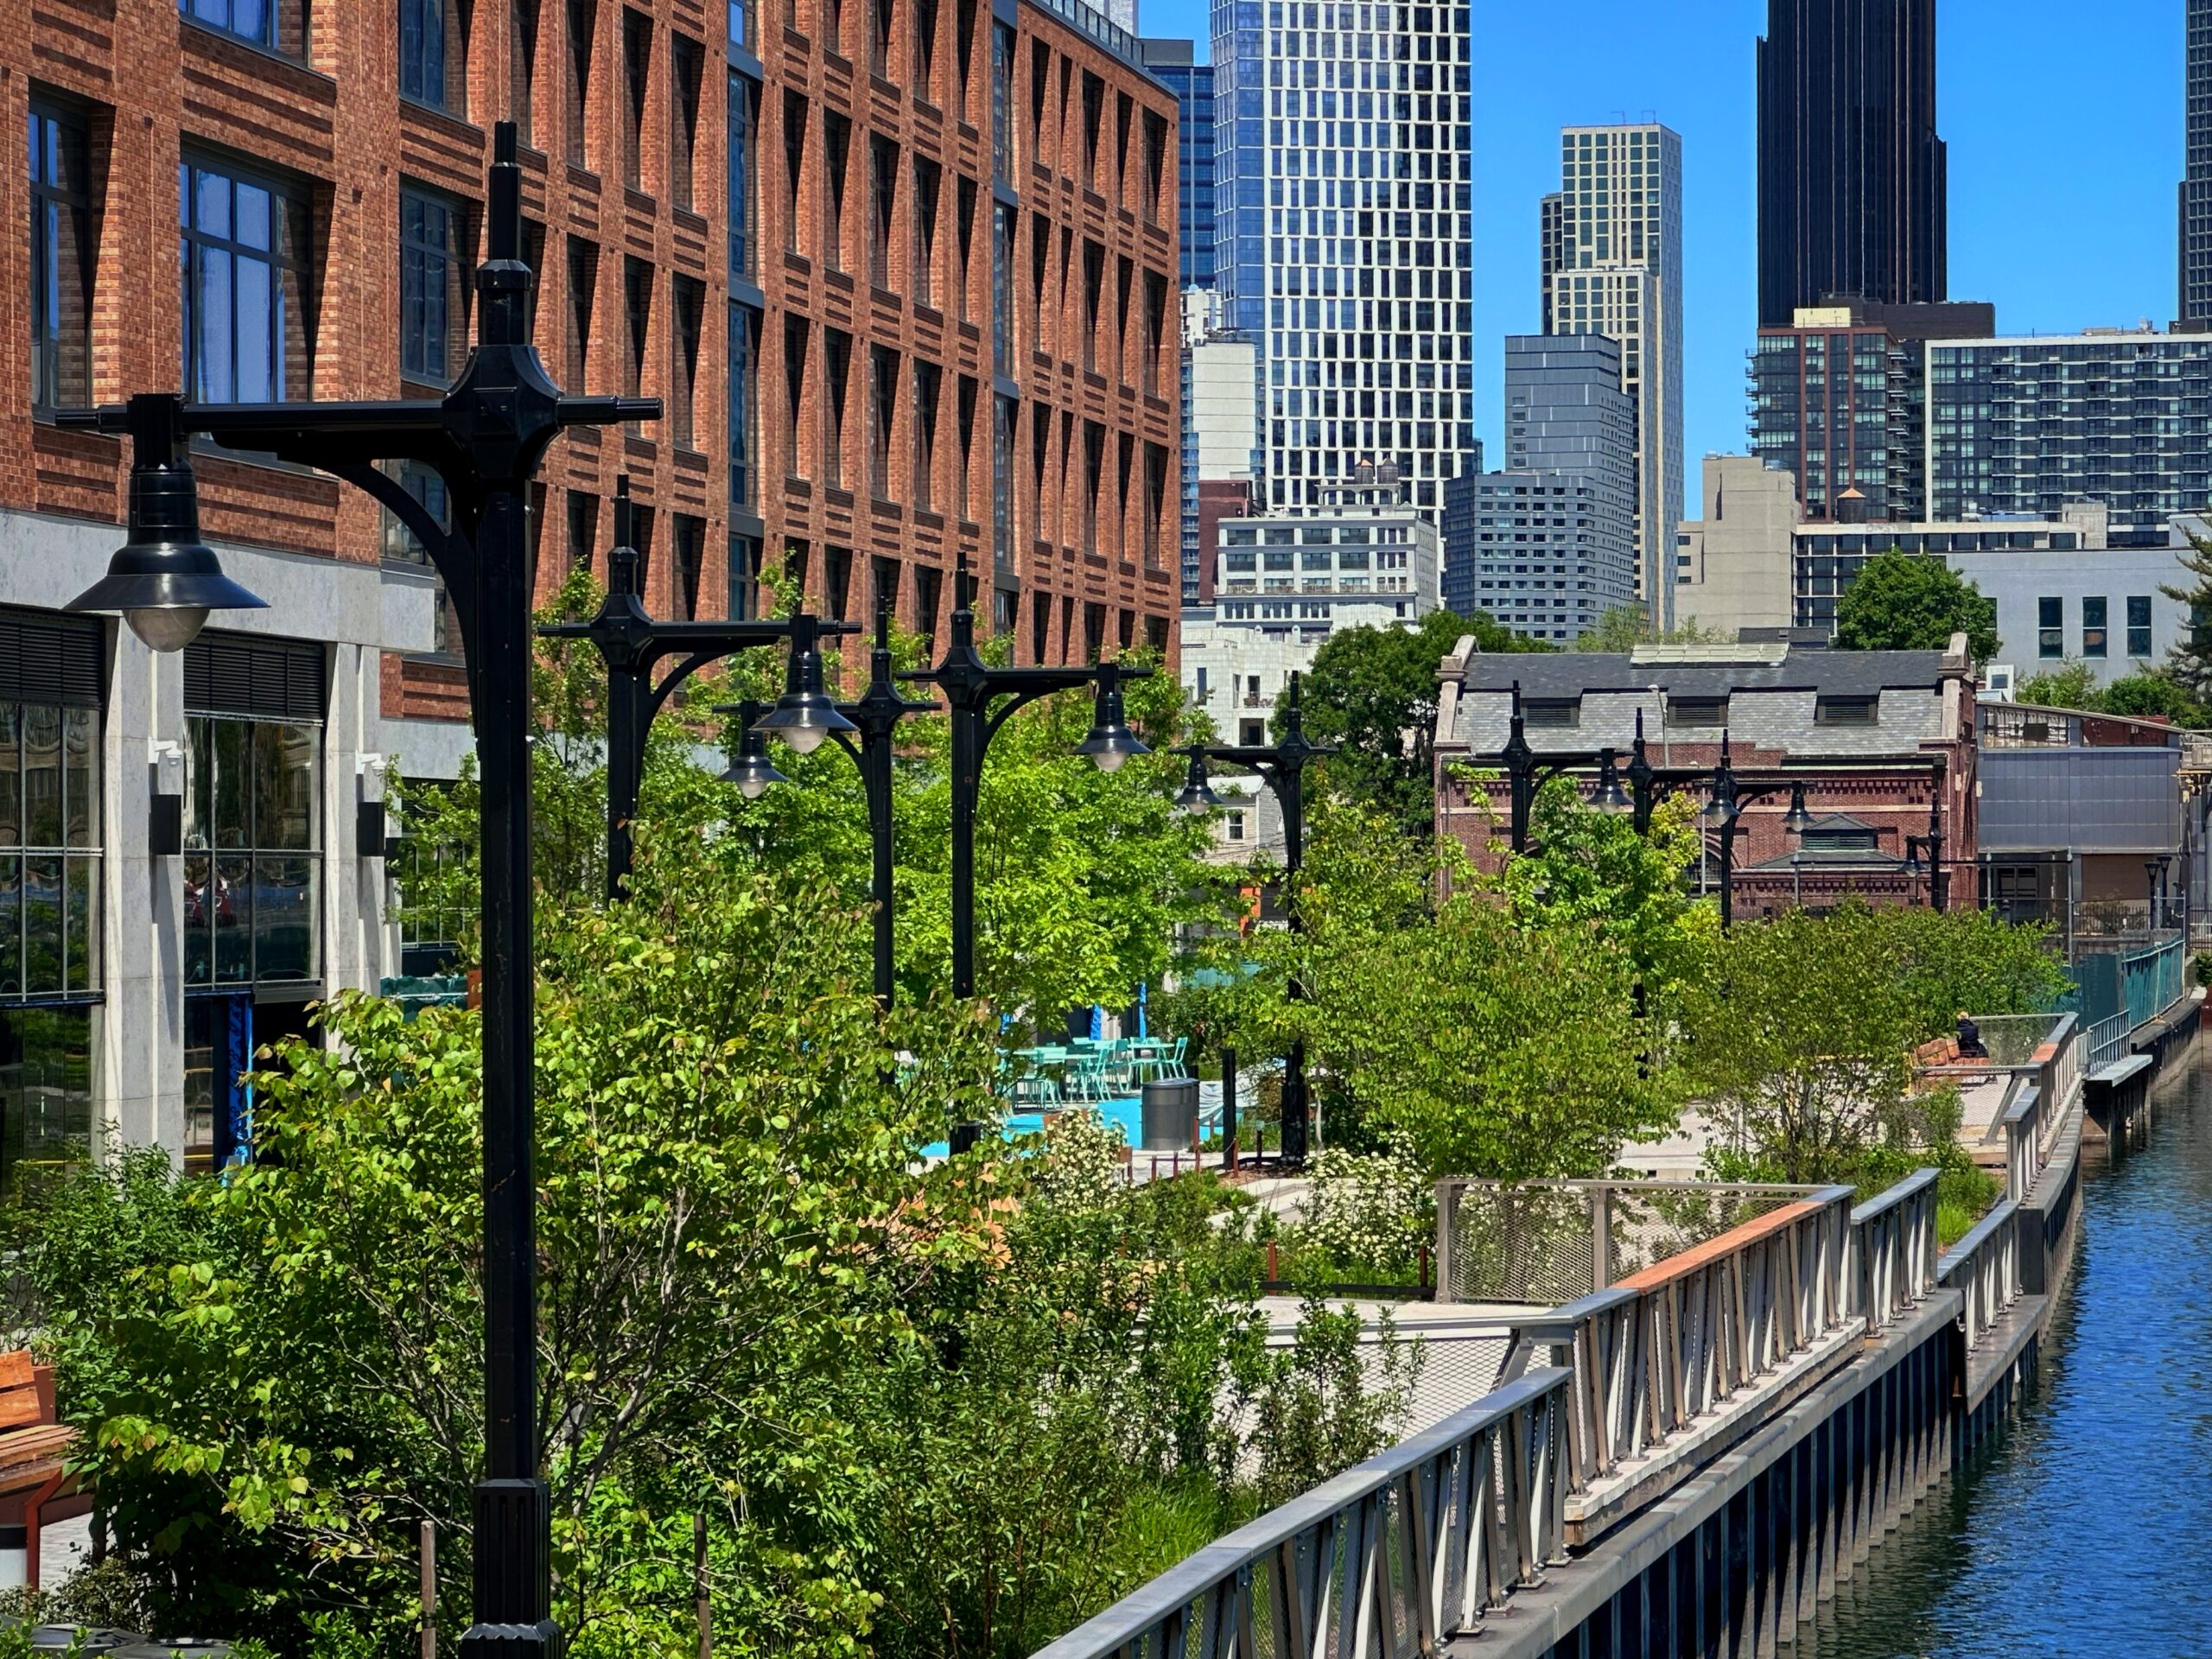
Landscaping at Society Brooklyn and Sackett Place. Photo by Michael Young.
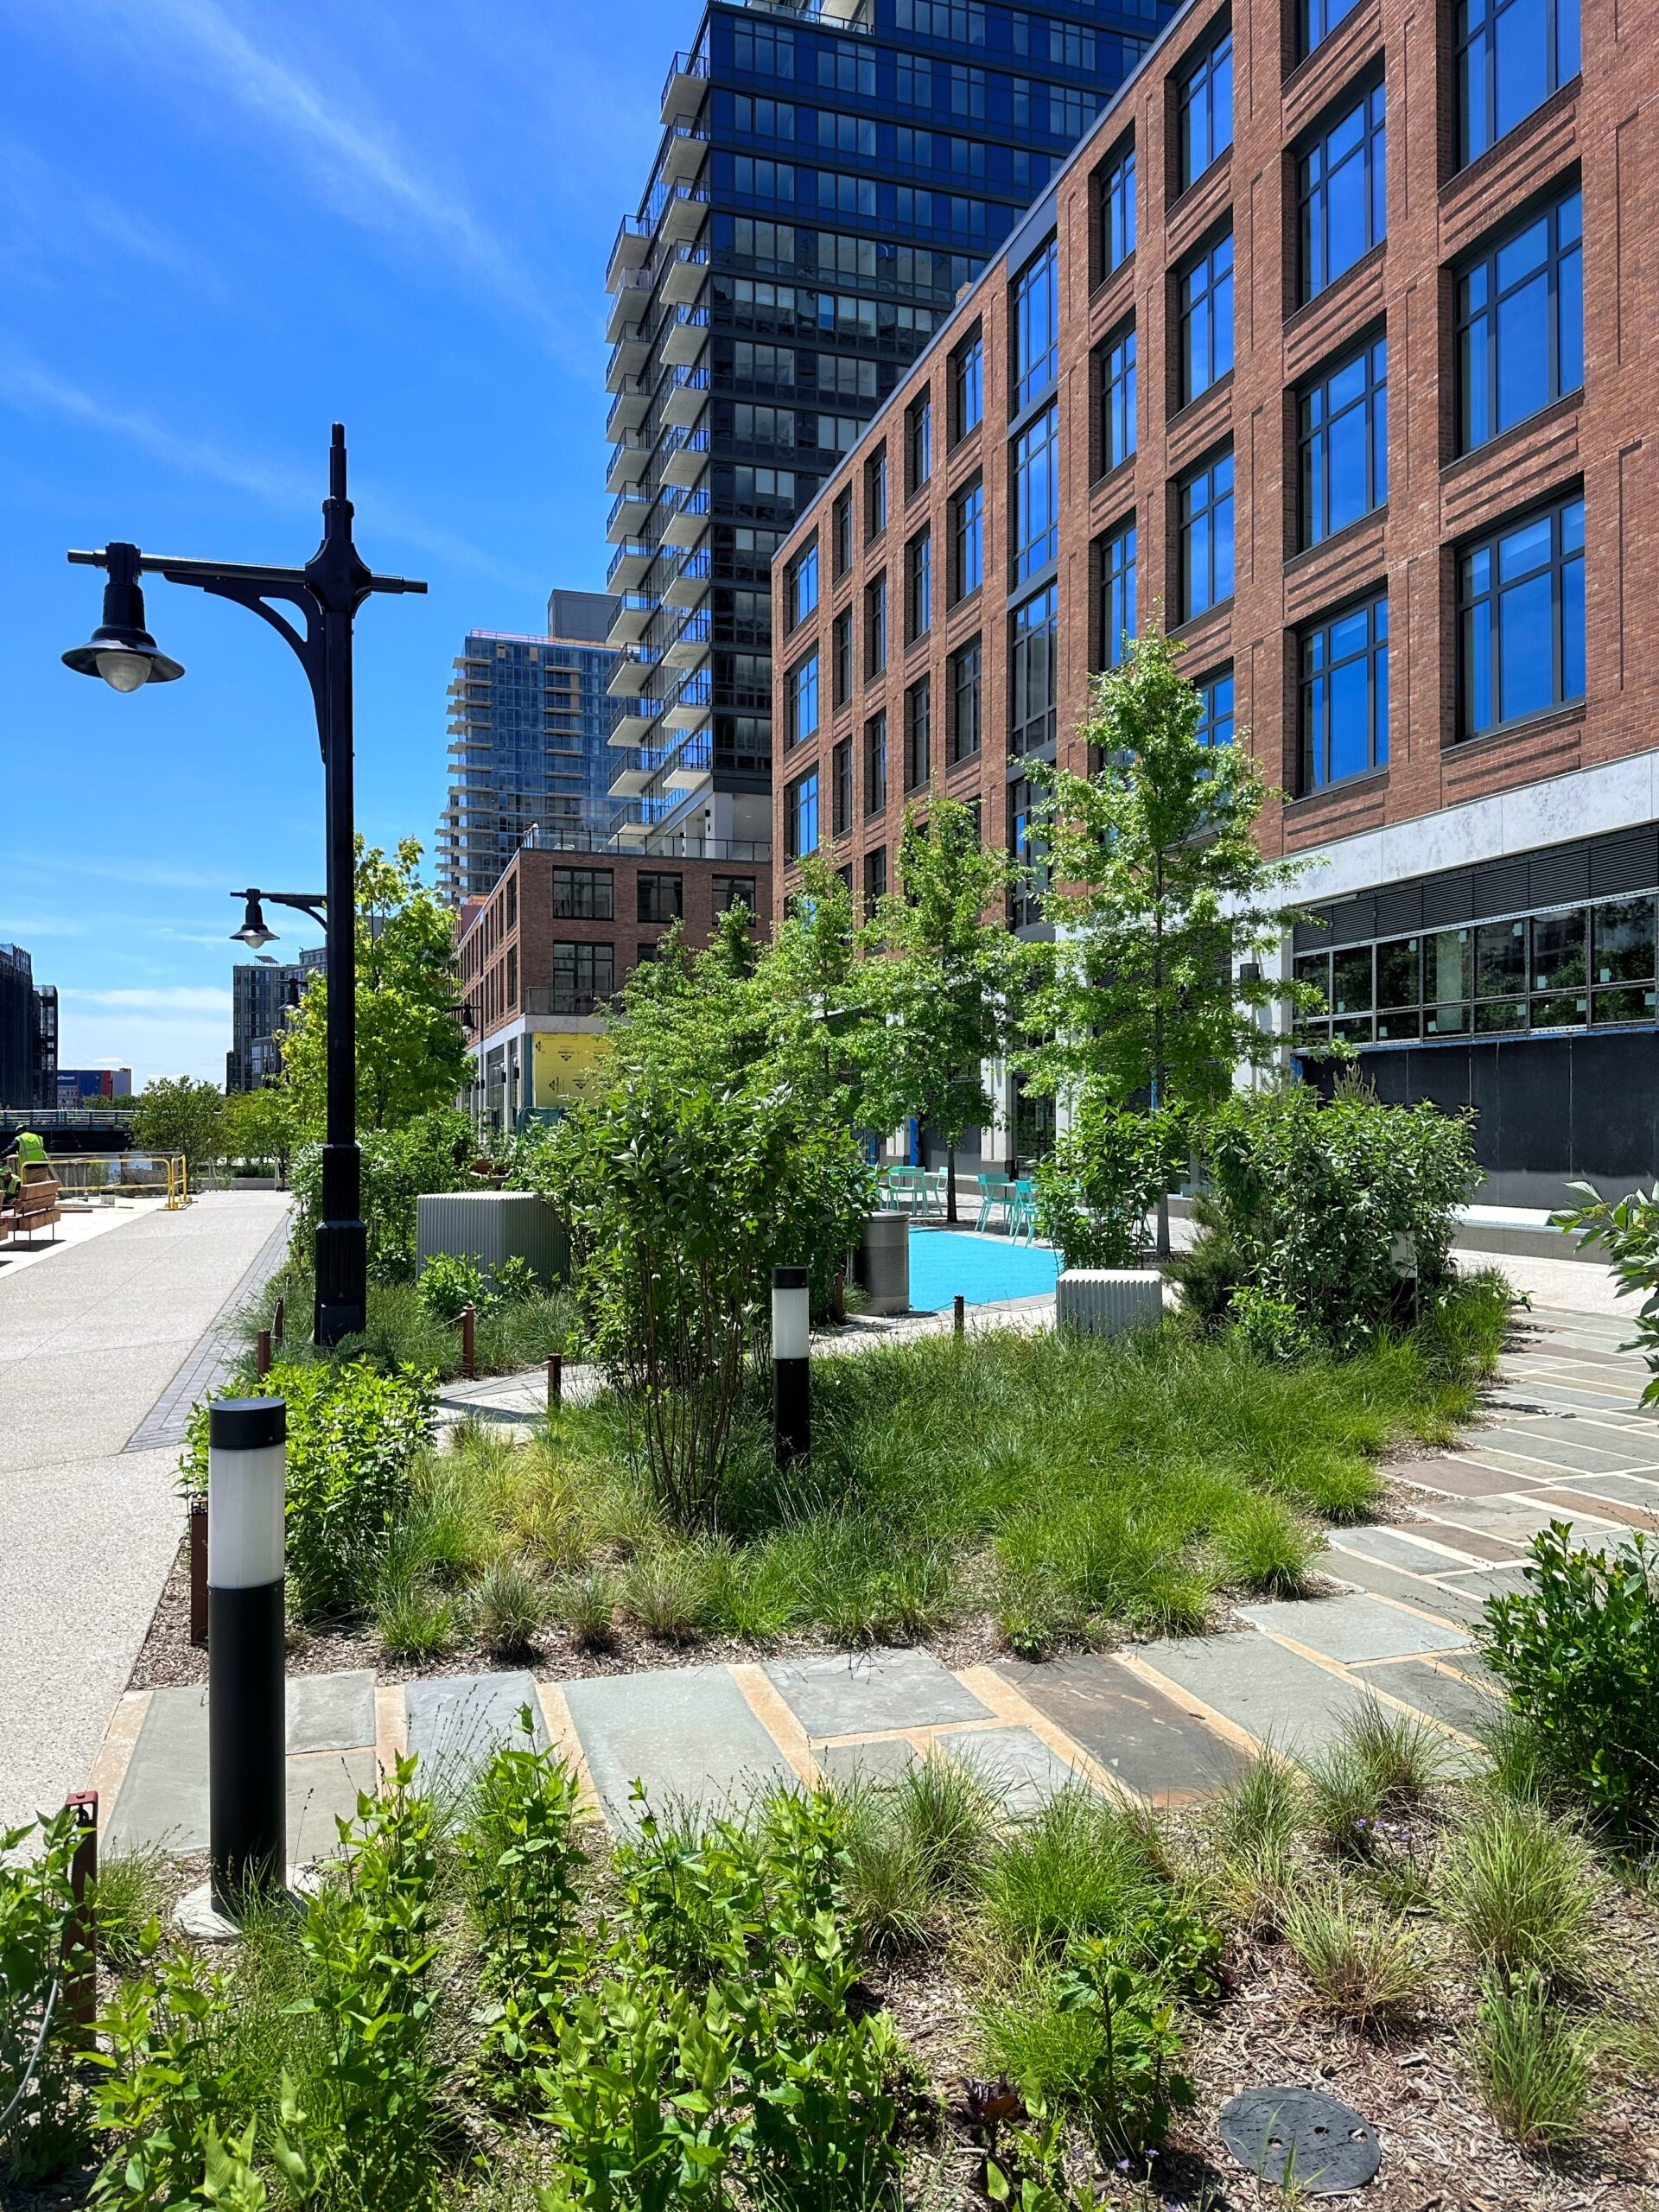
Landscaping at Society Brooklyn and Sackett Place. Photo by Michael Young.
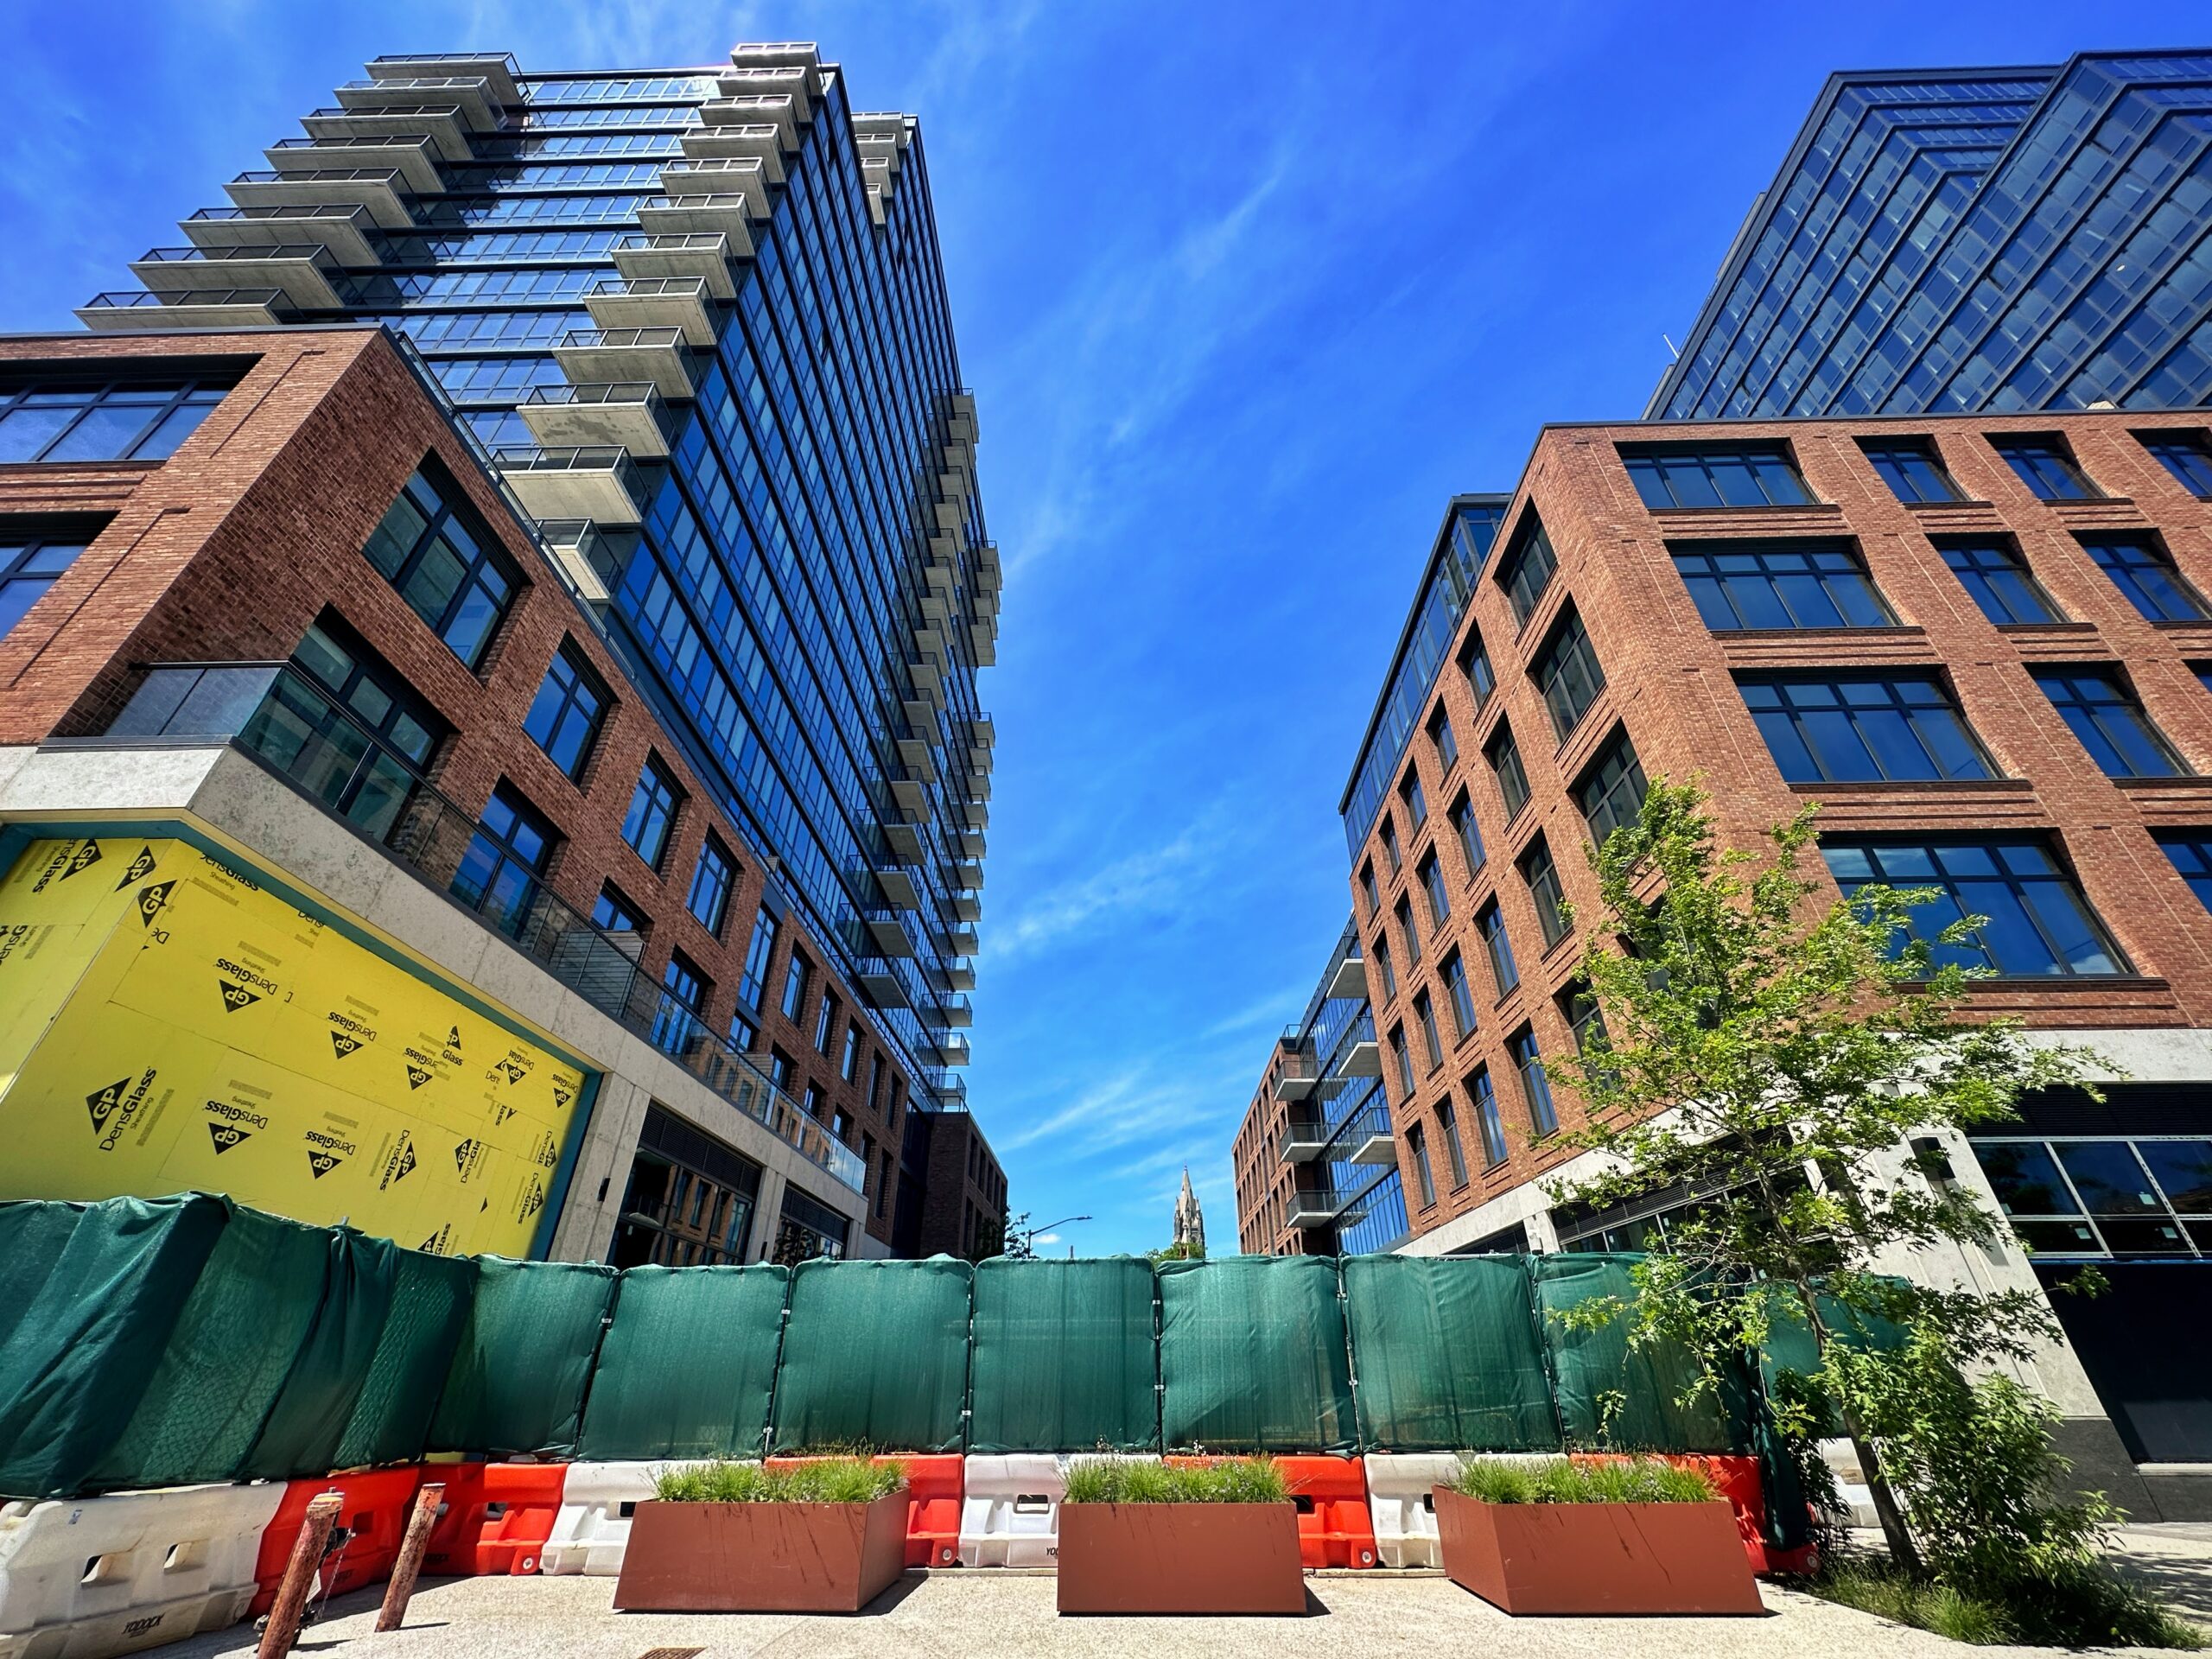
Landscaping at Society Brooklyn and Sackett Place. Photo by Michael Young.
Society Brooklyn and Sackett Place. Photo by Michael Young.
16 Fifth Avenue. Photo by Michael Young.
THE74. Photo by Michael Young.
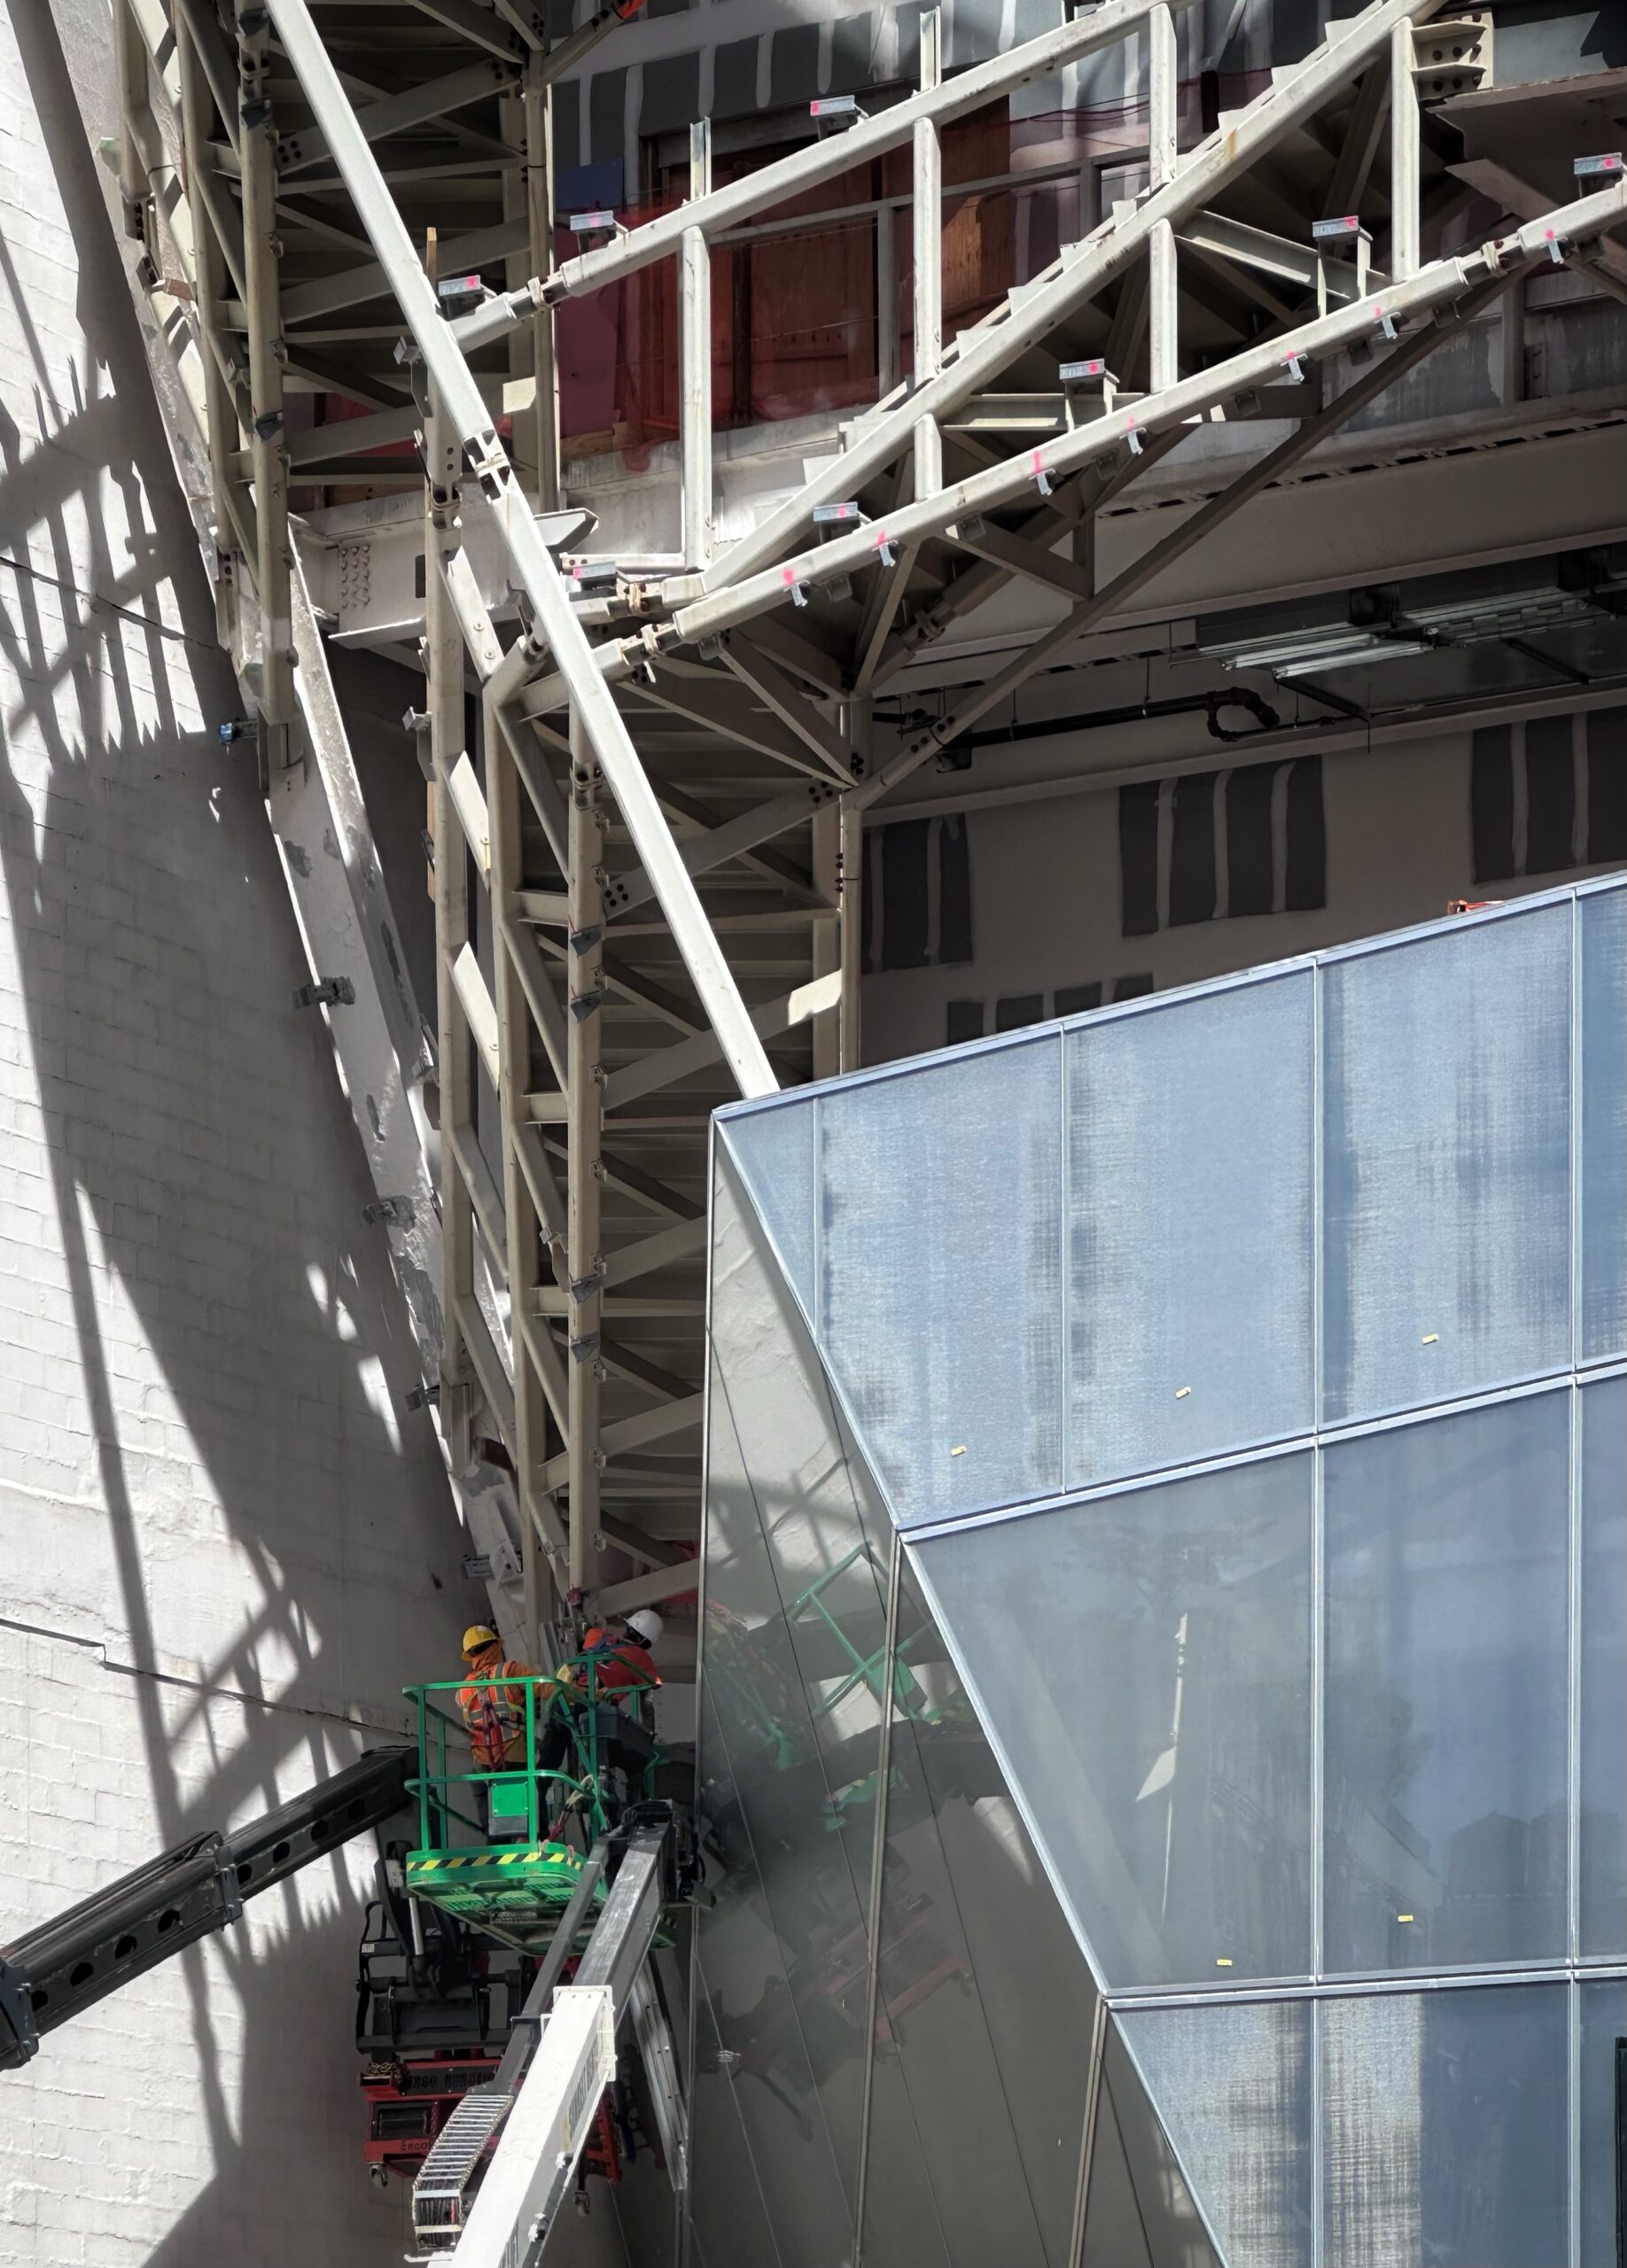
The New Museum. Photo by Michael Young.

272 Greene Avenue. Photo by Michael Young.

Photo by Michael Young.
Photo by Michael Young.
Photo by Michael Young
Photo by Michael Young
Photo by Michael Young.
Photo by Michael Young.
Photo by Michael Young.
Photo by Michael Young.
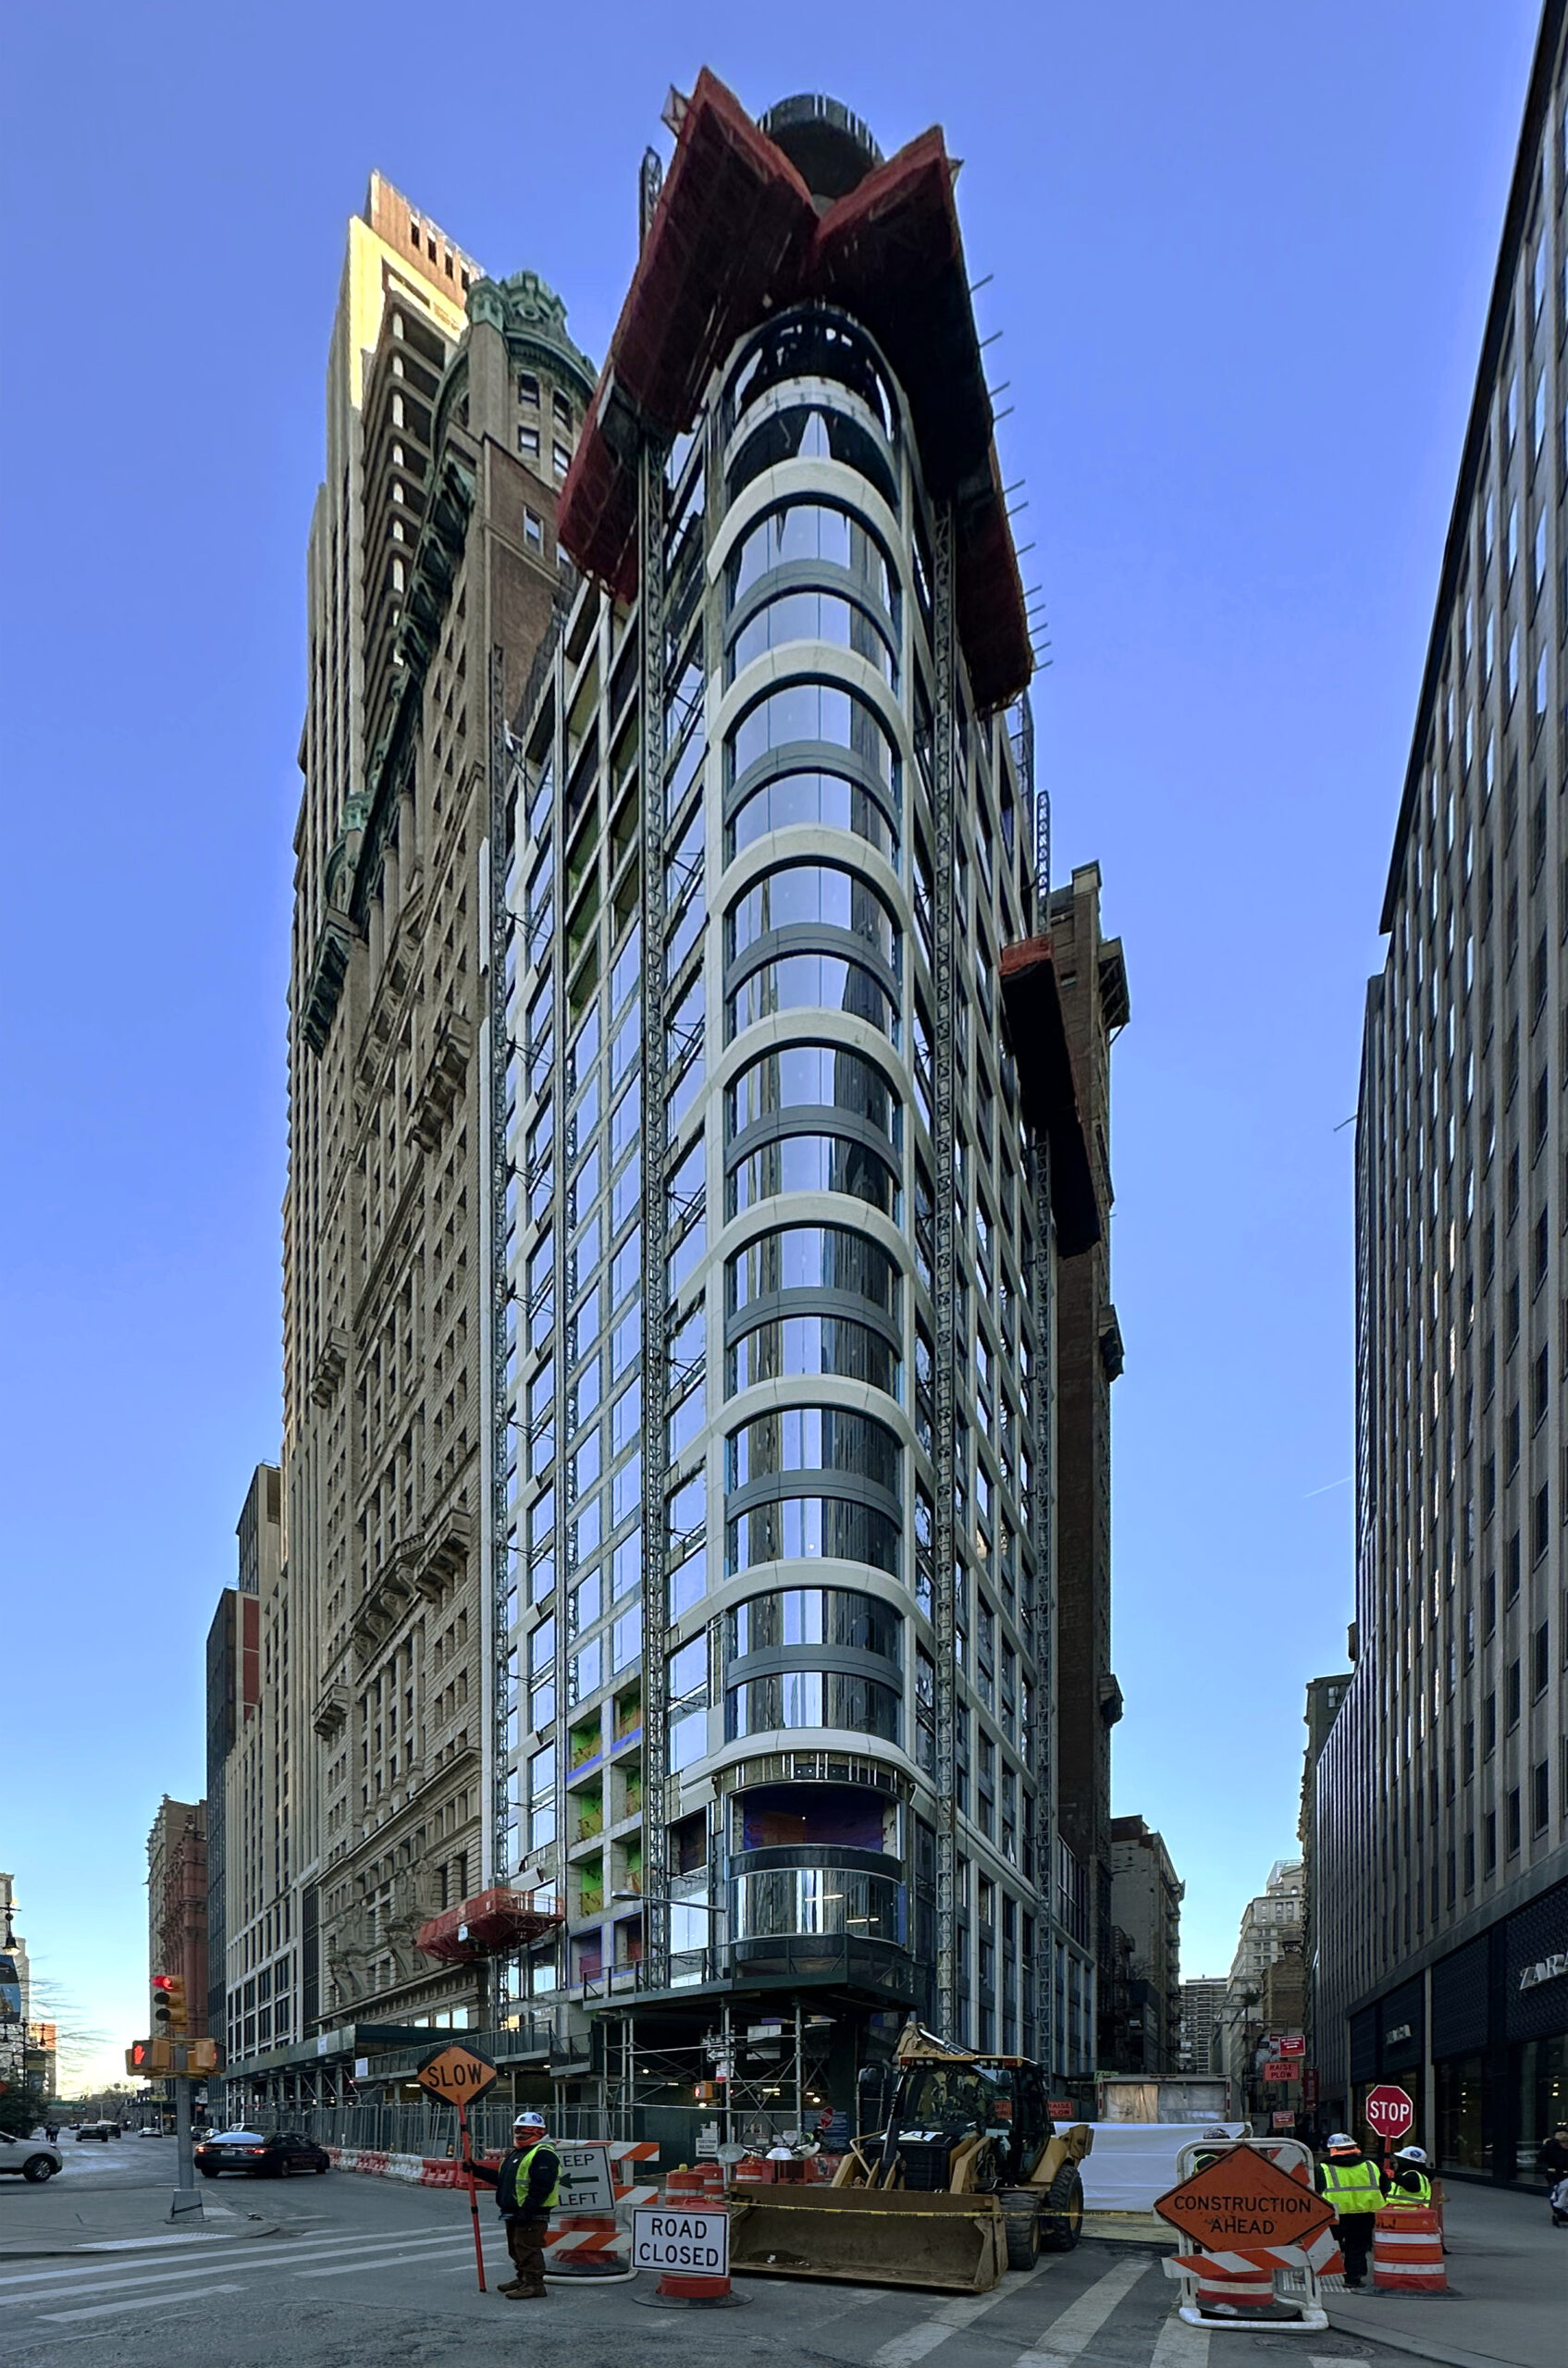
Photo by Michael Young.
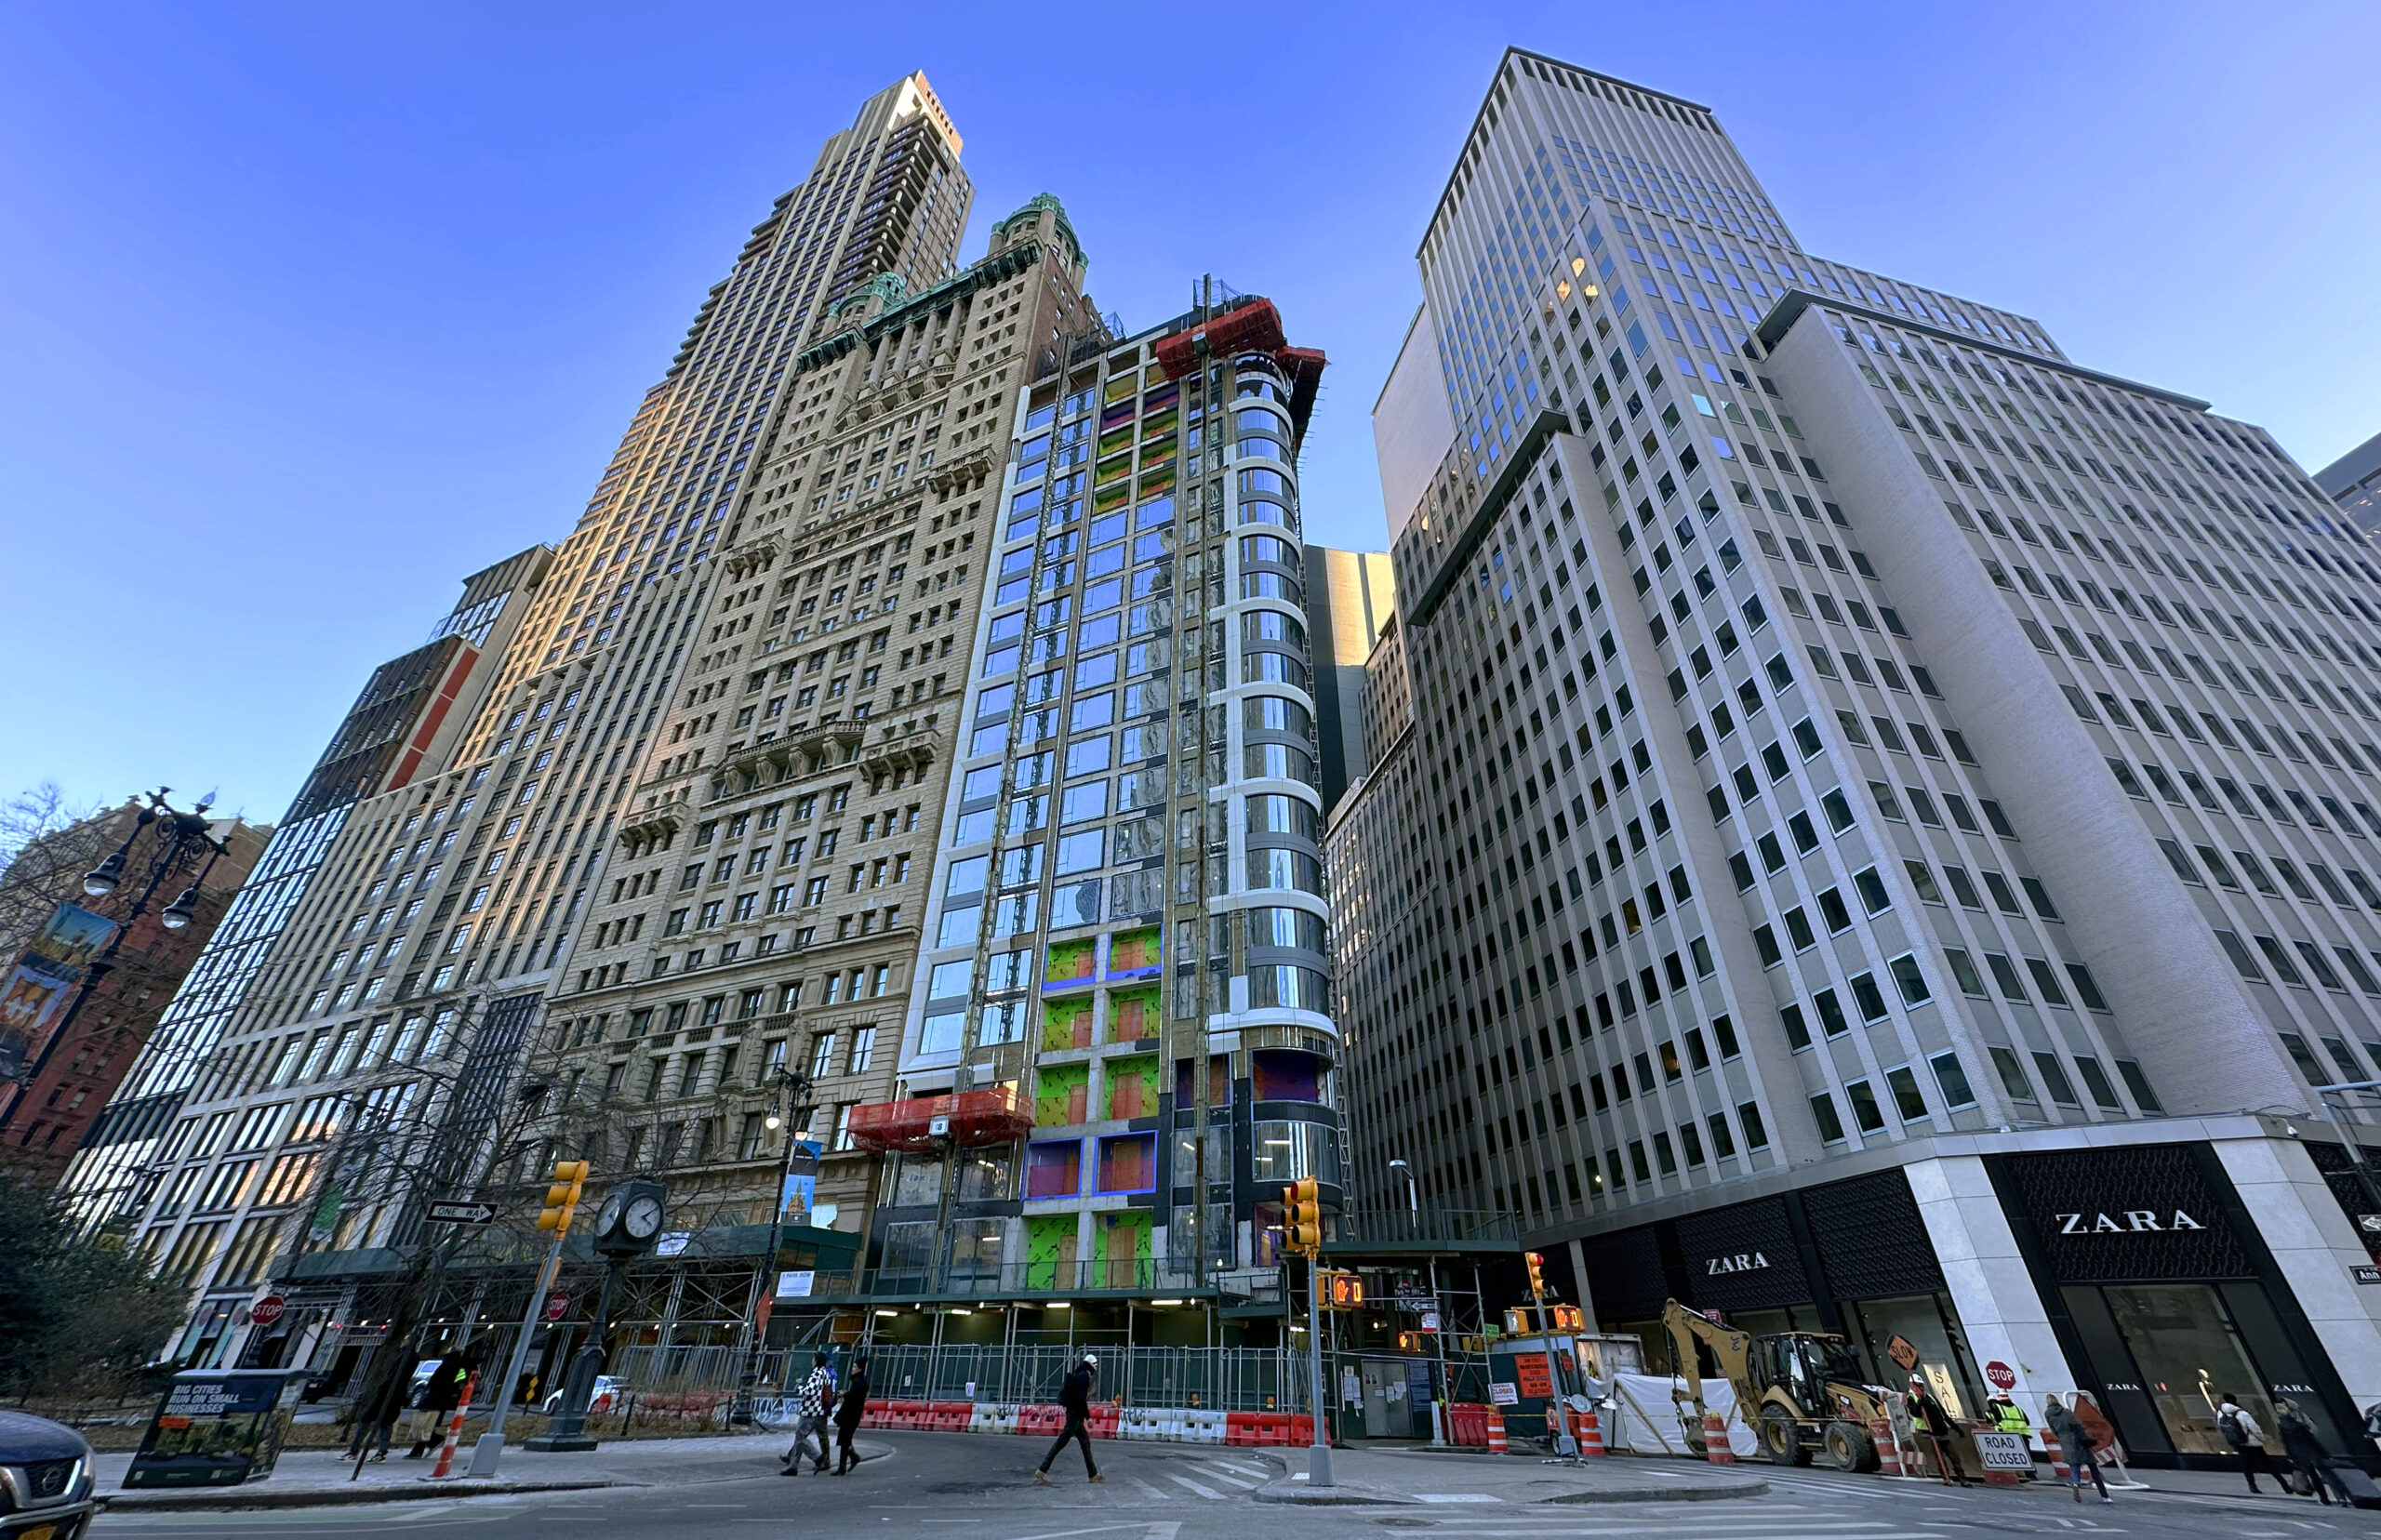
Photo by Michael Young.
Photo by Michael Young.
Subscribe to YIMBY’s daily e-mail
![]()
Follow YIMBYgram for real-time photo updates
Like YIMBY on Facebook
Follow YIMBY’s Twitter for the latest in YIMBYnews
How many affordable units have been created?
More supply, even luxury ones, will make housing more affordable.
stupid question smart answer
Dan’s question was reasonable, he just wanted a percentage of affordable units, nothing “stupid” at all about it..Yes the greater the supply the more affordable, but luxury buildings like 16 Fifth Ave with 14 condos in a 20 story building aren’t going to make much of a dent in the housing shortage.
Manhattan needs to start building and catch up.
How does this volume of construction compare with prior years?
Are we up or down from recent trends?
Exactly.
The gentrification steamroller of Brooklyn..
I suppose zoning regulations is what keeps Queens limited with 2-family developments. It’s a ridiculous lost opportunity. Even allowing just 4 or 6 family projects would make a huge difference.
The biggest problem with queens is that it currently has 2.5 subway lines (the astoria line ends abruptly and is only half a line imo). It just doesn’t have the rapid transit for city hall to want to densify it, and it doesn’t have the density for the MTA to want to build new transit. It’s an unfortunate Catch-22. The biggest hope is the IBX and Queenslink, and a reactivation of Lower Montauk or a Northern Boulevard subway would be nice, too.
I appreciate that you listed the names of the building under most of the photographs
I love these photos.
and Downtown Brooklyn is a city by its self with multiple residential towers with the highest rents, more high price residential towers/buildings will definitely not fix the lack of truly affordable housing crisis