
Just as New Yorkers are getting used to brand new additions to the city’s celebrated skyline like the 1,388-foot-tall colossus of the JPMorgan Chase Tower at 270 Park Avenue, numerous planned skyscrapers are already on the drawing boards throughout the five boroughs. The numbers are in for new building permits filed for with the Department of Buildings in 2025, with a total of 1,972 new permits combining to 67.5 million square feet. These developments, which range from skyline-altering supertalls to humble garages on the city outskirts, will provide a combined total of 57,352 residential and hotel units (predominantly residential), millions of square feet of commercial space, and 248 high-rise buildings with ten or more stories. Below we look in closer detail at the myriad additions the city’s architectural, construction, and development industries have in store for the Big Apple in the near future. The complete data sheet, with fine-grained details on every single project filed for during the year (including detailed info on the parties behind each individual development), is available with a subscription to YIMBY’s Building Wire.
1448 Third Avenue. Photo by Michael Young.
Number of permit filings per month
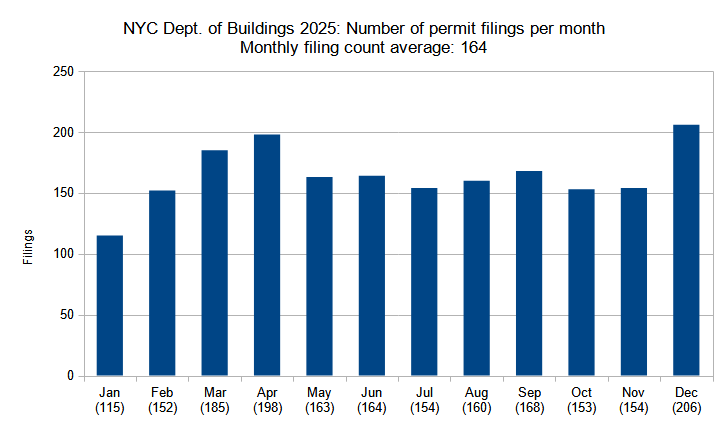
Number of new construction permits filed per month in New York City in 2025. Data source: the Department of Buildings. Data aggregation and graphics credit: Vitali D. Ogorodnikov.
In 2025, New York City saw a generally consistent pattern among monthly filings for new building permits. The first four months registered a steady increase from January, which saw the year’s lowest total of 115 filings, to April, with the year’s second-highest tally of 198. By May, the figure dropped to 163 filings, one point away from the yearly average of 164.
Throughout nearly the rest of the year, monthly totals remained remarkably stable, varying within a ten-point range between the months all the way until November. Finally, December saw another uptick, when a total of 206 new building permit filings registered the year’s highest total and became the only month to rise above the 200-point threshold.
625 Madison Avenue. Photo by Michael Young.
Number of permit filings by borough
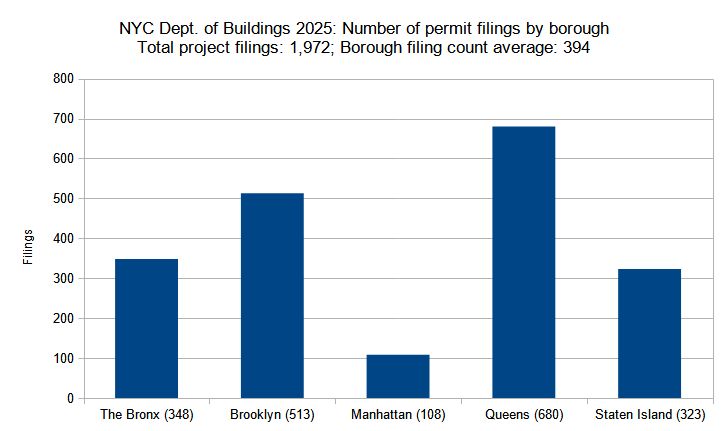
Number of new construction permits filed per borough in New York City in 2025. Data source: the Department of Buildings. Data aggregation and graphics credit: Vitali D. Ogorodnikov.
The 2025 figures for the total number of new building permits filed by borough follow an expected pattern, self-evident in the city’s urban fabric and confirmed by previous annual tallies, where the denser and more vertically oriented the borough is, the fewer permits are registered (although the size of the proposed buildings tends to increase in an inverse proportion to filing number totals).
Below are the numbers of new building permits filed per borough in 2025:
- The Bronx – 348 permits (18 percent of the total)
- Brooklyn – 513 permits (26 percent of the total)
- Manhattan – 108 permits (5 percent of the total)
- Queens – 680 permits (34 percent of the total)
- Staten Island – 323 permits (16 percent of the total)
Of the 1,972 new building permit filings registered in 2025, more than one-third (348 permits, or 34 percent of the total) were situated in Queens, the city’s largest borough, where a diverse urban makeup ranges from the shiny new skyscrapers of Long Island City to quasi-suburbia on its eastern and southern fringes.
Around one-quarter of the filings (513 permits, or 26 percent) were found in Brooklyn, and just under one-fifth in The Bronx (348 permits, or 18 percent). Staten Island lags slightly behind (323 permits, or 16 percent), and Manhattan rounds off the pack with just 108 permit filings, or 5 percent of the city total.
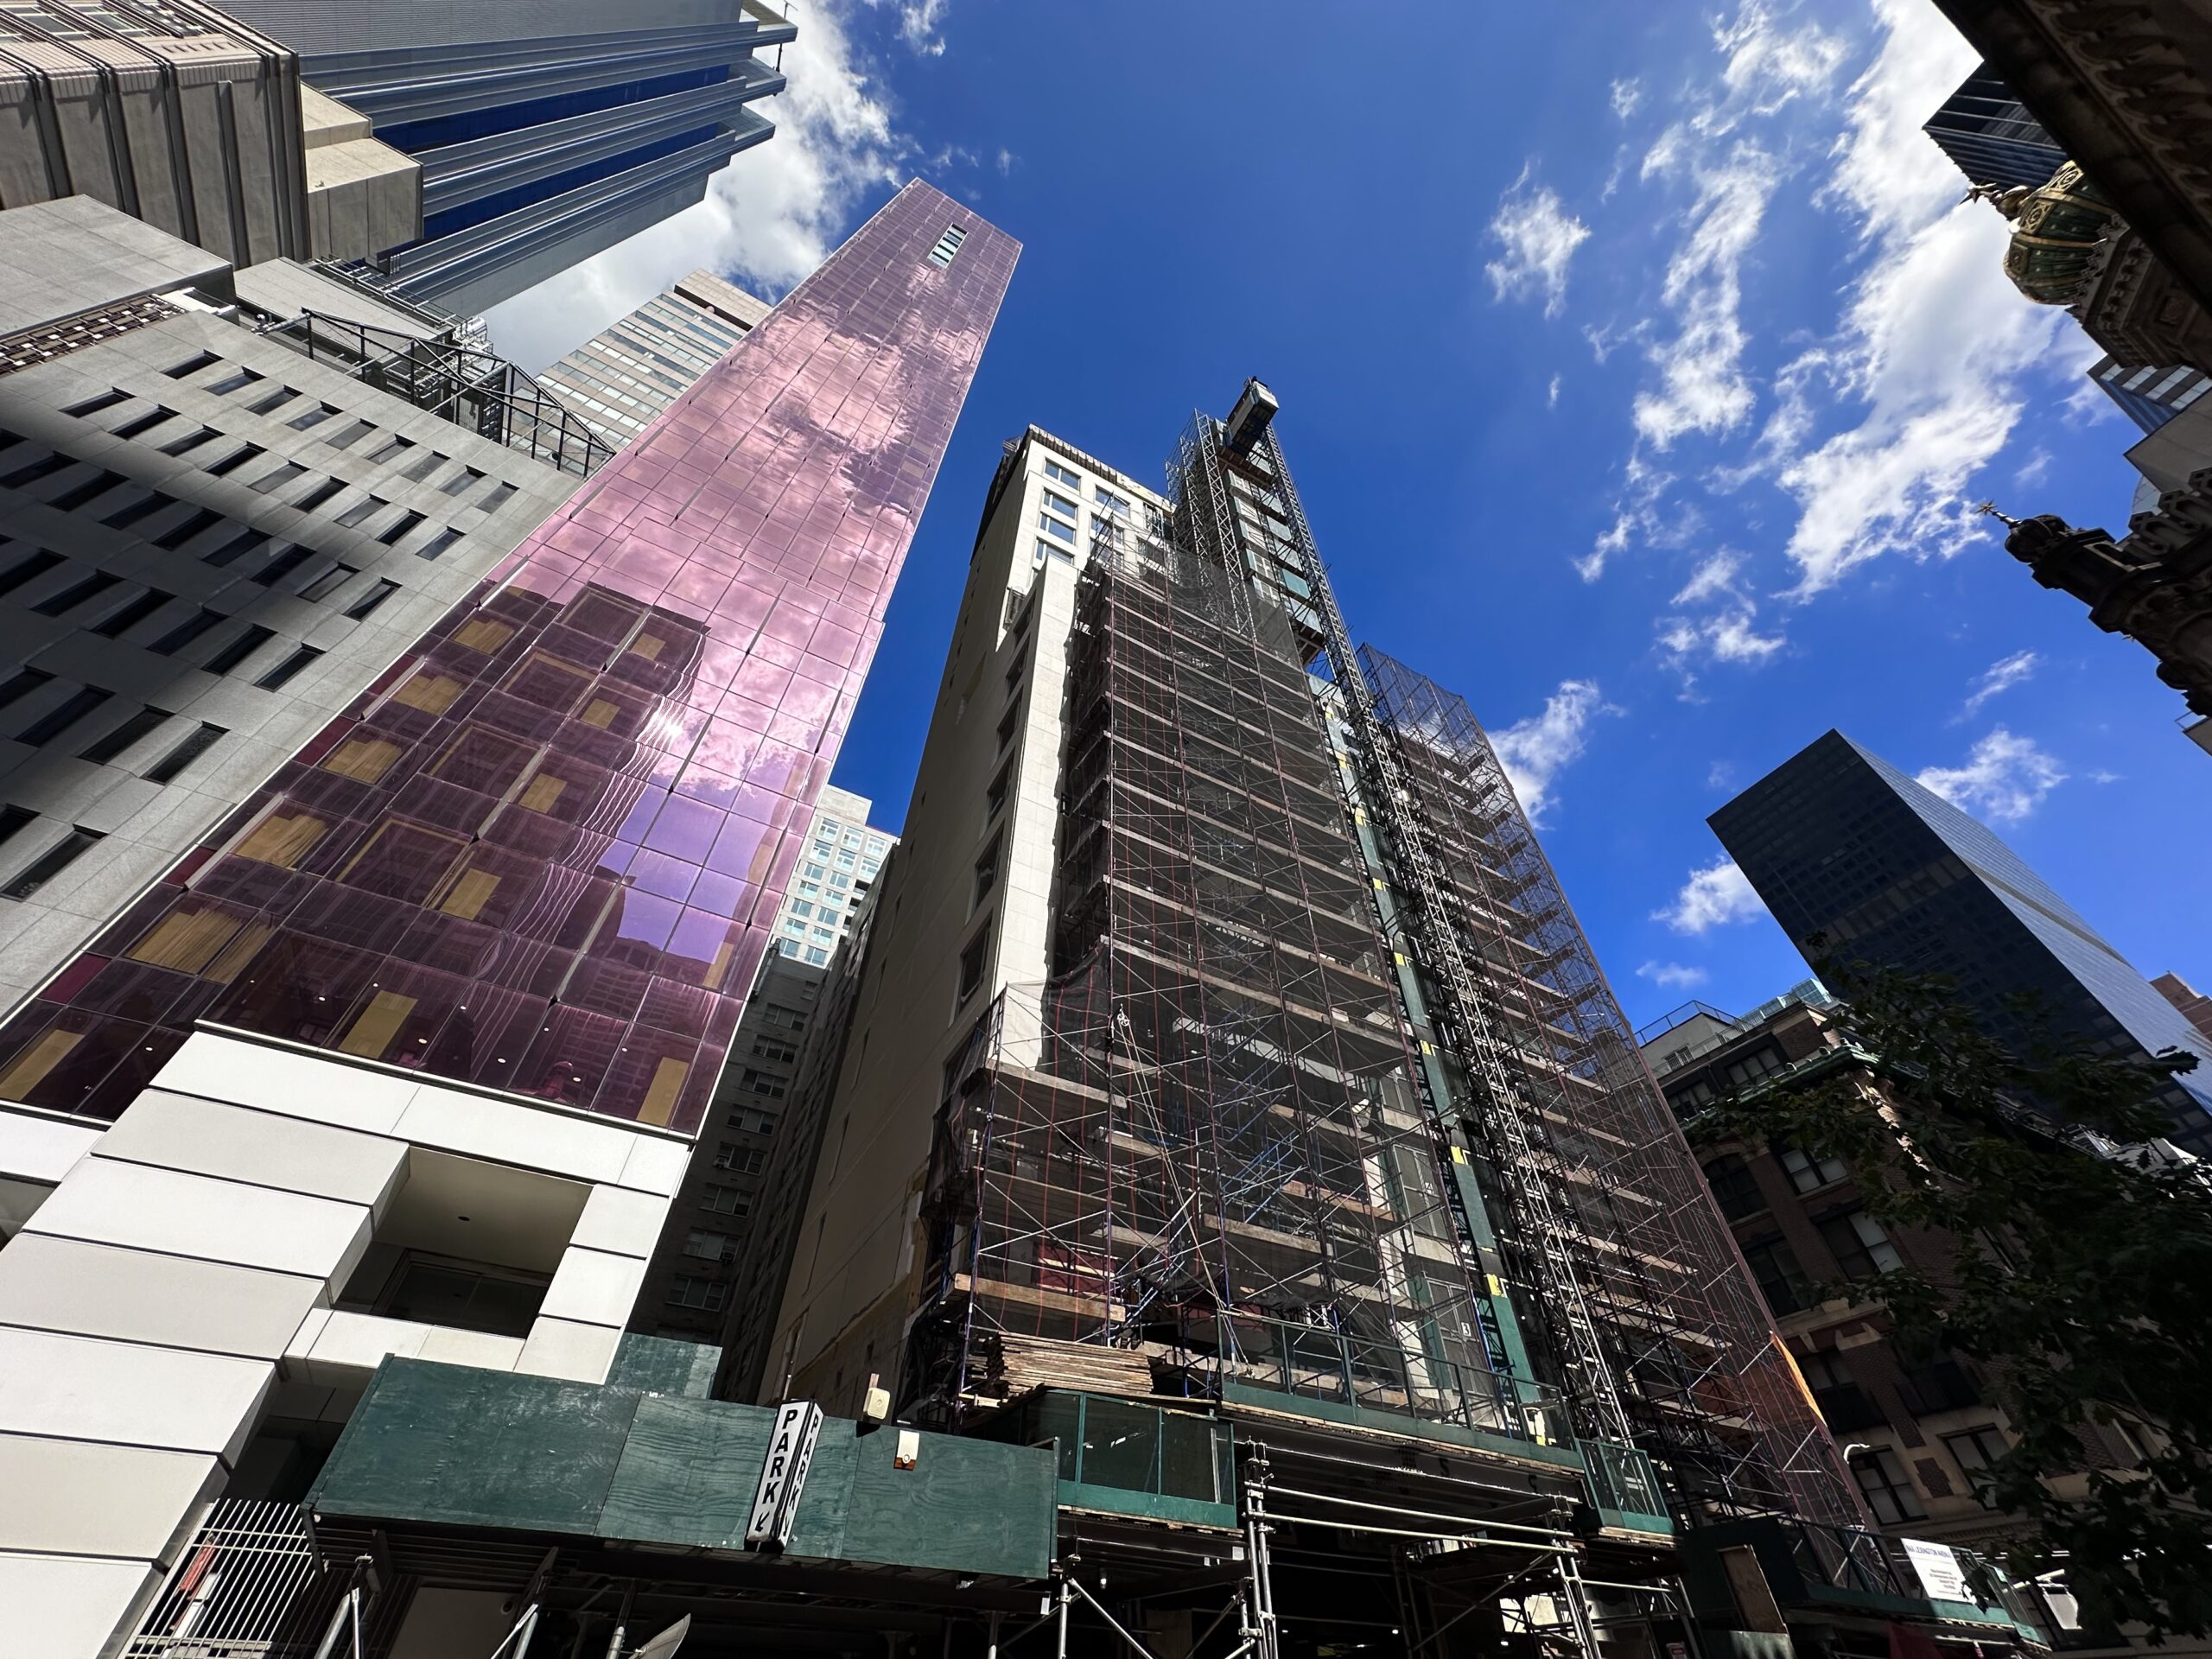
125 West 57th Street. Photo by Michael Young.
Permits listed by unit count per filing
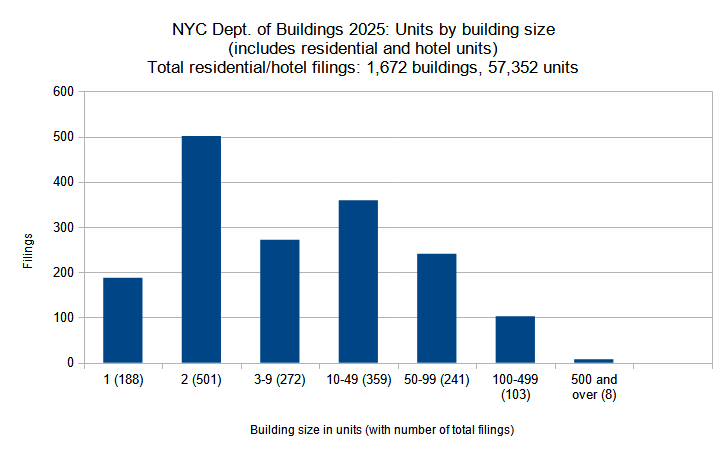
New residential and hotel construction permits filed in New York City in 2025, grouped by unit count per filling. Data source: the Department of Buildings. Data aggregation and graphics credit: Vitali D. Ogorodnikov.
Compared to the preceding year, 2025 saw a general increase in larger-sized new building permit filings and a slight decrease in several smaller-building categories. Below, the filing size categories are compared between the two quarters individually:
- Single-family – 188 permit filings (11 percent of the total)
- Two-family – 501 permits (30 percent of the total)
- Three to nine units – 272 permits (16 percent of the total)
- Ten to 49 units – 359 permits (21 percent of the total)
- 50 to 99 units – 241 permits (14 percent of the total)
- 100 to 499 units – 103 permits (6 percent of the total)
- 500 and more units – 8 permits (0.5 percent of the total)
Between 2024 and 2025, the number of new building filings in the largest category, which tallies proposed structures with 500 or more residential or hotel buildings (almost entirely composed of the residential variety), shot up from three to nine. Together with the following category, permit filings with 100 or more units add up to a total of 111, or around 7 percent of the city’s total, yet the large size of the included buildings adds up to a total of 27,557 units, or nearly half (48 percent) of the total.
The next category, which holds proposals with 50 to 99 units, counts a 241 permits. Of these, a staggering total of 62 filings, more than one-quarter of the category, feature exactly 99 residences per proposal. Without making any definitive statements, this trend may hardly be said to be coincidental, as Section 485-X of the Affordable Neighborhoods for New Yorkers tax incentive mandates higher construction worker wages for projects with 100 apartments and above. For further consideration, we may point out that there were only five filings for permits with 98 units, the next-lower figure.
Further down the list, single- and two-family filings account for a total of 689 permits, or 41 percent of the city’s total. Three- to 49-unit multi-family filings account for the remaining 600 permits, or slightly over a third of the city’s total.
The list below tallies the top ten largest new building permit filings in New York City in 2025, listed in order:
- 45 West Street in Greenpoint, Brooklyn (792 residential units)
- 23-07 43rd Avenue in Long Island City, Queens (687 units)
- 1710 Broadway in Midtown, Manhattan (686 units)
- 567 Fulton Street in Downtown Brooklyn (591 units)
- 35-10 Steinway Street in Astoria, Queens (560 units)
- 21 Freeman Street in Greenpoint, Brooklyn (526 units)
- 376 Schermerhorn Street in Downtown Brooklyn (521 units)
- 2768 Webster Avenue in Bedford Park, The Bronx (510 units)
- 1440 Amsterdam Avenue in Manhattanville, Manhattan (490 units)
- 54-09 100th Street in Corona, Queens (479 units)
A tally of the ten largest filings underscores a growing scarcity of available construction space (at least when current zoning is taken into account) in Manhattan. The city’s premier skyscraper borough features only two of the ten entries on the list, with the remainder split between Brooklyn (4 permits), Queens (3 permits), and The Bronx (1 permit).
Casoni. Photo by Michael Young.
Residential and hotel units filed per borough
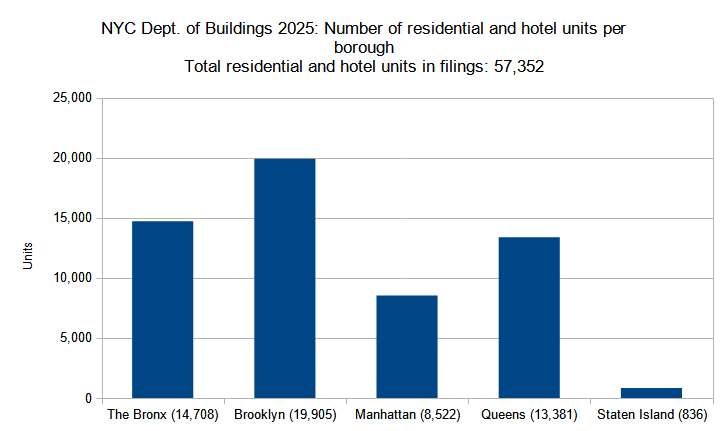
Number of residential and hotel units in new construction permits filed per borough in New York City in 2025. Data source: the Department of Buildings. Data aggregation and graphics credit: Vitali Ogorodnikov
In 2025, Brooklyn, The Bronx, and Queens led the way for proposals for much-needed housing stock, with 19,905, 14,708, and 13,381 residential units planned in each, respectively, or around three-quarters of the city’s total. Most of the remaining planned residences are slated for Manhattan (8,522 units), with sprawling Staten Island rounding off the group with just 836 units, or around 1 percent of the total.
Below is a by-borough comparison for residential and hotel unit filings:
- The Bronx – 14,708 residential and hotel units (26 percent of the total)
- Brooklyn – 19,905 units (35 percent of the total)
- Manhattan – 8,522 units (15 percent of the total)
- Queens – 13,381 units (23 percent of the total)
- Staten Island – 836 units (1 percent of the total)
The following list showcases the top largest new building permit filings in New York City in 2025 for each borough:
- The Bronx – 2768 Webster Avenue in Bedford Park (510 residential units)
- Brooklyn – 45 West Street in Greenpoint (792 units)
- Manhattan – 1710 Broadway in Midtown (686 hotel units)
- Queens – 23-07 43rd Avenue in Long Island City (687 units)
- Staten Island – 541 Bay Street in Stapleton (92 units)
Among the largest unit-count proposals in the city, there are some moderate surprises. While the housing unit champion in Queens is slated expectedly for Long Island City, its Brooklyn counterpart is planned for Greenpoint’s East River waterfront rather than for the borough’s Downtown.
The largest residential proposal in The Bronx will rise just to the west of the Botanical Garden, rather than along the perhaps-expected Harlem River waterfront. Similarly, Staten Island’s leader is slated for a neighborhood situated somewhat south of its centrally sited, ferry-adjacent hub in St. George.
One Times Square. Photo by Michael Young.
Permits listed by average unit count per filing
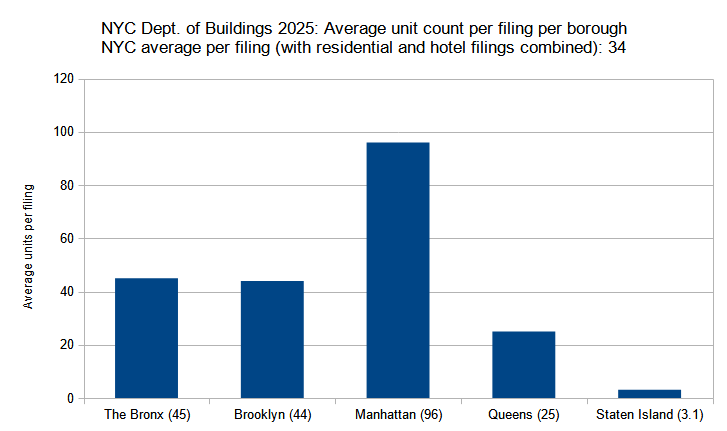
Average unit count (residential and hotel) per new construction permit per borough filed in New York City in 2025. Data source: the Department of Buildings. Data aggregation and graphics credit: Vitali D. Ogorodnikov.
Below is a by-borough tally of units per average residential or hotel filing:
- The Bronx – 45 units (32 percent above city average)
- Brooklyn – 44 units (29 percent above city average)
- Manhattan – 96 units (182 percent above city average)
- Queens – 25 units (26 percent below city average)
- Staten Island – 3.1 units (91 percent below city average)
Although The Bronx, Brooklyn, and Queens accommodated the lion’s share of the total proposed residential and hotel unit volume in 2025, Manhattan boasted the largest unit count average per filing (96). The aforementioned trio trailed well behind, with 45, 44, and 25 units per average filing. Curiously, suburban-flaired Staten Island’s seemingly meager average is actually surprisingly positive, where an average of 3.1 units per filing rose above the expected single- and two-family threshold.
262 Fifth Avenue. Photo by Michael Young.
Permit filings by floor count category
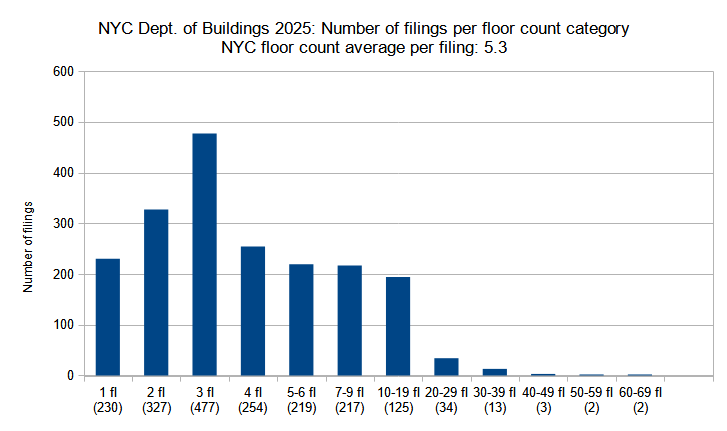
New construction permits filed in New York City in 2025, grouped by floor count. Data source: the Department of Buildings. Data aggregation and graphics credit: Vitali D. Ogorodnikov.
Below is a tally of the floor-count categories:
- Single-story – 230 permit filings (12 percent of the total)
- Two-story – 327 filings (17 percent of the total)
- Three-story – 477 filings (24 percent of the total)
- Four-story – 254 filings (13 percent of the total)
- Five to six floors – 219 filings (11 percent of the total)
- Seven to nine floors – 217 filings (11 percent of the total)
- Ten to 19 floors – 125 filings (6 percent of the total)
- 20 to 29 floors – 34 filings (2 percent of the total)
- 30 to 39 floors – 13 filings (0.6 percent of the total)
- 40 to 49 floors – 3 filings (0.2 percent of the total)
- 50 to 59 floors – 2 filings (0.1 percent of the total)
- 60 to 69 floors – 2 filings (0.1 percent of the total)
In 2025, permit filing totals showed a notable increase for buildings with 20 stories and above compared to the previous year. During this period, the number of filings for structures with 60 floors and higher rose from one to two; 50 to 59 floors from none to two; 40 to 49 floors from two to three; 30 to 39 floors from six to 13; and 20 to 29 floors from 33 to 34. The figure stayed consistent for filings with 10 to 19 floors, with a total of 125 filings recorded during each year.
Inversely, the figures for mid- and low-rise categories (buildings below ten stories in height) dropped in almost all groups during the period. While the reasons for this pattern may be varied, it does underscore a tendency of developers banking on taller, denser structures rather than their lower, smaller, sprawling counterparts. This is good news for the city, as compact, small-footprint construction has been conclusively proven as the most resource-efficient, and thus environmentally friendly, mode of housing.
Below are the top 11 permit filings (accounting for floor count ties) of 2025 with the highest floor counts, in order:
- 340 Park Avenue in Midtown, Manhattan (62 floors)
- 376 Schermerhorn Street in Downtown Brooklyn (62 floors; tie)
- 1710 Broadway in Midtown, Manhattan (55 floors)
- 567 Fulton Street in Downtown Brooklyn (52 floors)
- 95 Rockwell Place in Downtown Brooklyn (43 floors)
- 21 Freeman Street in Greenpoint, Brooklyn (40 floors)
- 441 West 26th Street in Chelsea, Manhattan (40 floors; tie)
- 23-07 43rd Avenue in Long Island City, Queens (39 floors)
- 45 West Street in Greenpoint, Brooklyn (38 floors)
- 1487 First Avenue on Upper East Side, Manhattan (37 floors)
- 207 East 84th Street in Yorkville, Manhattan (37 floors; tie)
While the year’s tally of the ten largest floor area filings notes that most of the largest proposals were located outside of Manhattan, the city’s premier skyline borough reclaimed its preeminence when it comes to the ranking in terms of the floor count.
In 2025, Mahnattan accounted for five of the top 11 spots on the list, which includes 340 Park Avenue (better known under its nominal marketing address of 350 Park Avenue; the two names are used interchangeably throughout the article), the tallest filing for the year, an office tower that will rank among the city’s tallest upon completion.
Brooklyn also counts five entries on the list. The borough essentially tied for the first place, ranking lower only on the technicality that its top contender, 376 Schermerhorn Street in Downtown Brooklyn, will rise considerably shorter than 350 Park, despite sharing the same floor count of 62.
The rest of the boroughs trail well behind. Only Queens makes a showing here, with a 39-story tower filed for at 23-07 43rd Avenue in the Court Square section of rapidly growing Long Island City.
665 Fifth Avenue. Photo by Michael Young.
Average number of floors per filing per borough
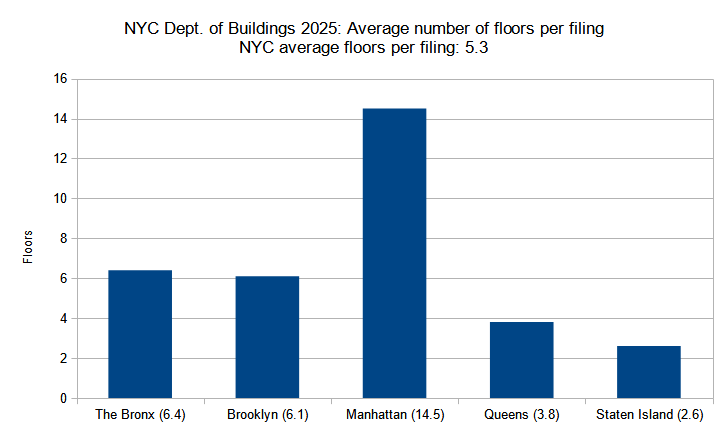
Average number of floors per new construction permit per borough filed in New York City in 2025. Data source: the Department of Buildings. Data aggregation and graphics credit: Vitali D. Ogorodnikov.
An increase in taller (at least in terms of floor count) permit filings for new buildings was observed in 2025 as compared to the preceding year, and a decrease in lower floor-count filings. As such, the average floor count per permit filing has risen commeasurably, where the figure of 5.3 stories per average permit filing had set a new record for any annual tally since YIMBY began keeping track at the start of the decade. Compared to 2024, every single figure has shown an increase, even in almost exclusively low-rise Staten Island.
Below is the by-borough comparison of the average number of floors per permit filing in 2025:
- The Bronx – 6.4 average floors per permit filing (21 percent above the city average of 5.3)
- Brooklyn – 6.1 average floors (15 percent above city average)
- Manhattan – 14.5 average floors (173 percent above city average)
- Queens – 3.8 average floors (28 percent below city average)
- Staten Island – 2.6 average floors (51 percent below city average)
Similar to last year, Manhattan was the only borough where the permit filing floor-count average ranked within the high-rise category. In 2025, the borough outperformed its showing compared to 2024, having seen its average increase from 12.7 to 14.5 per filing. Next are Brooklyn and The Bronx, sitting squarely within the mid-rise category, with averages of 6.4 and 6.1 stories per filing, respectively. Next comes Queens with an average of 3.8 floors, followed by Staten Island, with an average of 2.6 stories per filing.
The following are the permit filings in each borough with the highest floor counts:
- The Bronx – 310 East 161st Street in Concourse Village (26 floors)
- Brooklyn – 376 Schermerhorn Street in Downtown Brooklyn (62 floors)
- Manhattan – 340 Park Avenue in Midtown (62 floors)
- Queens – 23-07 43rd Avenue in Long Island City (39 floors)
- Staten Island – 541 Bay Street in Stapleton (7 floors)
In 2025, Manhattan and Brooklyn tied for the highest floor count per permit in the city, at 62 stories, though Manhattan’s office tower planned at 340 Park Avenue (aka 350 Park) in Midtown will rise considerably higher than Brooklyn’s residential counterpart at 376 Schermerhorn Street in Downtown Brooklyn. A 39-story skyscraper is proposed at 23-07 43rd Avenue in Long Island City, and a 26-story building is planned at 310 East 161st Street in Concourse Village, near the borough’s civic center.
Lastly, while Staten island’s tallest entry, a seven-story structure at 541 Bay Street in Stapleton, is quite tall for the predominantly low-rise borough, it ranks in the lower end of the city’s top 500 proposals for the year, sharing its rank with 76 other projects with the same planned floor count.
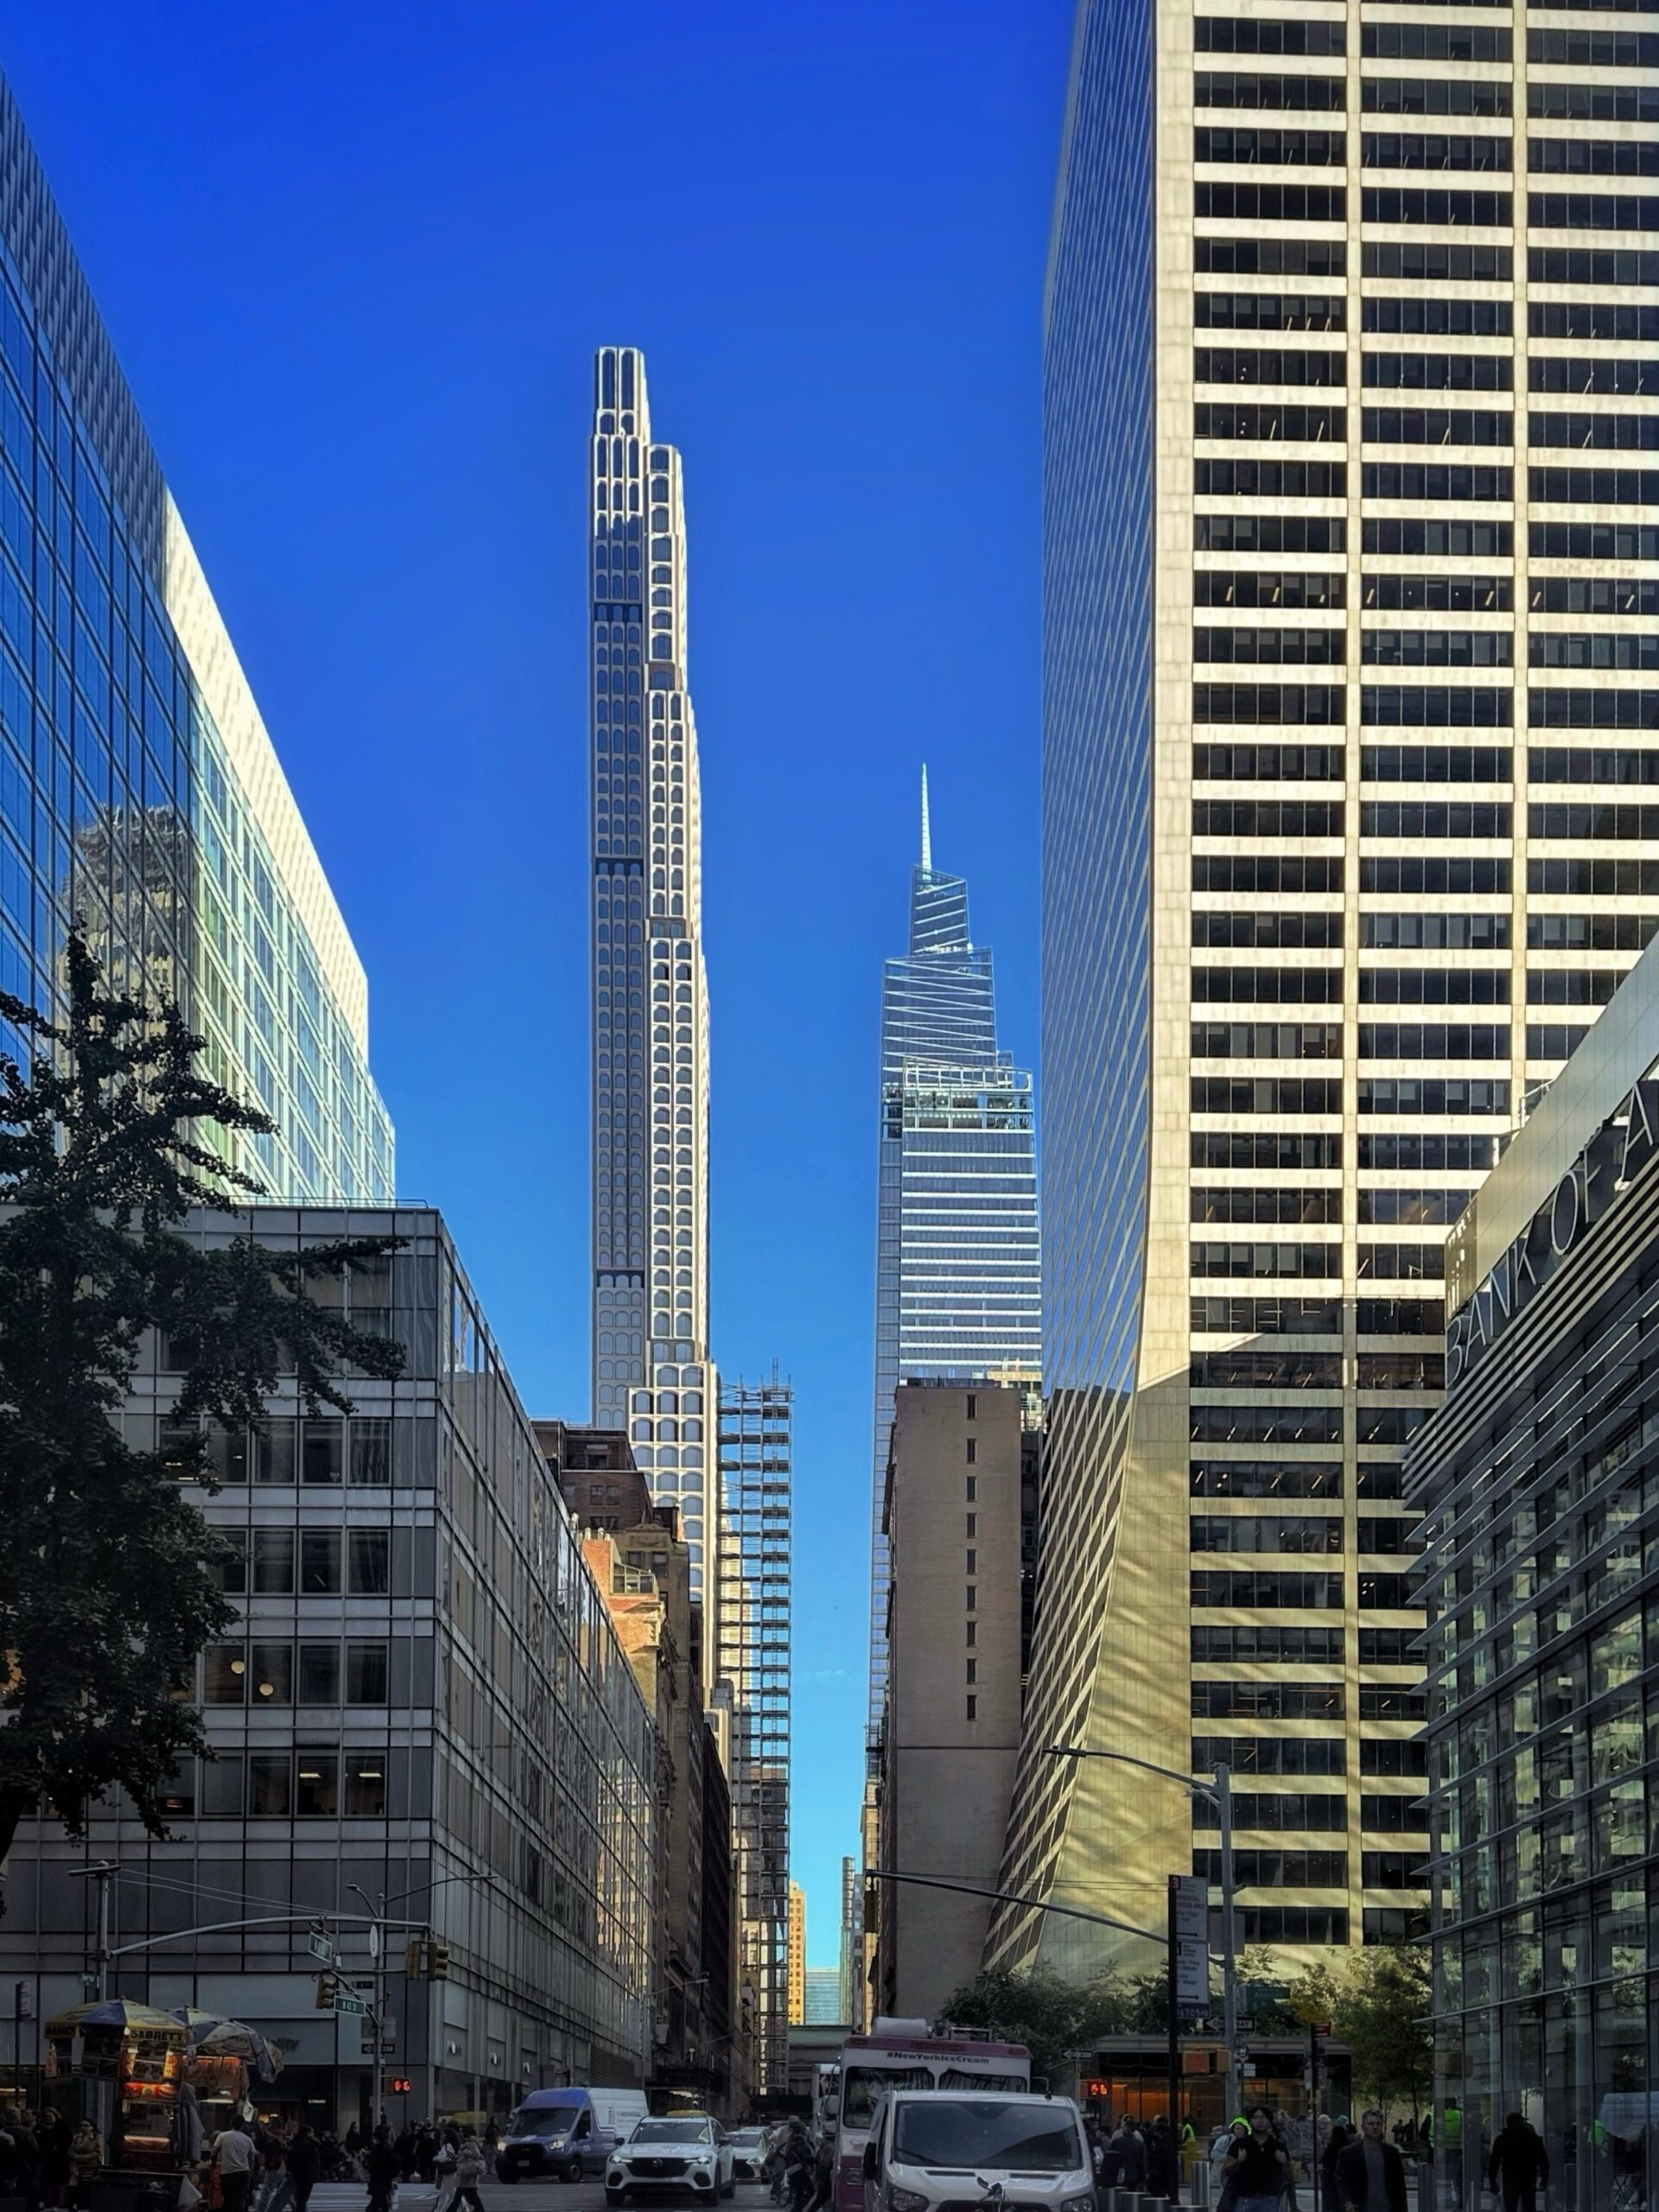
270 Park Avenue. Photo by Michael Young.
Permits listed by floor area per filing
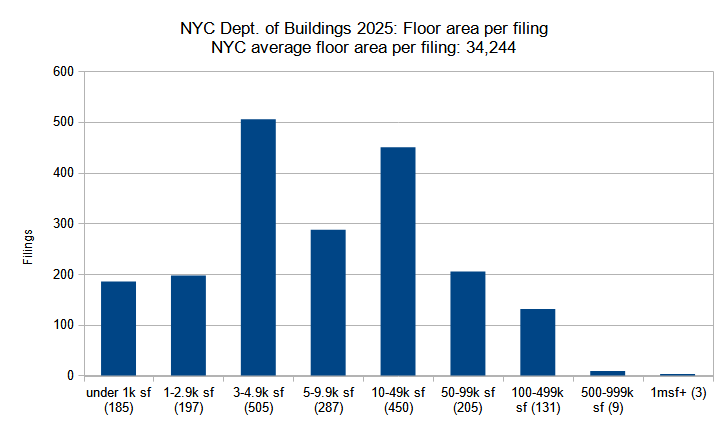
New construction permits filed in New York City in 2025, grouped by total floor area. Data source: the Department of Buildings. Data aggregation and graphics credit: Vitali D. Ogorodnikov.
In 2025, the Department of Buildings registered a total of 67,528,661 square feet of newly filed floor space in submitted permits. An earlier analysis highlighted an increase in 2025 new building permit filings for structures with a large number of residential and hotel units (100-plus units), compared to 2024. Since the majority of buildings constructed in the city are residential, both in number and in terms of floor area, it is unsurprising to see a concurrent increase in large-floor-area filings, although, in this category, the growth is not as drastic.
Below is the number of permit filings per floor area category in 2025:
- Under 1,000 square feet – 185 permit filings (9 percent of the total)
- 1,000 to 2,999 sf – 197 filings (10 percent of the total)
- 3,000 to 4,999 sf – 505 (26 percent of the total)
- 5,000 to 9,999 sf – 287 (15 percent of the total)
- 10,000 to 49,999 sf – 450 (23 percent of the total)
- 50,000 to 99,999 sf – 205 (10 percent of the total)
- 100,000 to 499,999 sf – 131 (7 percent of the total)
- 500,000 to 999,999 sf – 9 (0.5 percent of the total)
- 1,000,000 sf and more – 3 (0.2 percent of the total)
Last year saw a tripling of million-square-foot filings as compared to the preceding year, with the count rising from one in 2024 to three in 2025. The number of half-million- to 1-million-square-foot permits has remained largely consistent, dropping from ten in ’24 to nine in ’25. On the other hand, a number of smaller-floor-area categories registered certain decreases, particularly those in the most compact categories, which generally represent garages and single- and two-family houses.
Below are the top ten permits with the largest floor area filed in 2025, listed in order:
- 340 Park Avenue in Midtown, Manhattan (2,077,720 square feet)
- 357 Southern Boulevard in Mott Haven, The Bronx (1,073,490 sf)
- 125 White Street in the Civic Center, Manhattan (1,039,650 sf)
- 45 West Street in Greenpoint, Brooklyn (807,803 sf)
- 25-49 3rd Street in Astoria, Queens (743,570 sf)
- 431 East 66th Street in Lenox Hill, Manhattan (730,492 sf)
- 376 Schermerhorn Street in Downtown Brooklyn (639,873 sf)
- 567 Fulton Street in Downtown Brooklyn (597,824 sf)
- 2768 Webster Avenue in Bedford Park, The Bronx (544,517 sf)
- 21 Freeman Street in Greenpoint, Brooklyn (509,447 sf)
Of the top-ten largest proposals by floor area filed for in 2025, four are slated to rise in Brooklyn, three in Manhattan, two in The Bronx, and one in Queens. The office skyscraper behemoth proposed at 350 Park Avenue, the next up-and-coming supertall slated to spruce up the city skyline, is not only the tallest proposal of the year both by floor count (62, matching 376 Schermerhorn Street in Brooklyn) and by total height (exact figures vary, with numbers cited anywhere up to 1,600 feet), but also by floor area.
Here, once again, the square footage varies depending on source and proposal iteration, but the Department of Buildings filing displays a staggering 2-million-square-foot-plus figure; by itself, the proposal accounts for 3 percent of all filed-for square footage in the city, considerably more than the 1.6 million square feet filed for in all of Staten Island for the year (more on individual borough breakdown in the next section).
But while 350 Park will make the most significant impact on the city skyline of any of the top-ten floor-area filings for 2025, the list’s arguably most intriguing filings belong neither in the residential nor commercial categories. At number two and three on the list are the proposals at 357 Southern Boulevard (aka 745 East 141st Street, with 1.1 million square feet) in The Bronx and 125 White Street (1 million square feet) in Manhattan. These projects are The Bronx Detention Center and the Manhattan Detention Center, the so-called “tower jails,” two of the five such planned borough-based facilities.
The new detention centers will replace the problem-plagued jail complex at Rikers Island and will move inmates from dilapidated facilities to up-to-date structures sited on compact parcels much closer to the sites of court hearings and related procedures, sparing city-operated jail buses an arduous crosstown trek to and from the remote island sited in the middle of the upper East River. Having learned from past urban planning mistakes, the new jails will feature numerous community-friendly gestures such as outstanding architectural design, ground-level communal and retail features, and ample publicly accessible green areas and landscaping.
One Times Square. Photo by Michael Young.
Total floor area filed by borough
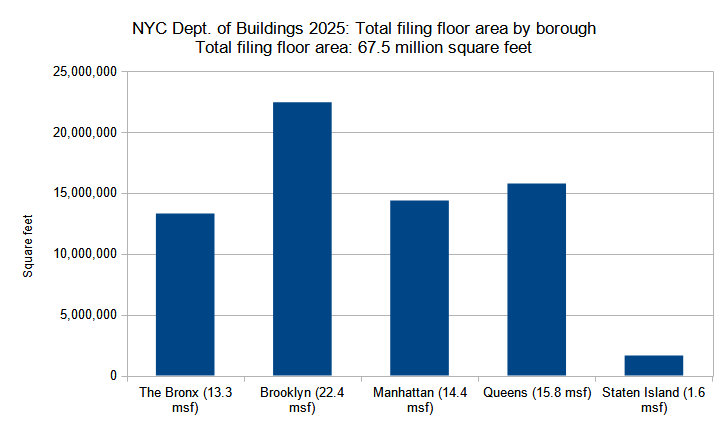
Combined floor area of new construction permits filed per borough in New York City in 2025. Data source: the Department of Buildings. Data aggregation and graphics credit: Vitali D. Ogorodnikov.
Below are the new building permit filing square footage totals per borough in 2025:
- The Bronx – 13,307,354 square feet (20 percent of the total)
- Brooklyn – 22,437,057 sf (33 percent)
- Manhattan – 14,369,142 sf (21 percent)
- Queens – 15,772,754 sf (23 percent)
- Staten Island – 1,642,354 sf (2 percent)
In concurrence with the fact that four of the ten largest (by floor area) permits filed for in 2025 were found in Brooklyn, the borough also boasted the largest total permit floor area of any of its counterparts, with its 22.4 million square feet accounting for approximately one-third of the 67.5 square feet filed for in the city over the course of the year.
The breakdown for Queens (15.8 million square feet), Manhattan (14.4 MSF), and The Bronx (13.3 MSF) is about even, with each making up about one-fifth of the city total. At the bottom, the predominantly single- and two-family filings of Staten Island add up to just 1.6 million square feet, or 2 percent of the city total.
The following are the permit filings in each borough with the largest floor area:
- The Bronx – 357 Southern Boulevard in Mott Haven (1,073,490 square feet)
- Brooklyn – 45 West Street in Greenpoint (807,803 sf)
- Manhattan – 340 Park Avenue in Midtown (2,077,720 sf)
- Queens – 25-49 3rd Street in Astoria (743,570 sf)
- Staten Island – 45 Cleveland Place in Concord/Arrochar (184,800 sf)
126 East 57th Street. Photo by Michael Young.
Average floor area per permit filing by borough
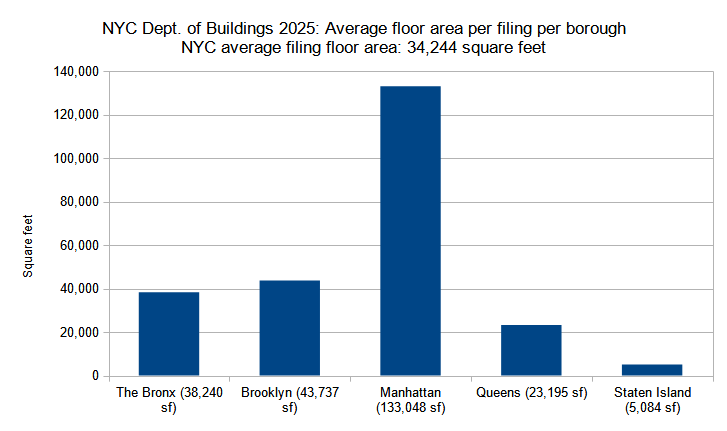
Average floor area per new construction permit per borough filed in New York City in 2025. Data source: the Department of Buildings. Data aggregation and graphics credit: Vitali Ogorodnikov
Logic dictates that the floor area of a proposal is directly correlated with its story count; in other words, the more floors a planned building counts, the larger its floor area is generally likely to be. As such, it is hardly surprising that the graph for the average new building permit filing size per borough for 2025 looks very much like its counterpart for average borough floor counts. Below is the quarterly comparison for the boroughs:
- The Bronx – 38,240 square feet per average filing (12 percent above city average)
- Brooklyn – 43,737 sf per average filing (28 percent above city average)
- Manhattan – 133,048 sf per average filing (289 percent above city average)
- Queens – 23,195 sf per average filing (32 percent below city average)
- Staten Island – 5,084 sf per average filing (85 percent below city average)
The borough most closely matched with the city average of 34,244 square feet per new building permit filing for 2025 is The Bronx, which, at 38,240 square feet (around the size of a medium-sized, mid-rise apartment building), ranks 12 percent above city average.
The average for Brooklyn is slightly higher, at 43,737 square feet, somewhat lower in Queens (23,195 square feet), dramatically outsized for Manhattan (133,048 square feet), and well below average for Staten Island, with the latter registering an average of 5,084 square feet per new building filing, which is roughly equivalent to a large single-family house or a small multi-unit apartment building.
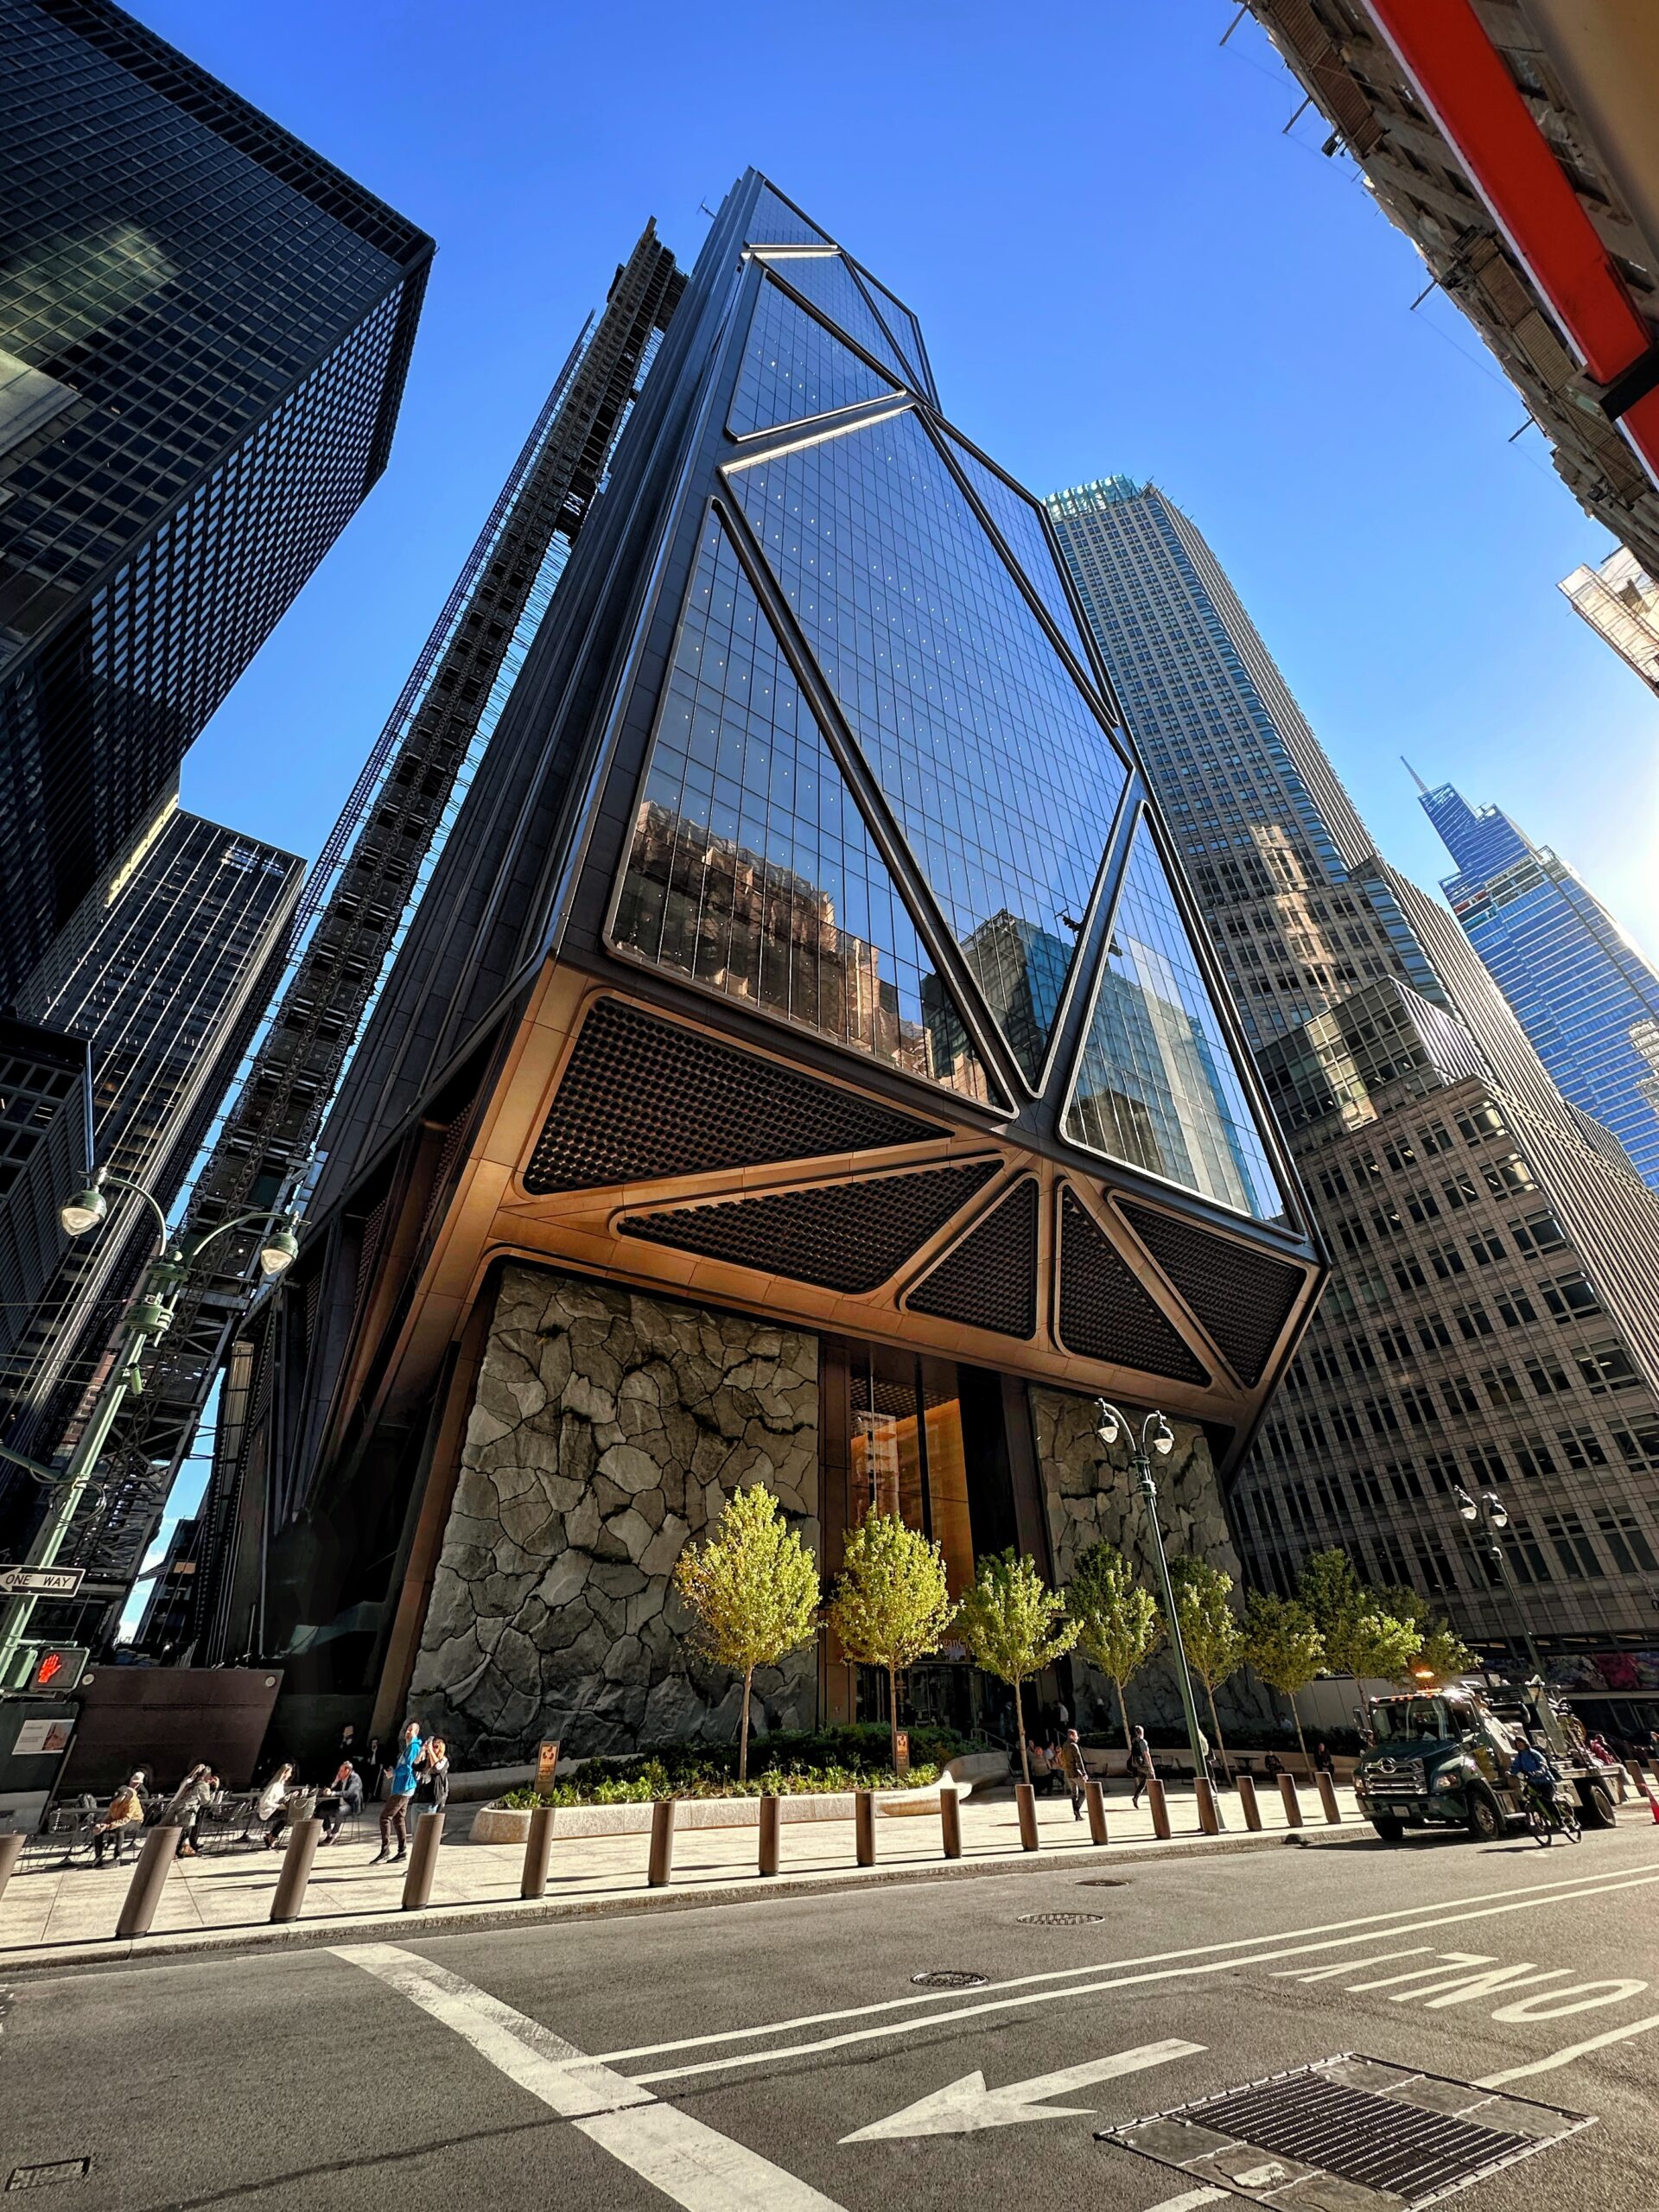
1 Times Square. Photo by Michael Young.
While the staggering volume of new proposals submitted to the New York City Department of Buildings in 2025 paints a bright picture of the city’s future, monumental planning and policy shifts promise even more exciting development ahead.
The City of Yes for Housing Opportunity zoning amendment, adopted by the City Council in December 2024, slashes through much of the bureaucratic red tape that has long suffocated the city’s development potential. The amendment allows for denser construction in transit-adjacent areas, eases air rights transfers that will preserve more of the city’s venerated historic buildings, and facilitates conversion of the city’s numerous aging office buildings into much-needed housing, among many other incentives.
In part enabled by the financial windfall generated by the traffic-unclogging, air-clearing congesting pricing initiative for the city’s central business district, the Metropolitan Transit Agency is in the midst of a massive improvements program that includes installation of new subway station elevators, signaling upgrades, and other commute-enhancing features.
New subway and light rail lines will add more new train trackage than the city had seen in decades, particularly in long-underserved, transit-starved city districts. The long-planned Second Avenue line extension will connect several existing subway services in Harlem via a new crosstown corridor. The state Governor-championed Interborough Express will create a radial route connecting some of the most densely populated neighborhoods in central Brooklyn and Queens.
The ground-up, grassroots-sourced QueensLink proposal promises to introduce subway access to transit deserts in Queens, while dramatically reducing travel times to the sandy beaches and remote residential communities of Far Rockaway. The Penn Station Access project will add four new Metro-North stations in The Bronx and will allow a major new commute option to central Midtown for riders residing all the way in central Connecticut. Tunneling work is also starting on the Gateway Tunnel, a major portion of a critical megaproject that will double the number of rail tracks on the busiest segment on the Northeast Corridor, allow for much-needed repairs on the existing 115-year-old tunnels, and significantly boost the regional economy and mass transit reliability for Manhattan-bound New Jersey commuters.
Even the long-dormant proposed development over the Sunnyside Yard, the world’s largest passenger train yard upon its completion slightly over a century ago, is being revived by the city’s recently elected Mayor and is currently being discussed at the highest level of the government, generating national headlines. Upon its completion, the proposal will create a whole new neighborhood with tens of thousands of new residential units and acres of new park space just minutes away from Midtown, Manhattan.
Just to the west, the recently approved OneLIC upzoning plan will add more than ten thousand new residences in Midtown-adjacent Long Island City, with similar zoning upgrades underway in neighborhoods such as Jamaica.
Keep looking forward, New Yorkers, keep looking up, and keep saying Yes In My Back Yard!
126 East 57th Street. Photo by Michael Young.
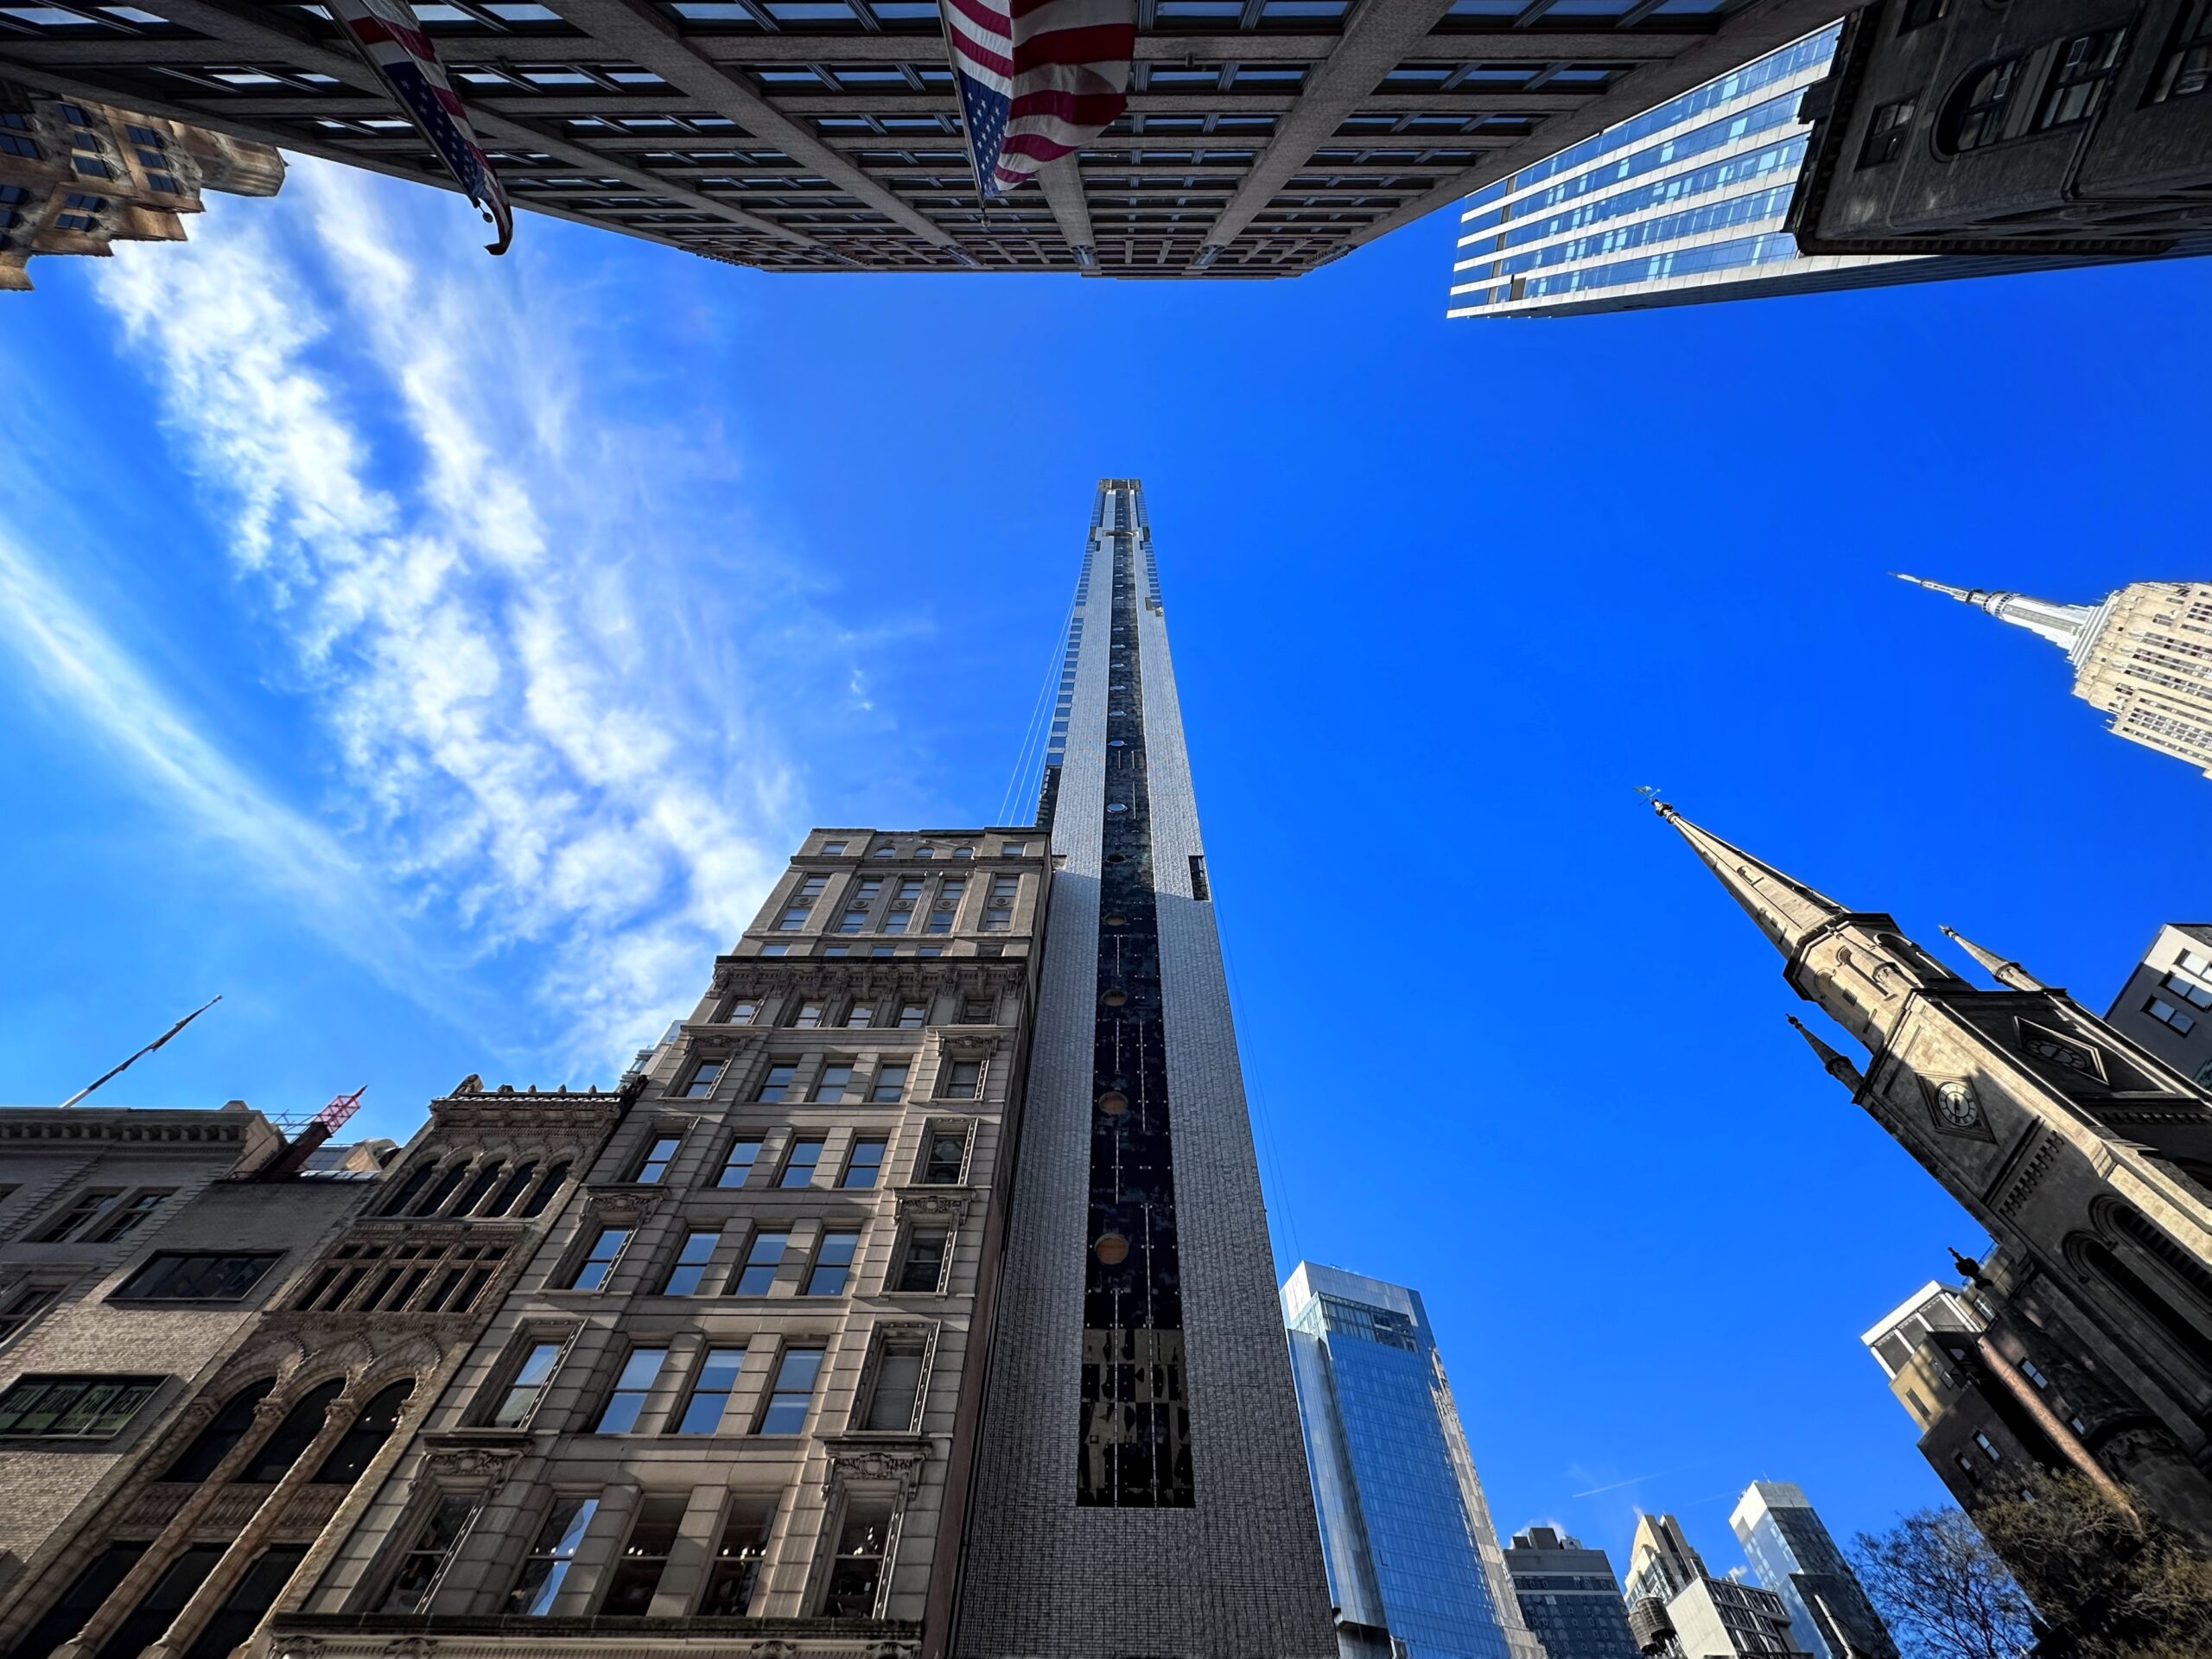
125 West 57th Street. Photo by Michael Young.
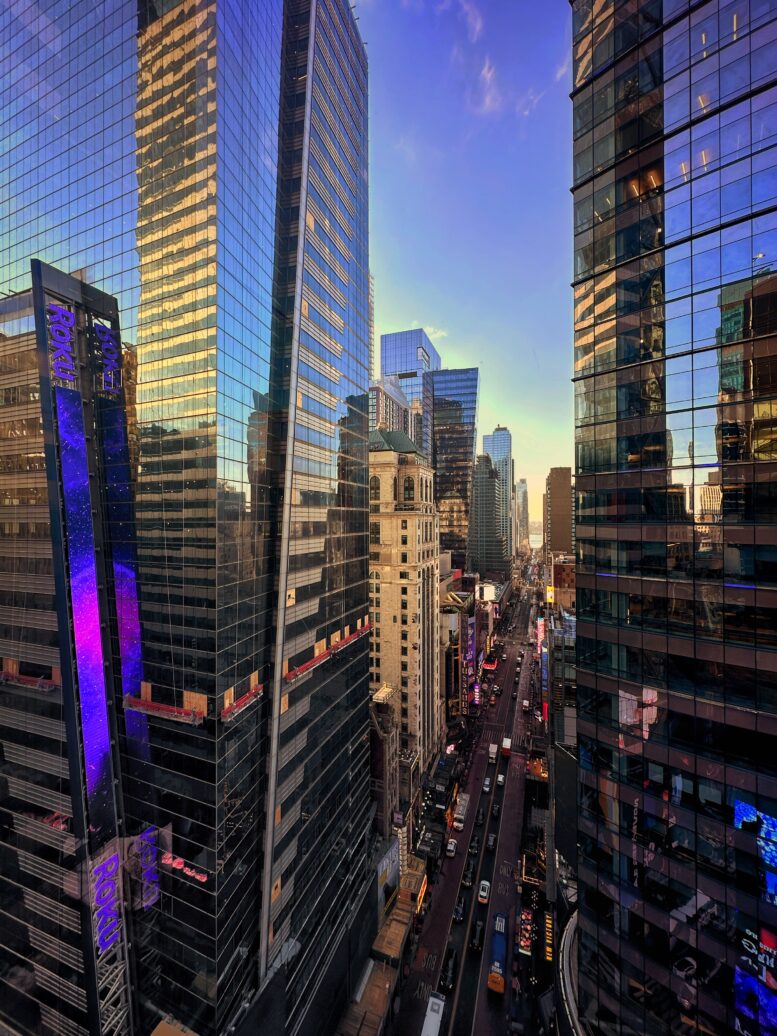
5 Times Square. Photo by Michael Young.
5 Times Square. Photo by Michael Young.
125 West 57th Street. Photo by Michael Young.

Photo by Michael Young.

Photo by Michael Young.
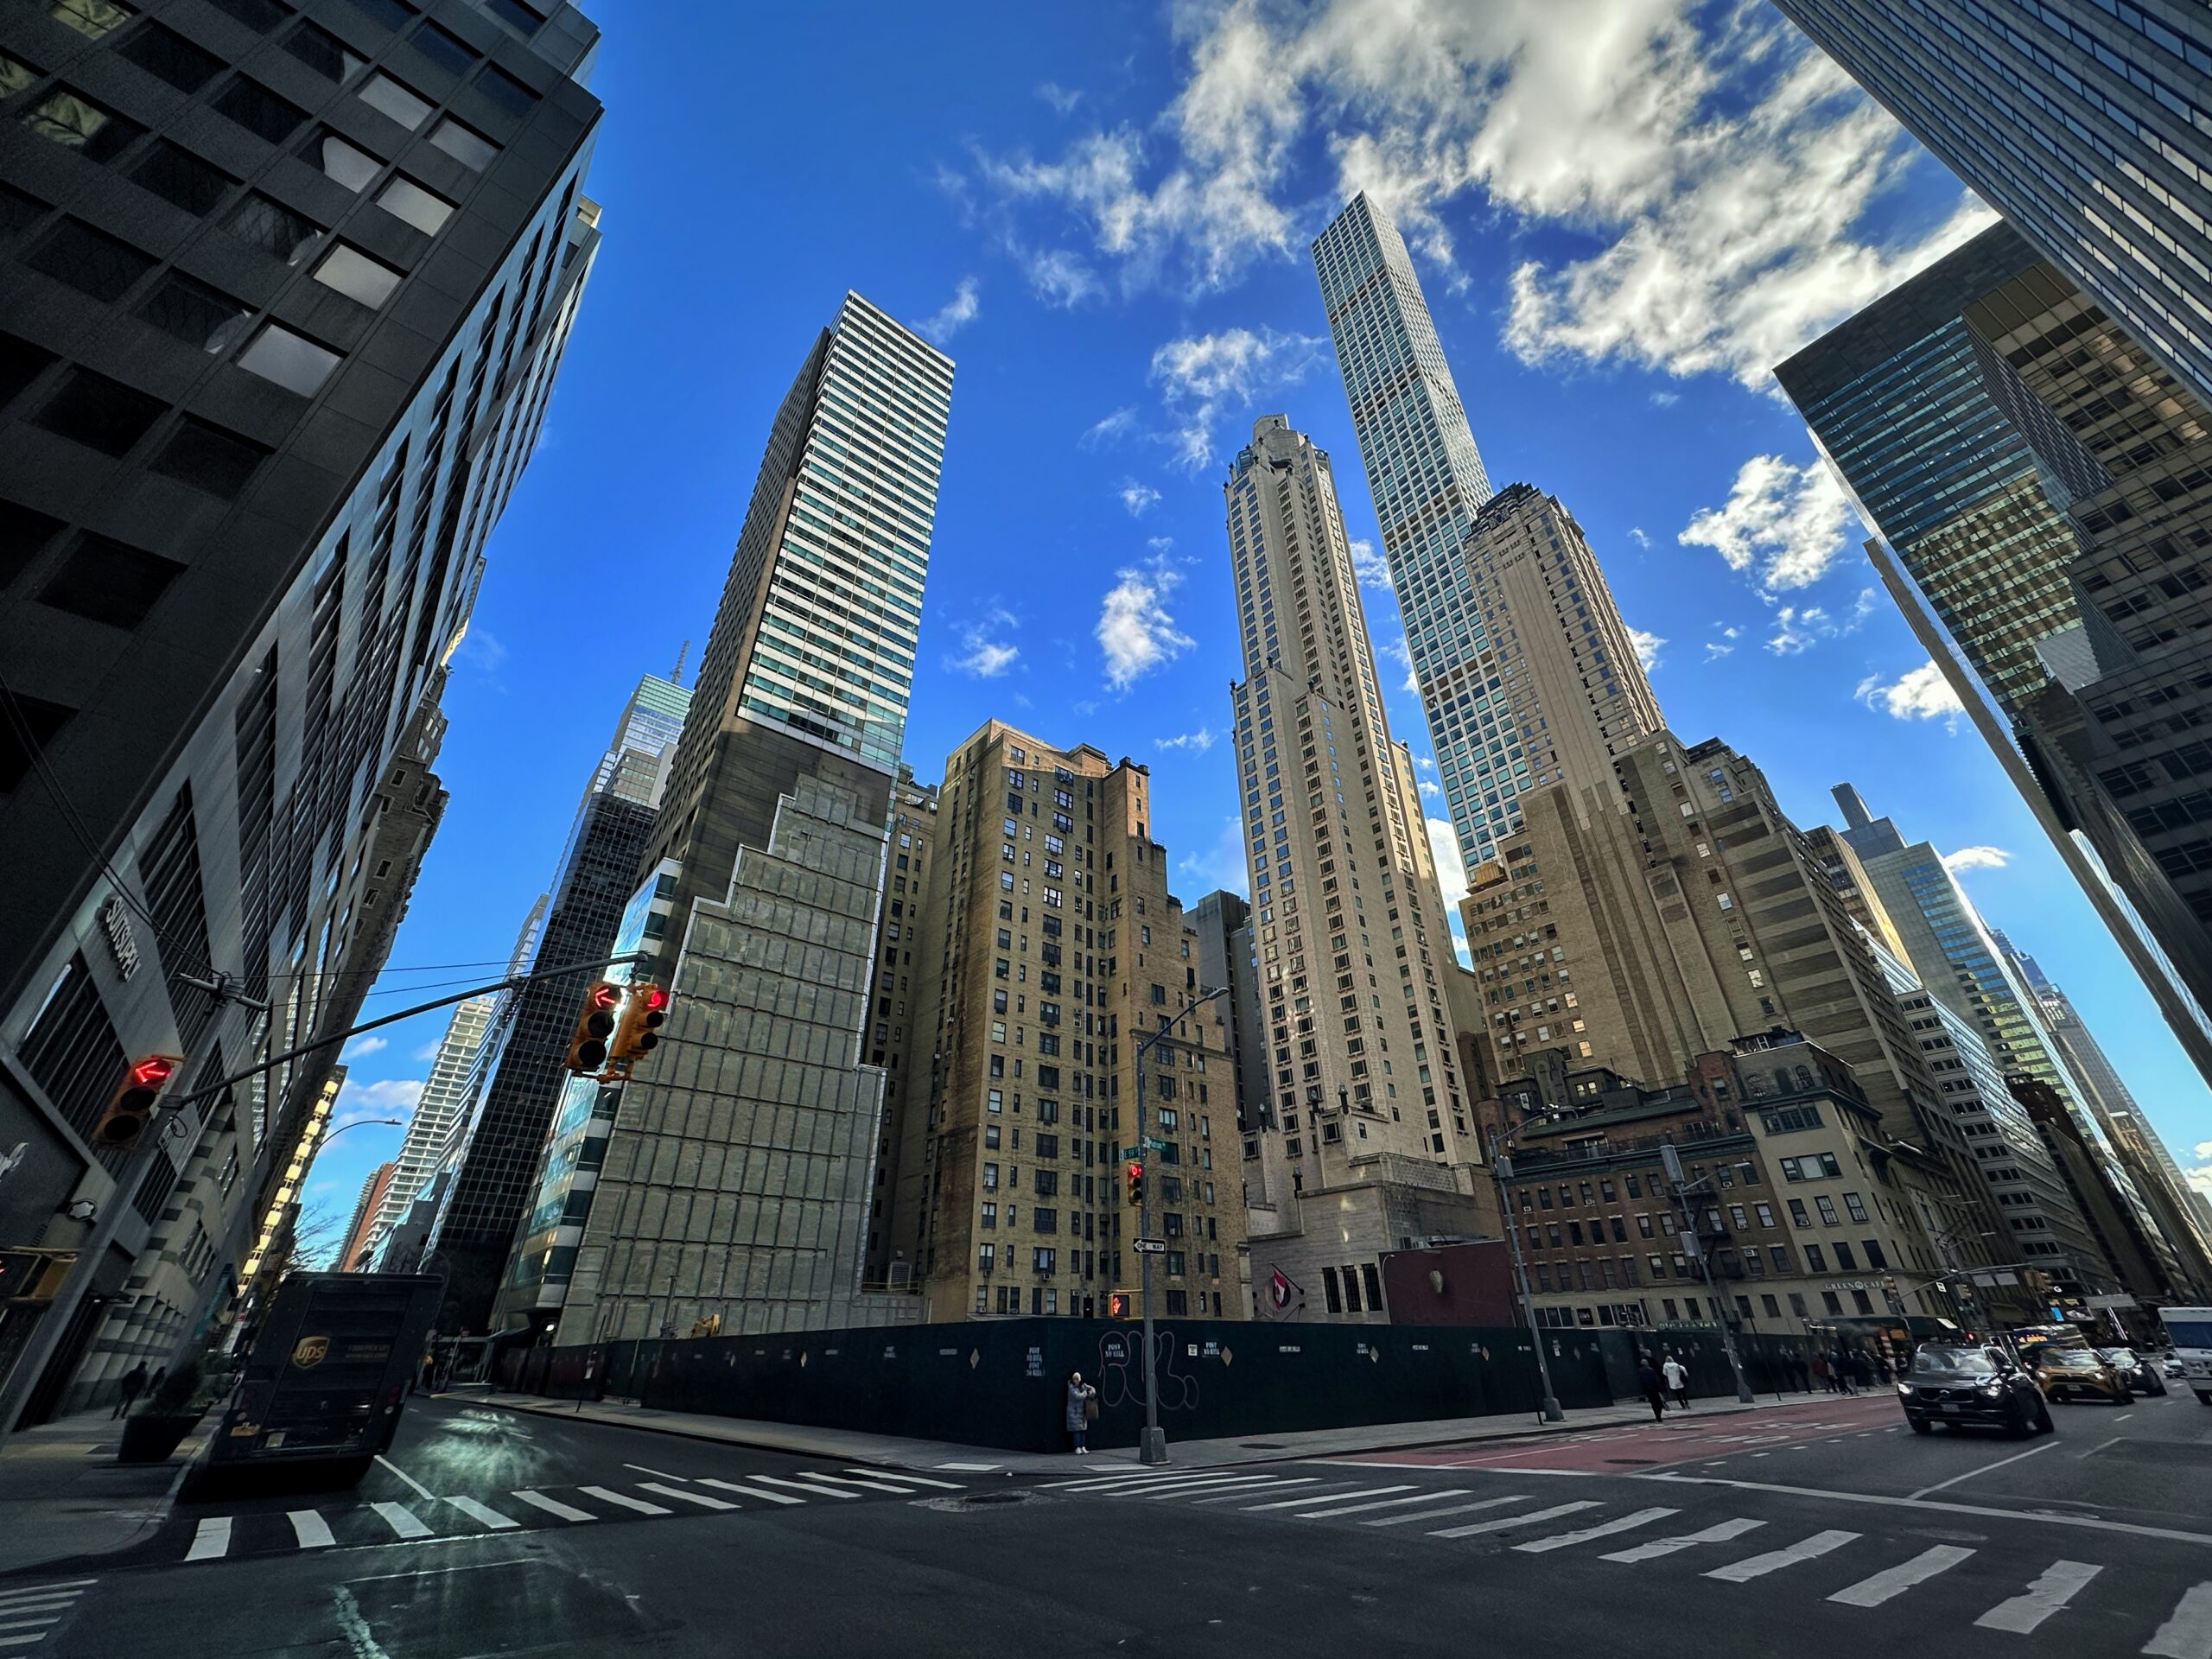
One Times Square. Photo by Michael Young.
One Times Square. Photo by Michael Young.
One Times Square. Photo by Michael Young.
262 Fifth Avenue. Photo by Michael Young.
262 Fifth Avenue. Photo by Michael Young.
262 Fifth Avenue. Photo by Michael Young.
Casoni. Photo by Michael Young.
Casoni. Photo by Michael Young.
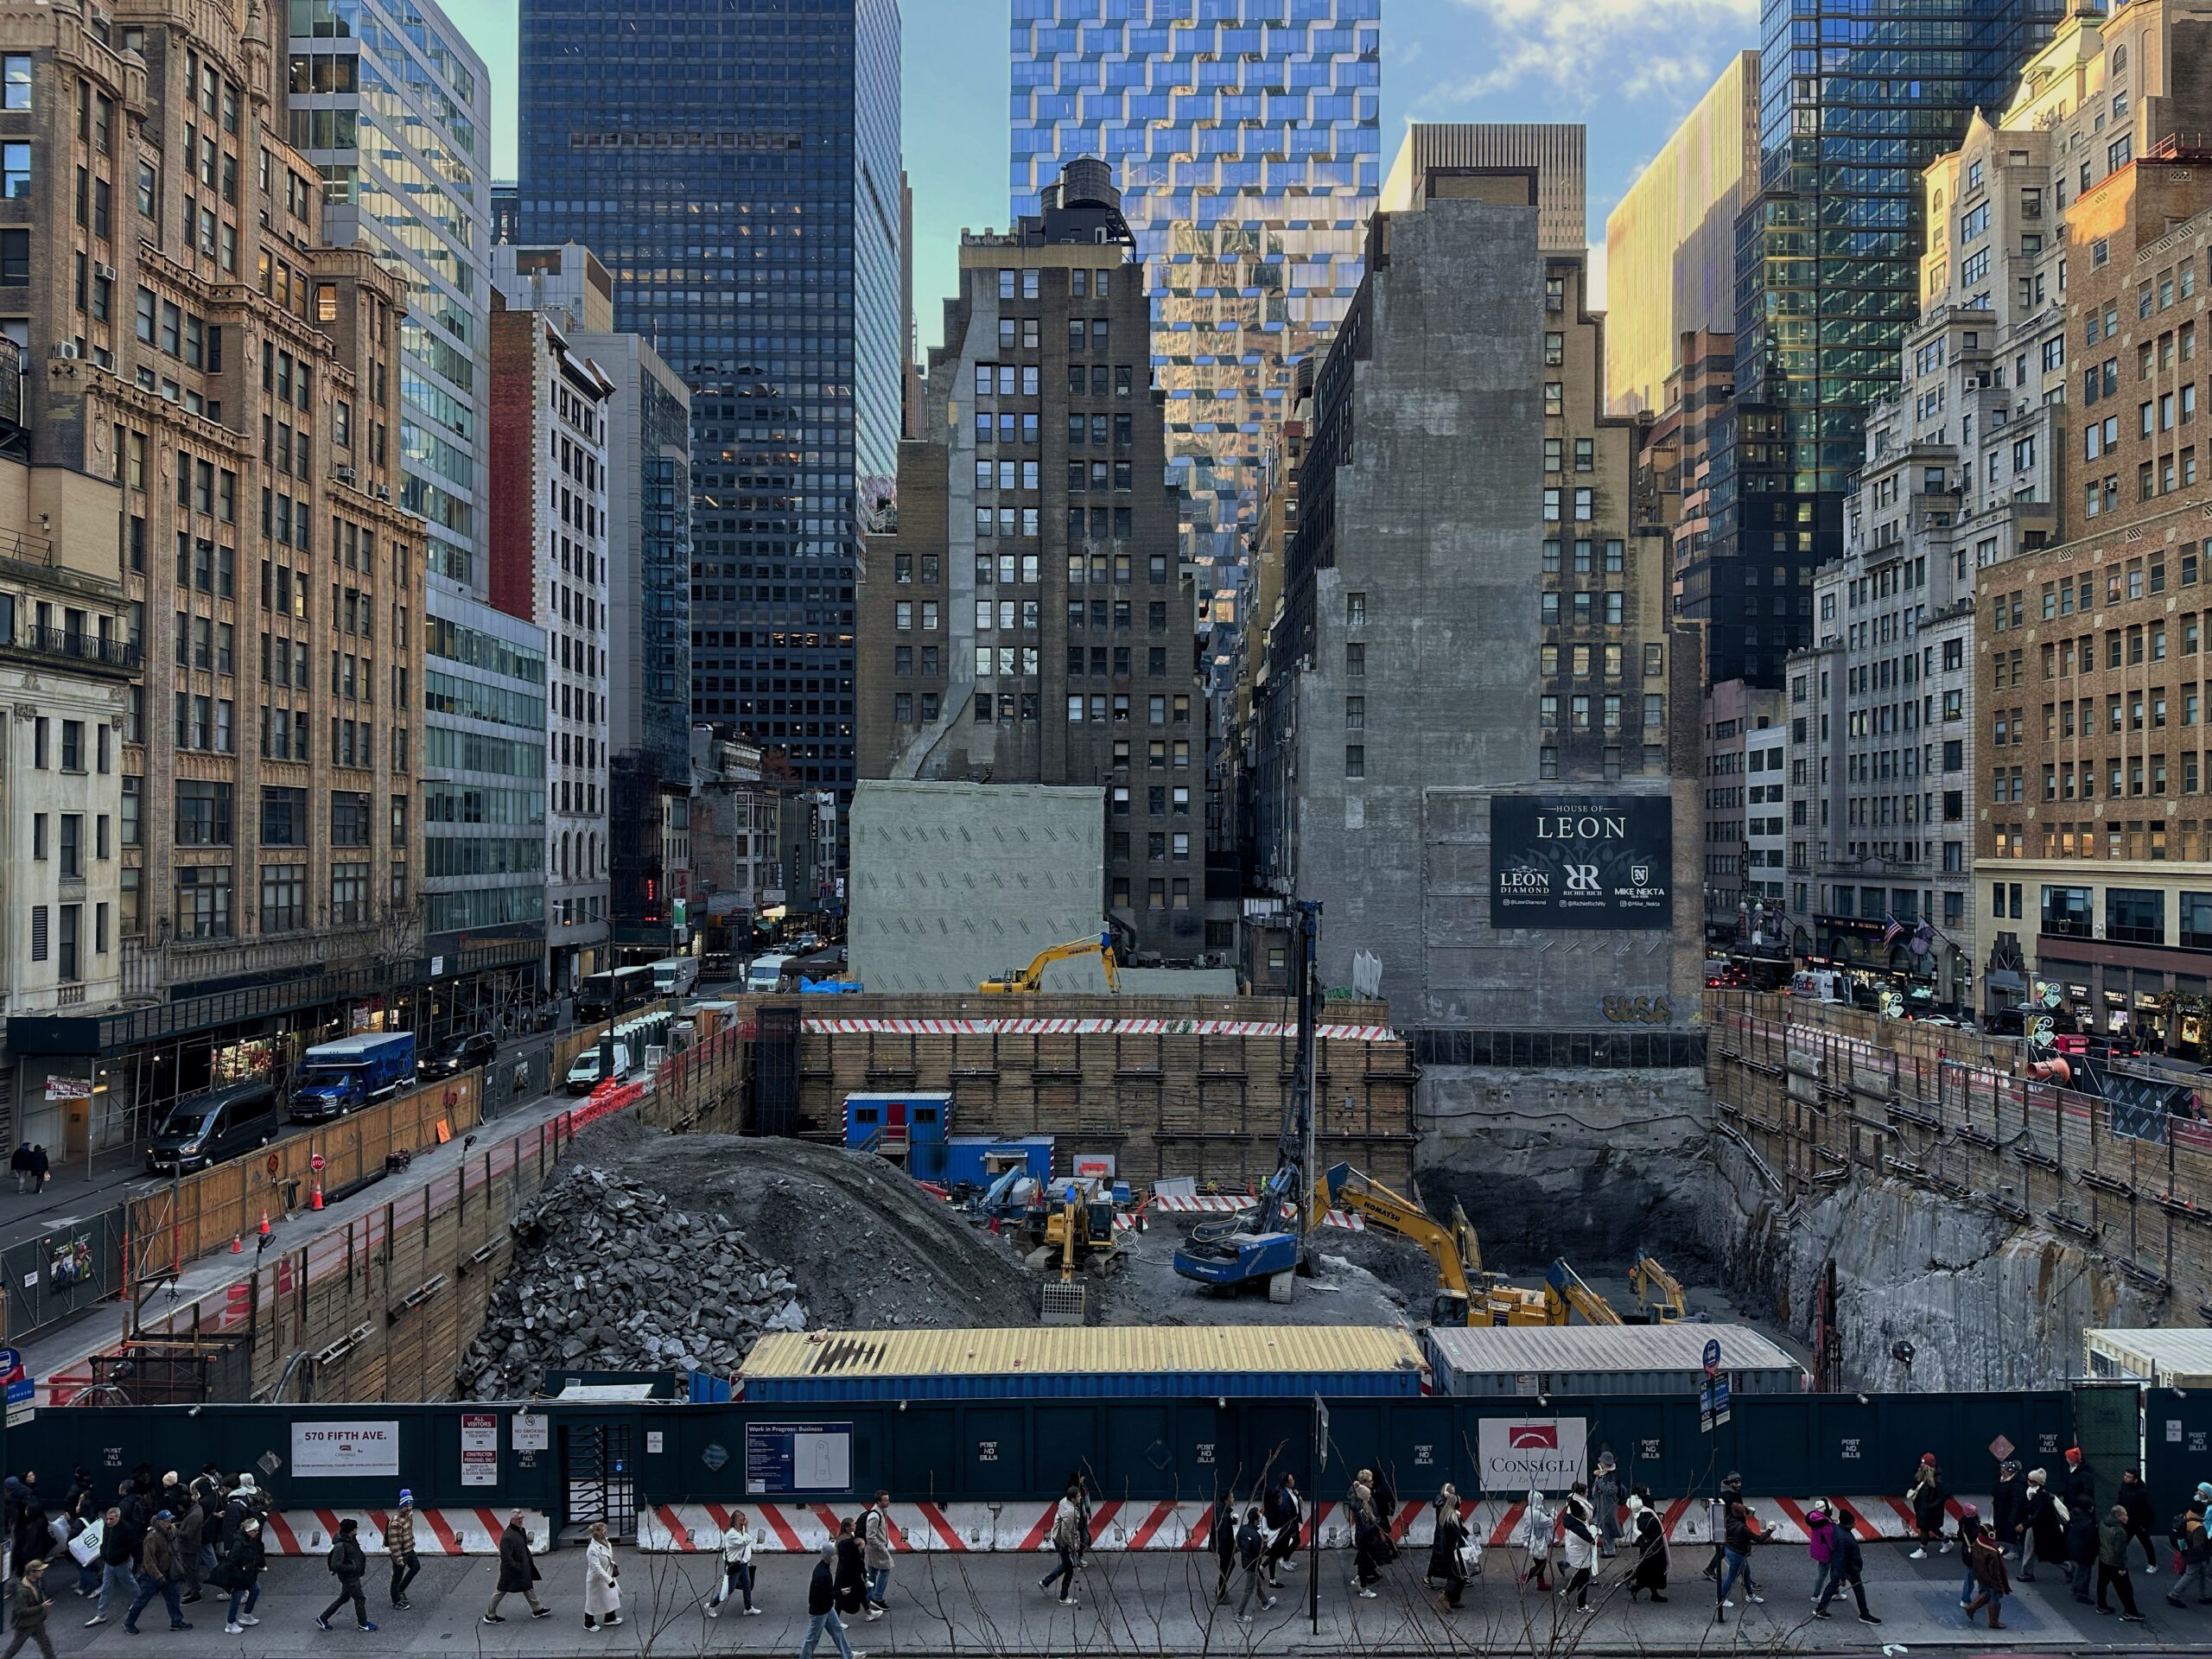
570 Fifth Avenue. Photo by Michael Young.
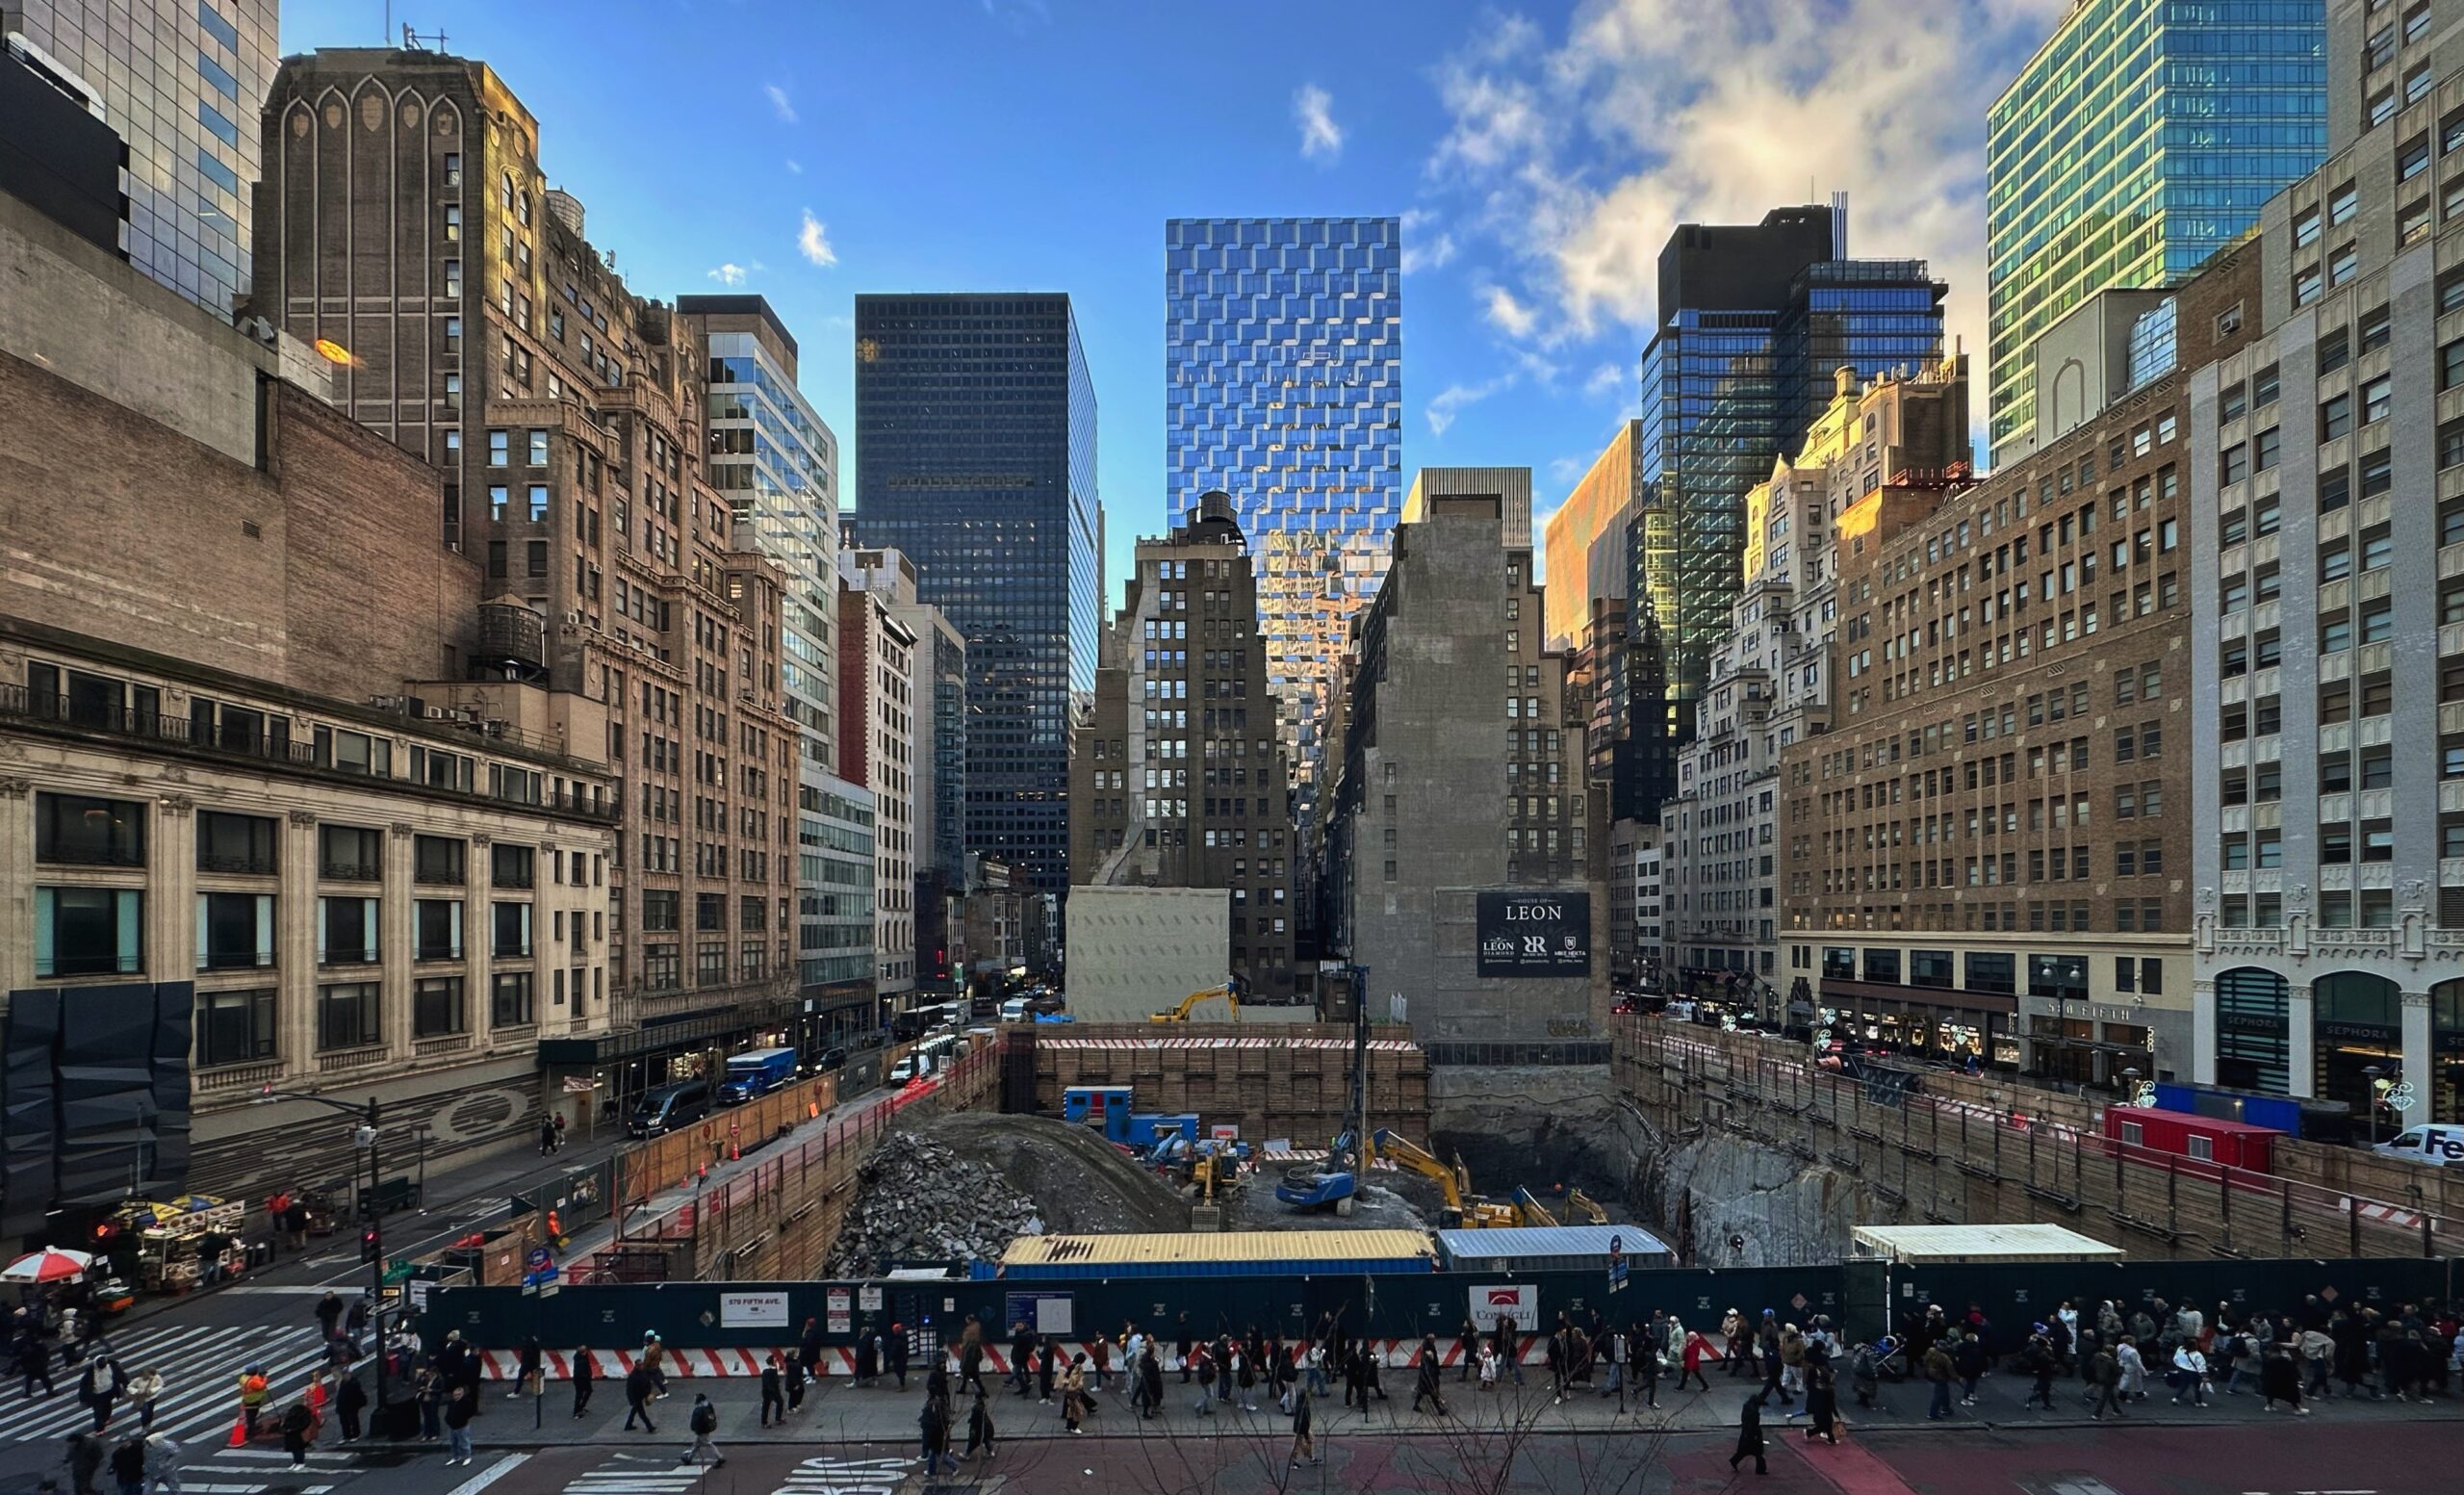
570 Fifth Avenue. Photo by Michael Young.
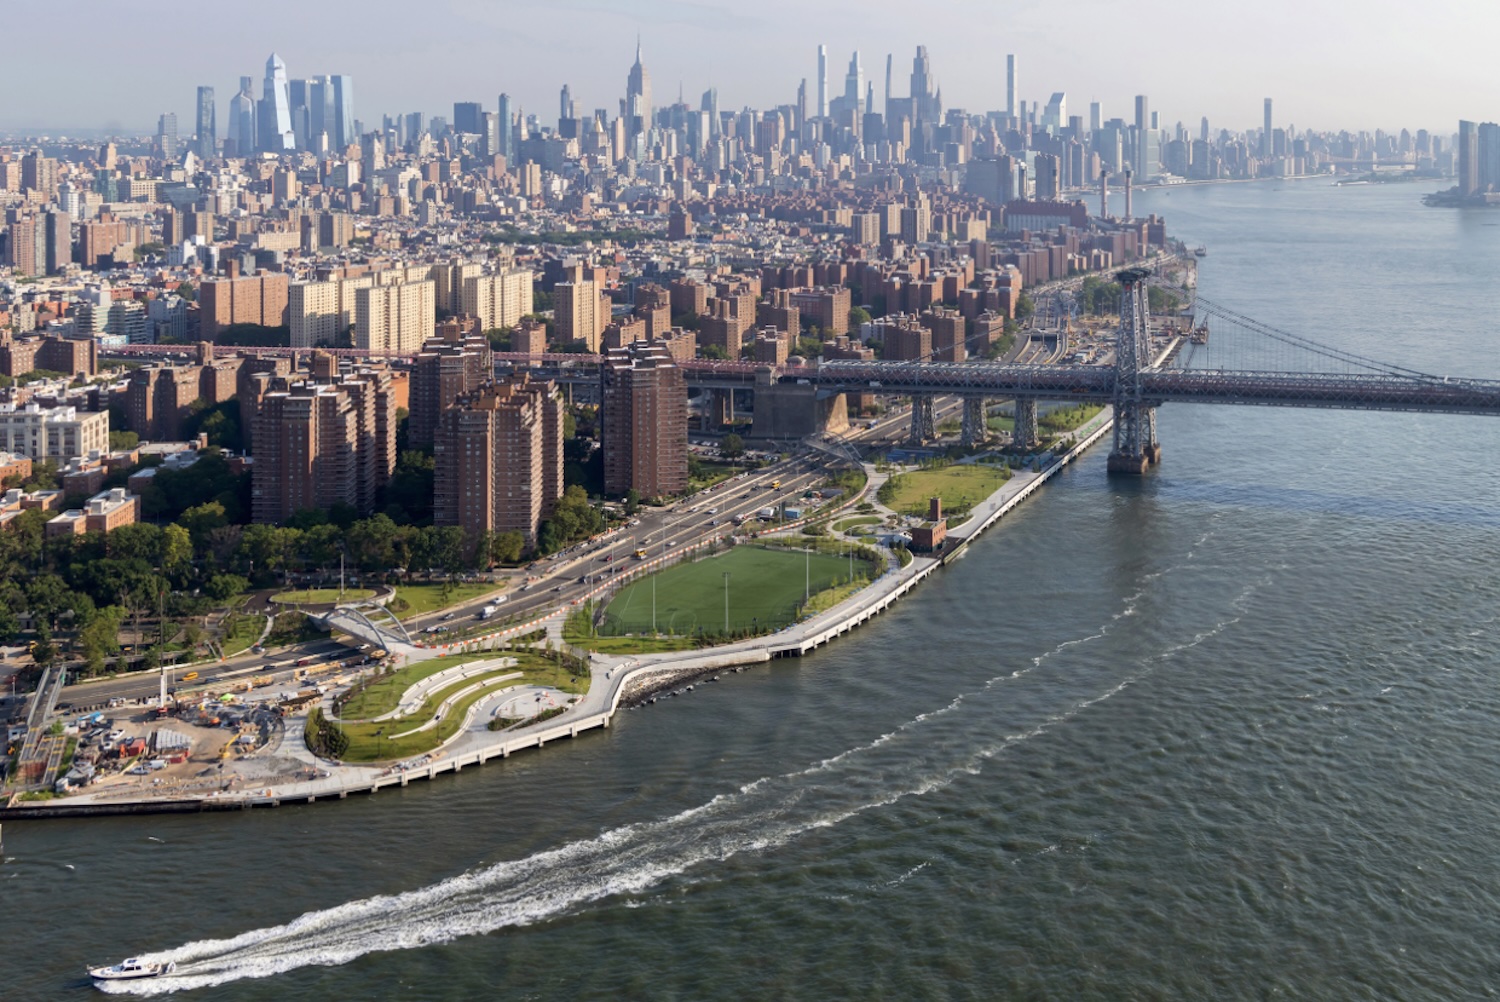
Photograph of East River Park. Credit: Iwan Baan.
570 Fifth Avenue. Photo by Michael Young.
335 Bond Street. Photo by Michael Young.
200 East 75th Street. Photo by Michael Young.
520 Fifth Avenue. Photo by Michael Young.
520 Fifth Avenue. Photo by Michael Young.
520 Fifth Avenue. Photo by Michael Young.
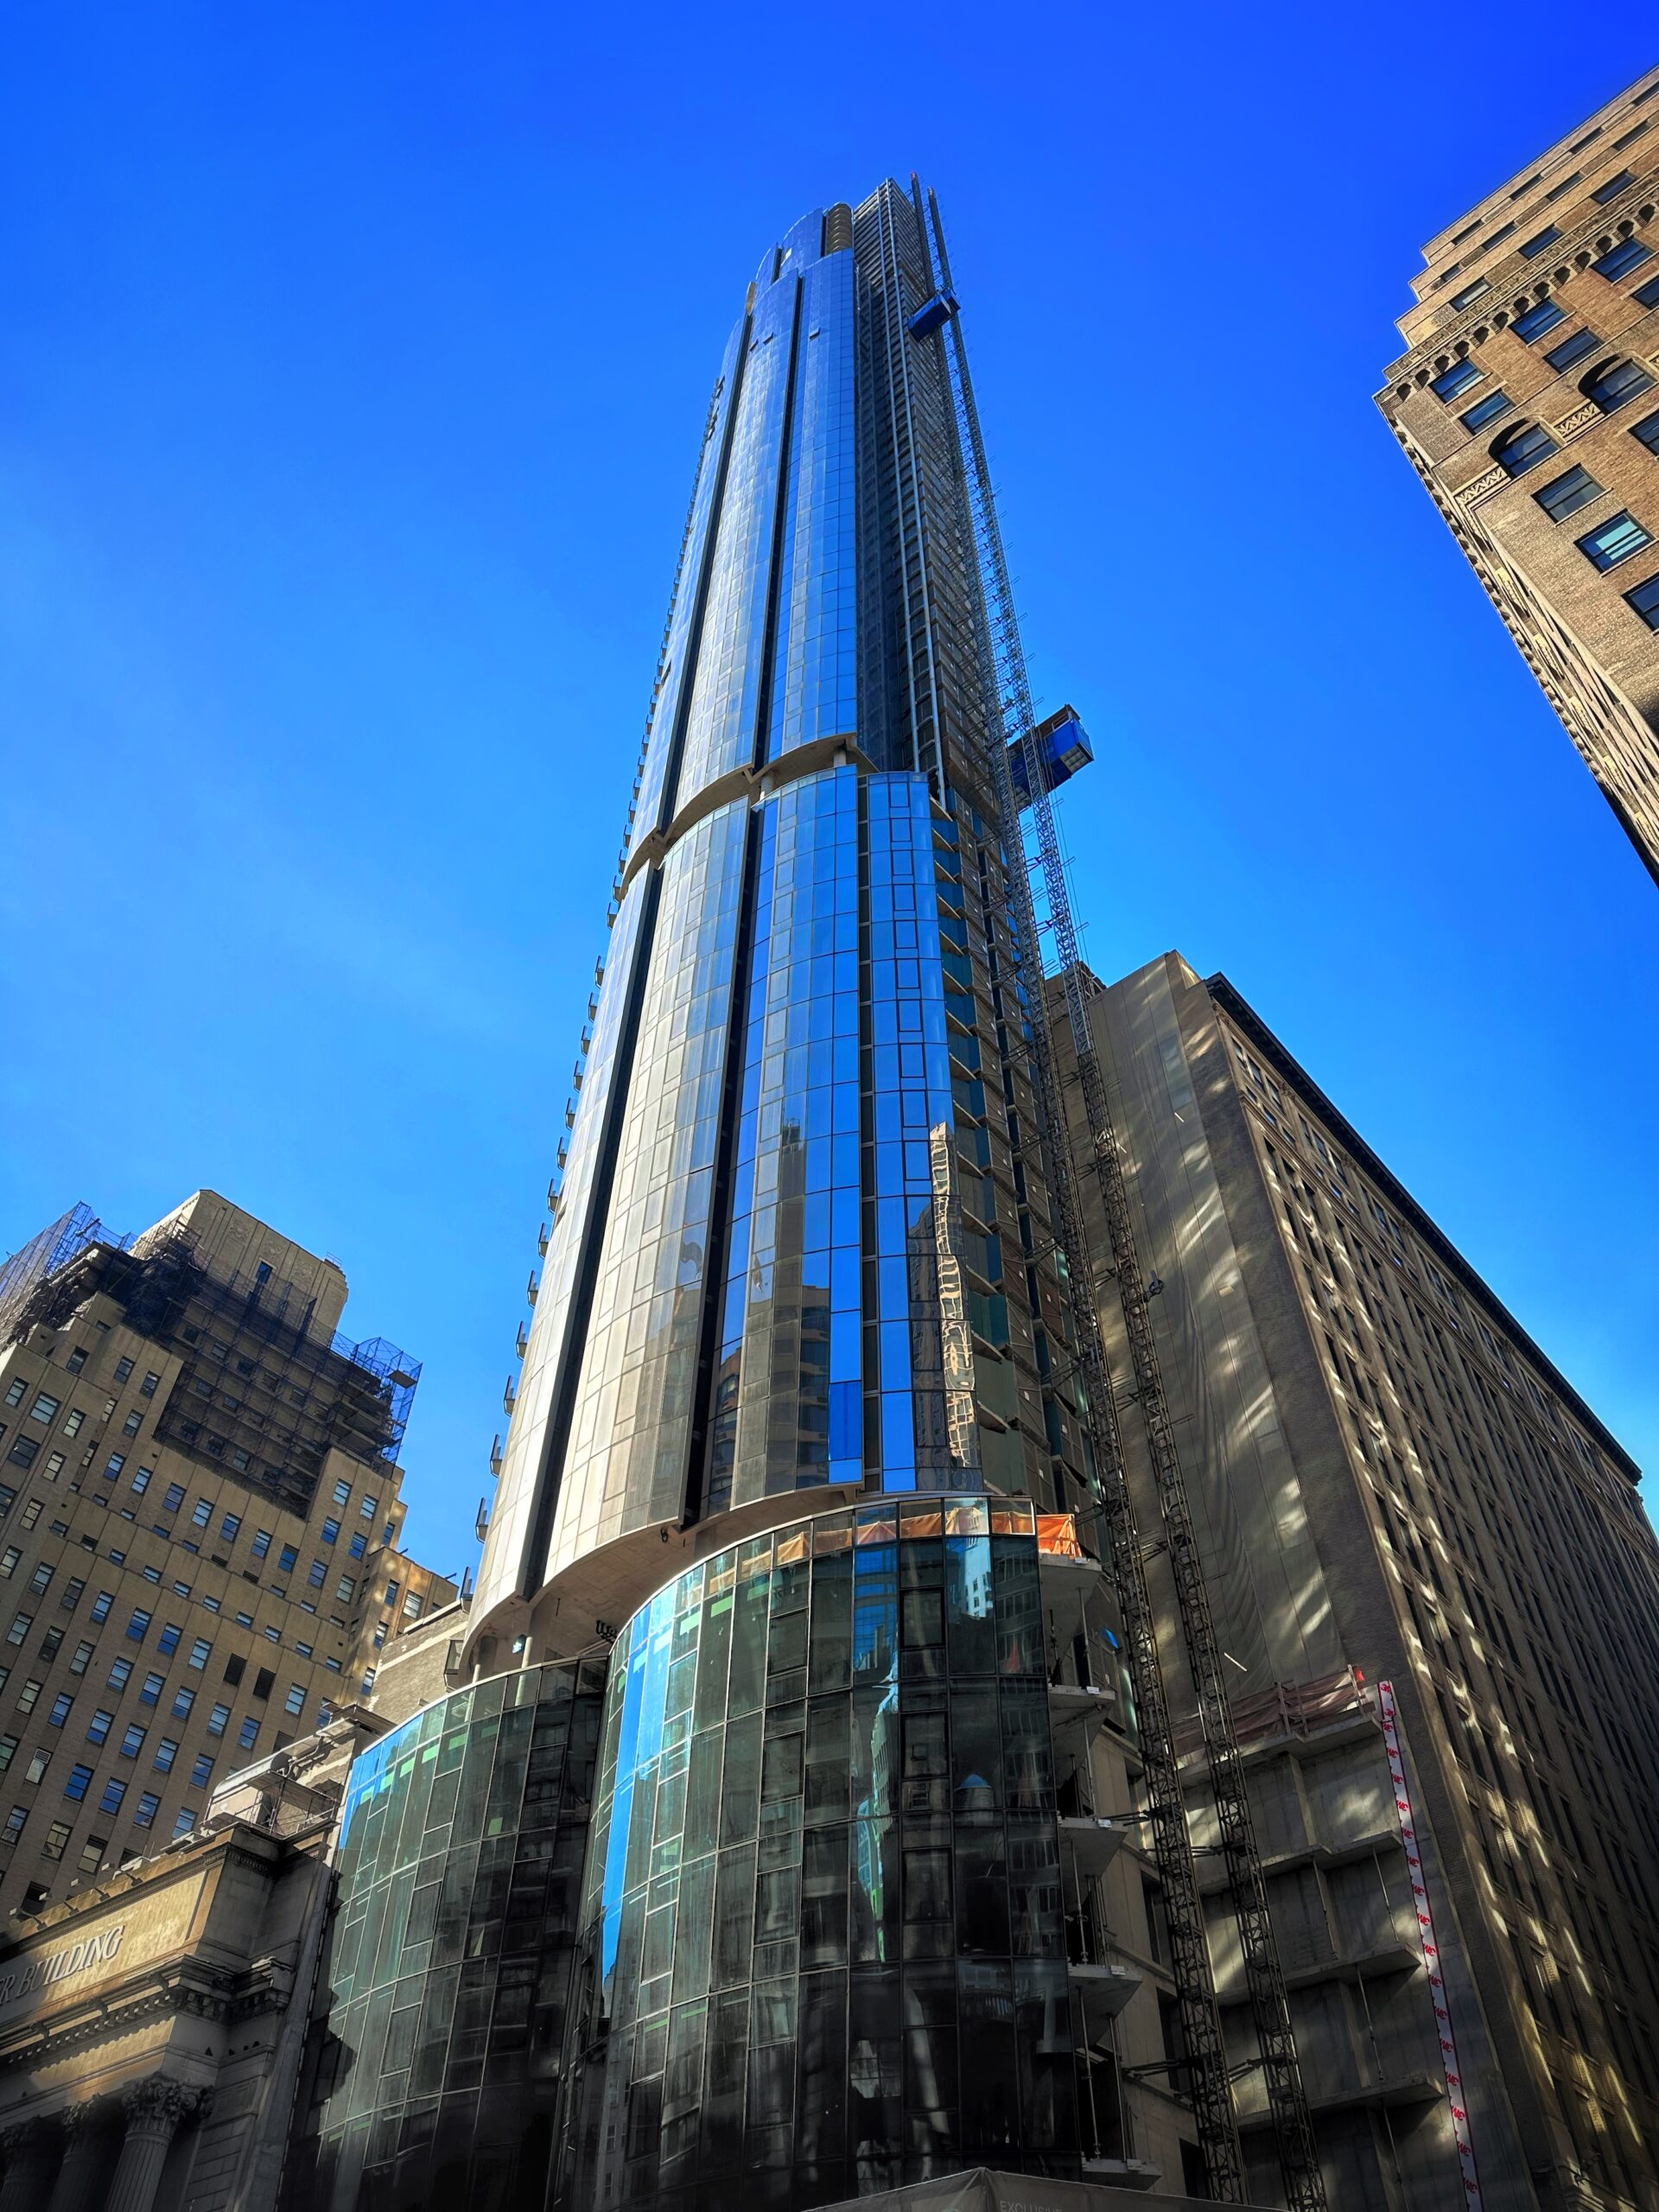
270 Park Avenue. Photo by Michael Young.
501 Summit Avenue. Photo by Michael Young.
501 Summit Avenue. Photo by Michael Young.
375 West 207th Street. Photo by Michael Young.
375 West 207th Street. Photo by Michael Young.
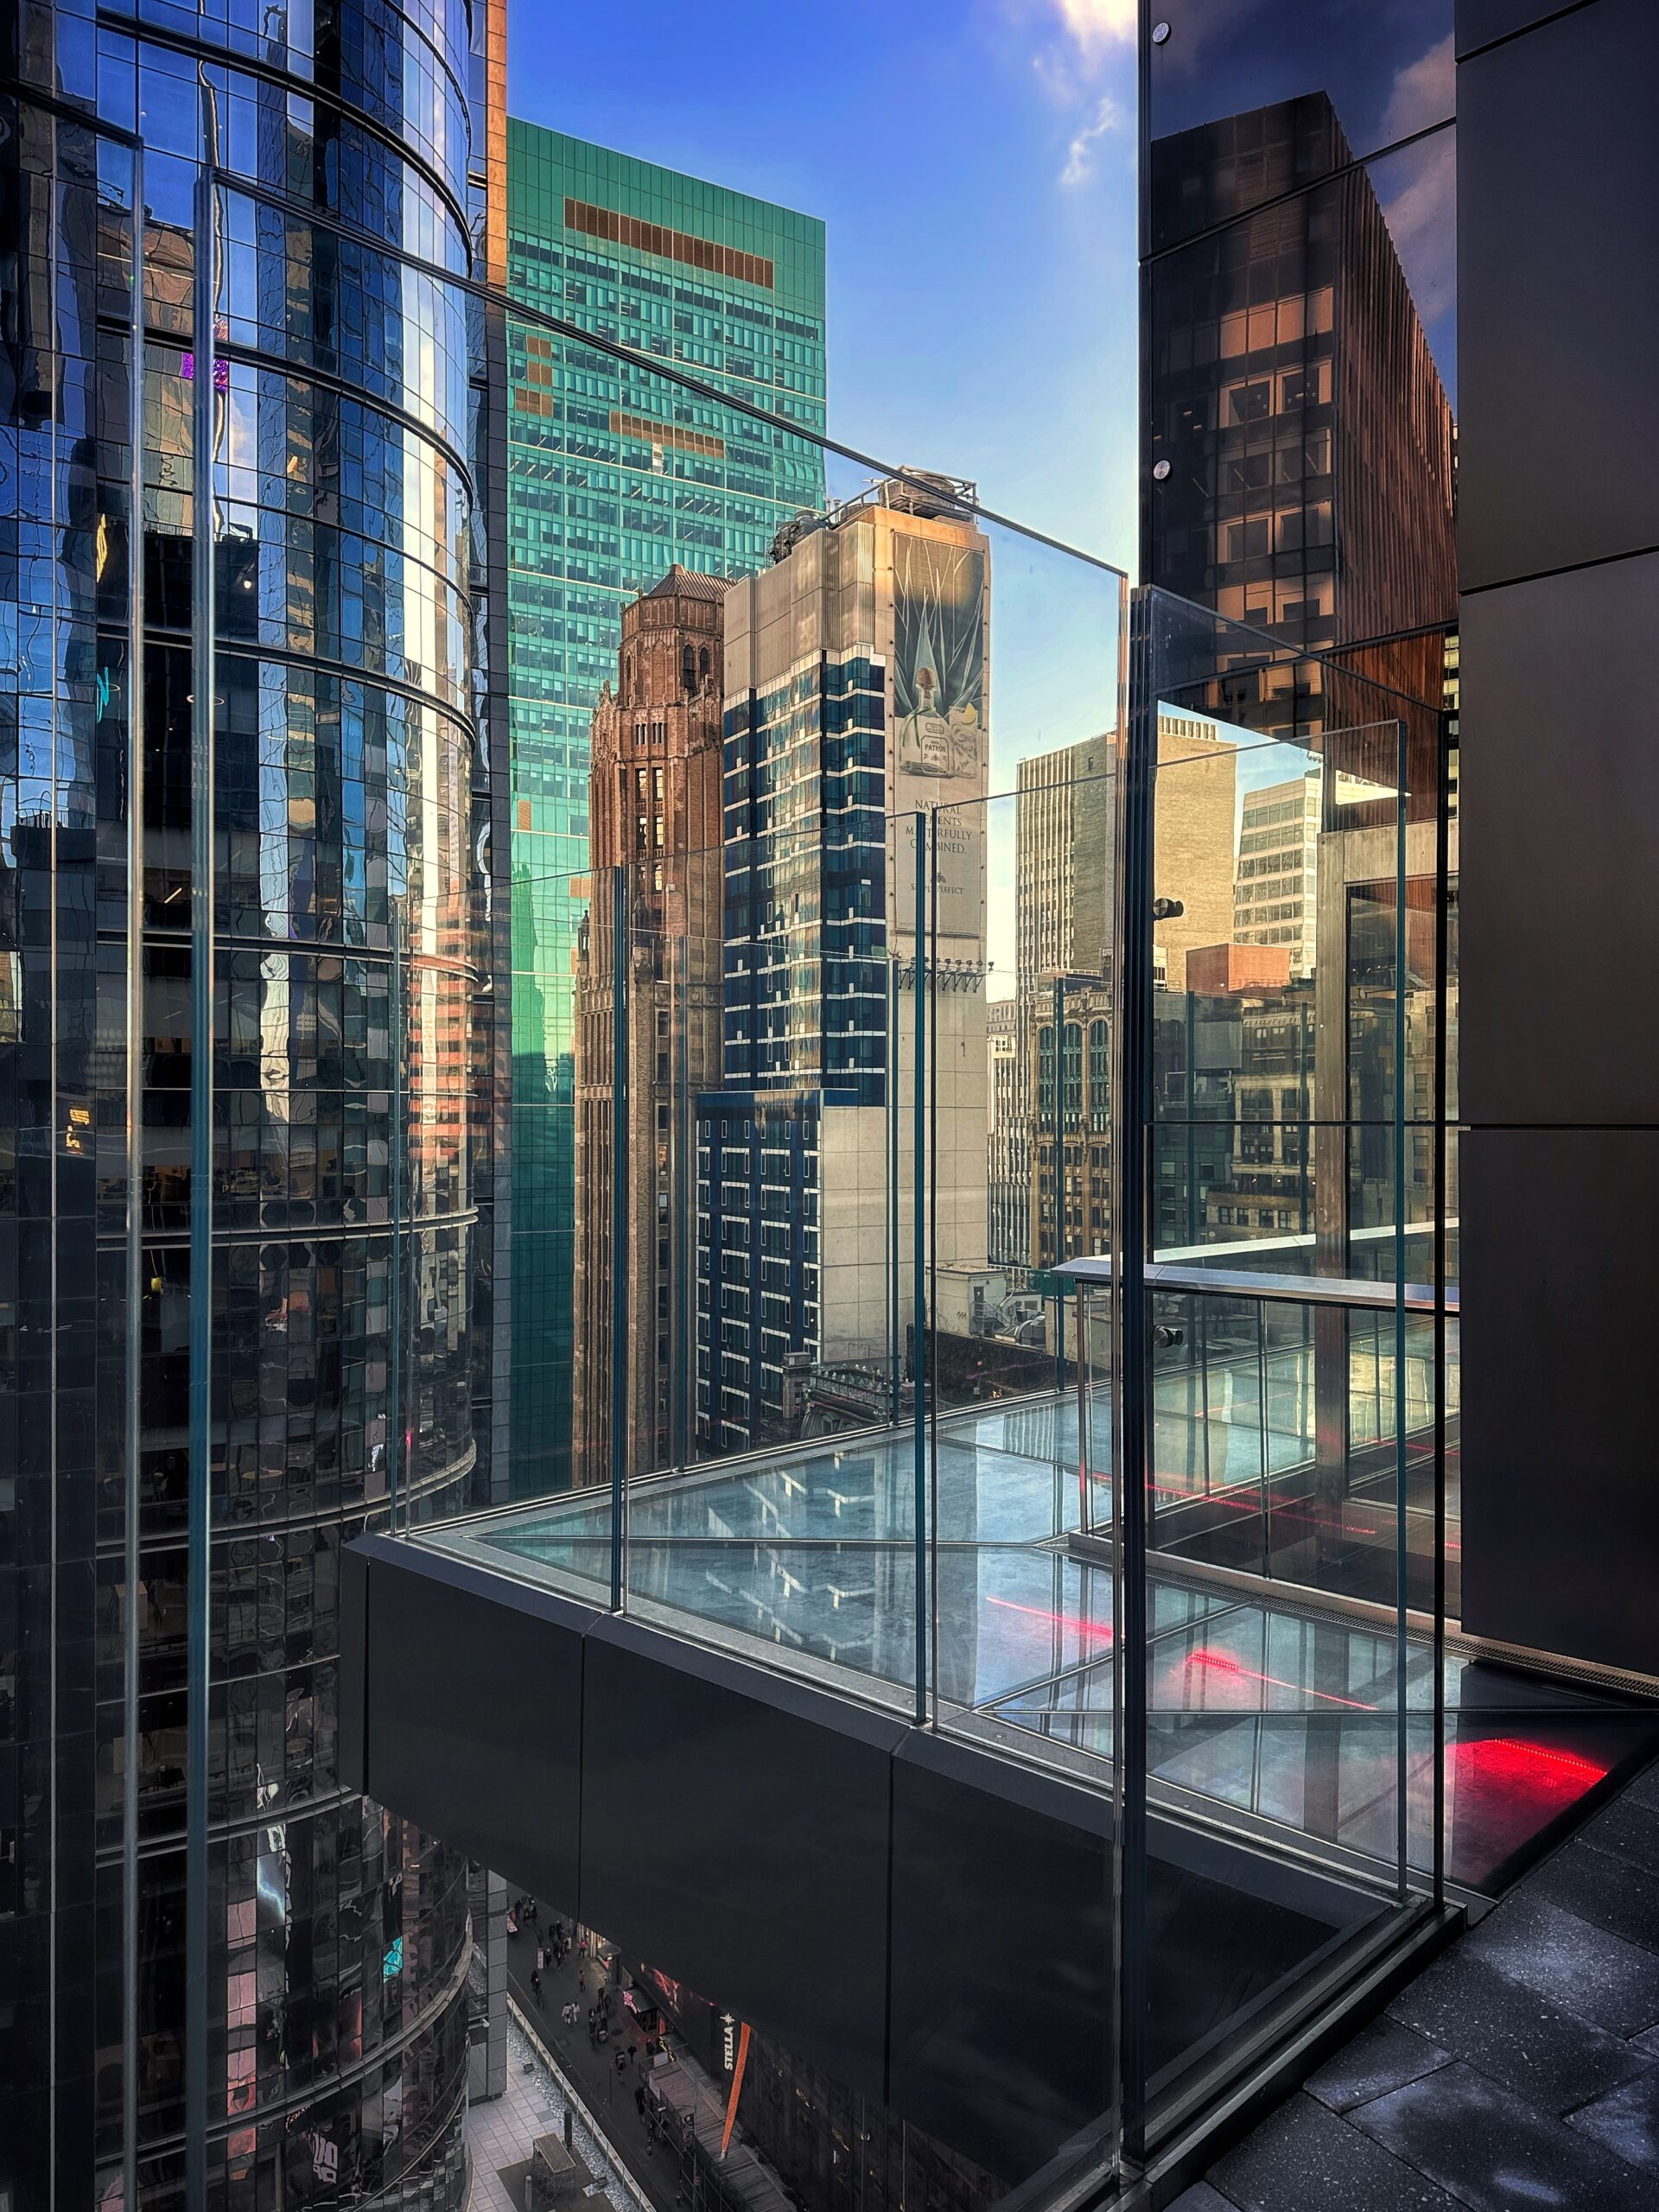
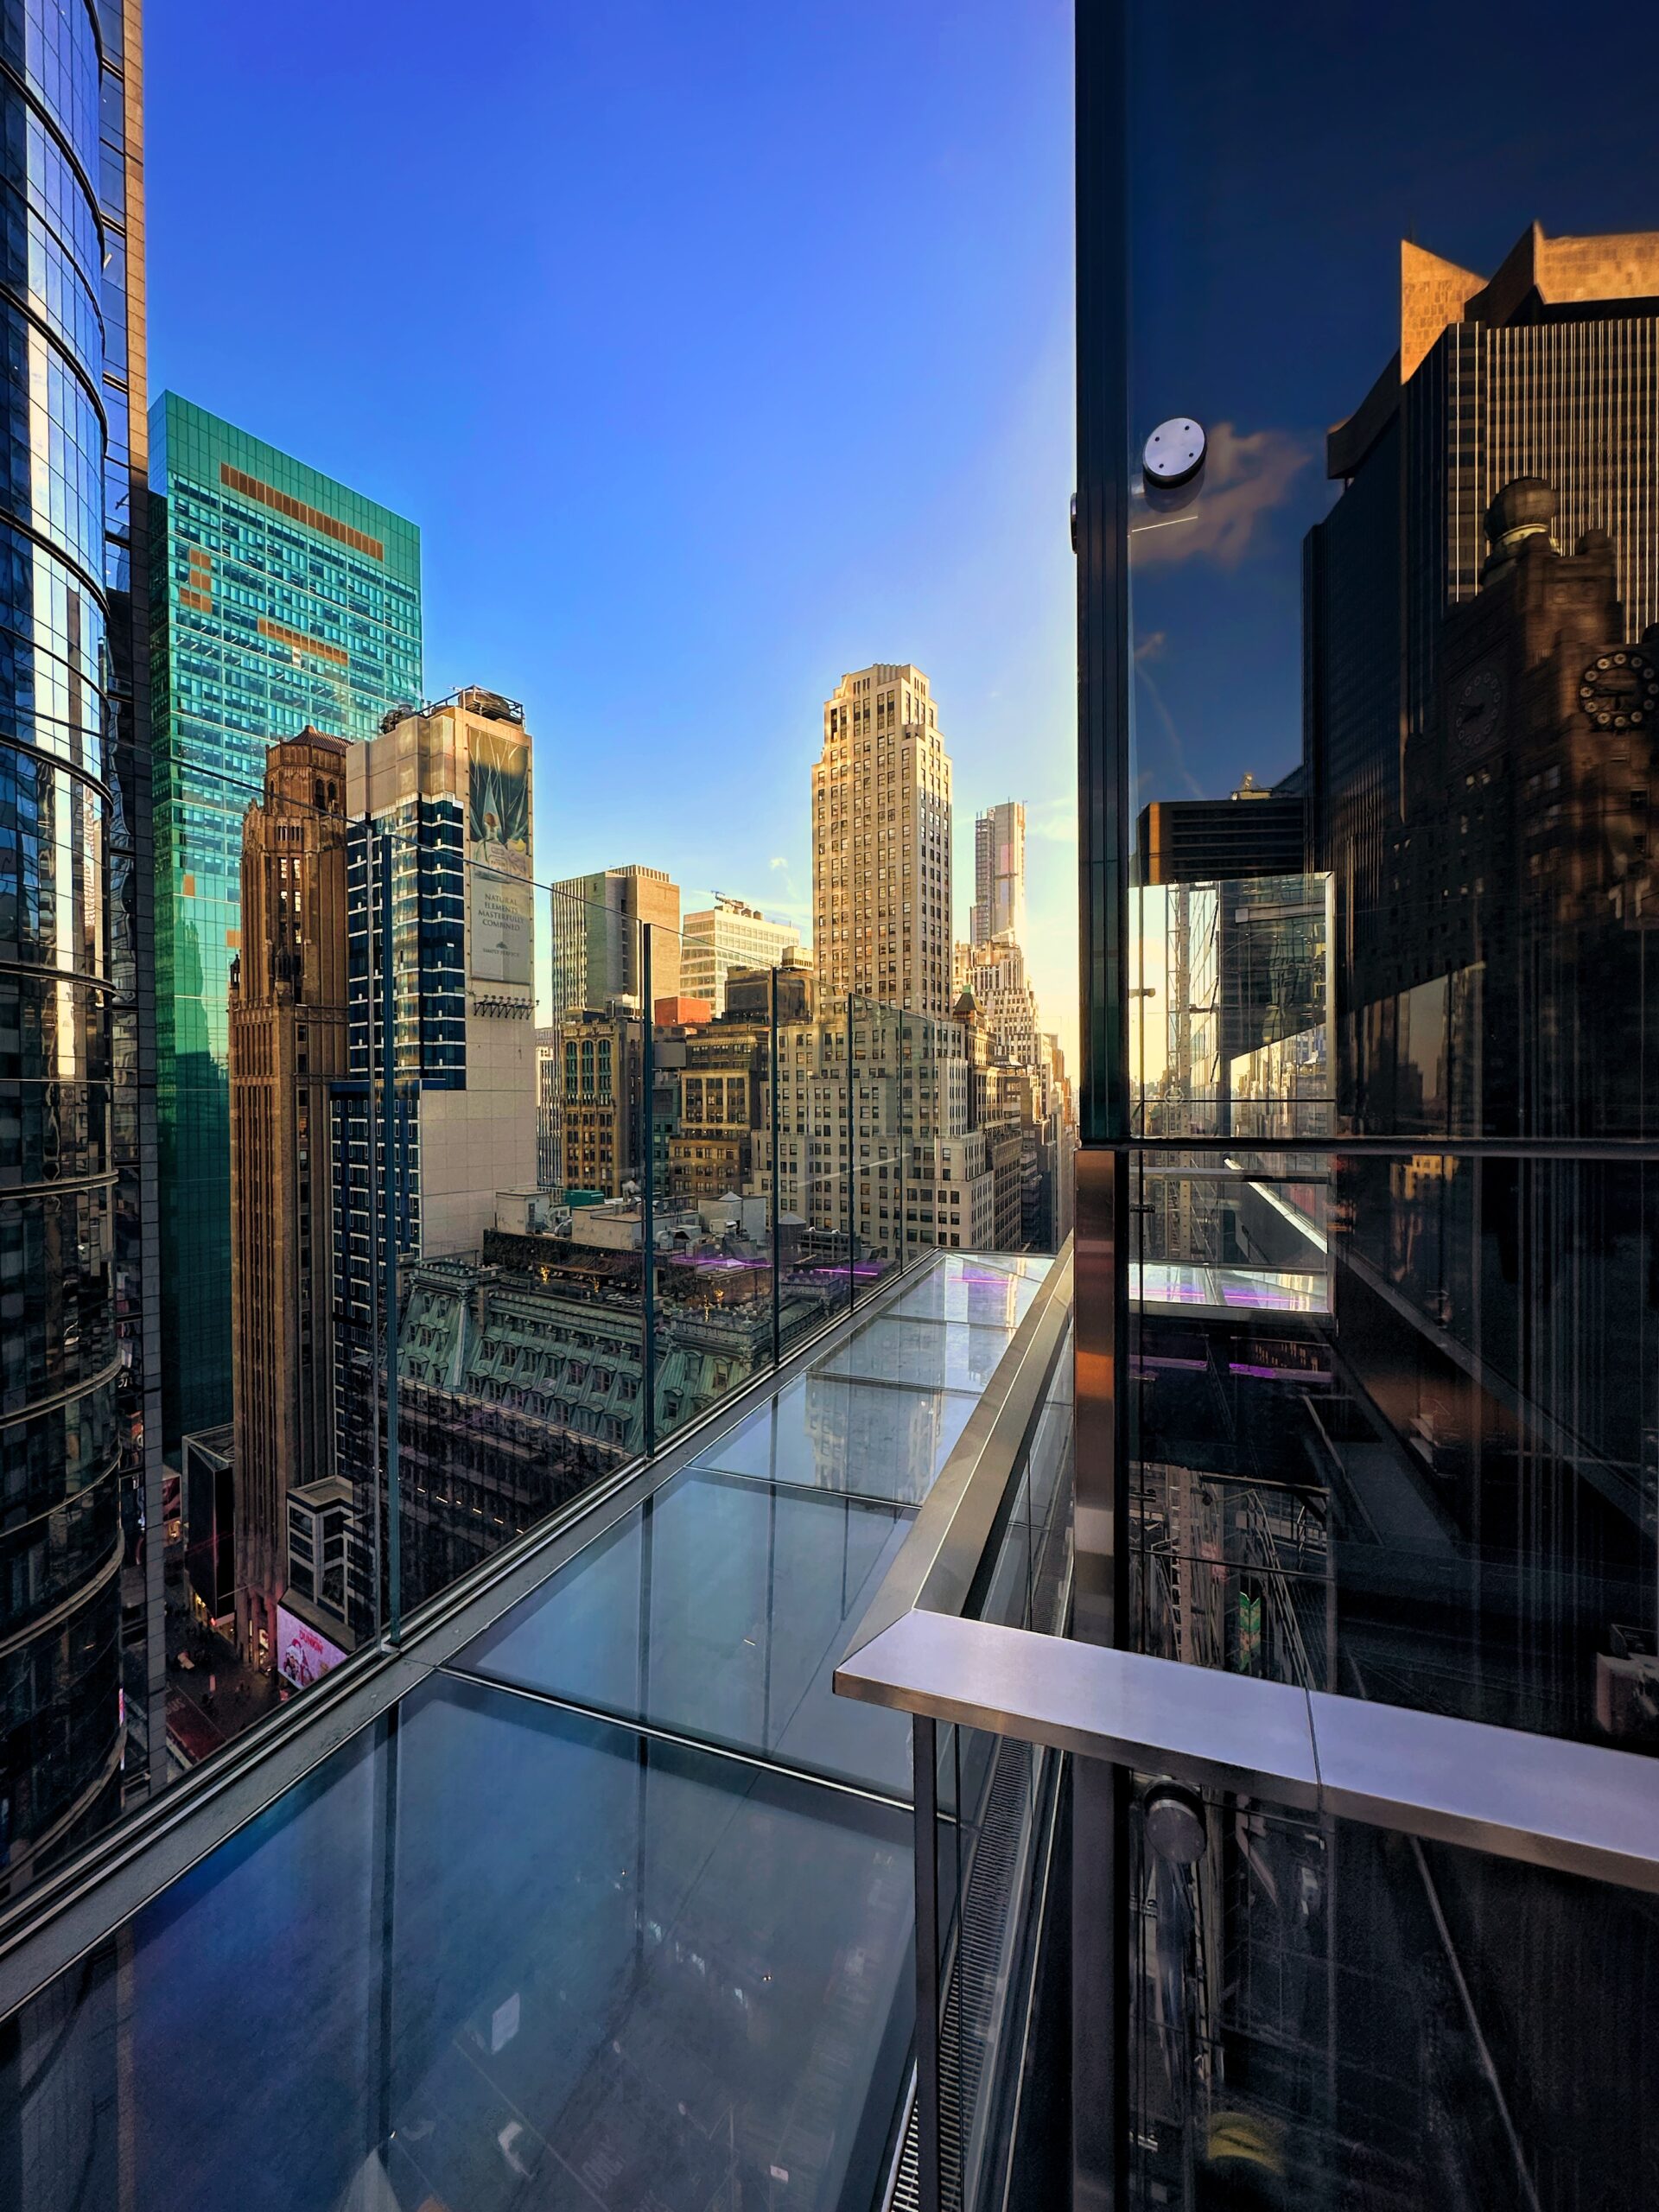
Views from The Journal. Photo by Michael Young.
Views from The Journal. Photo by Michael Young.
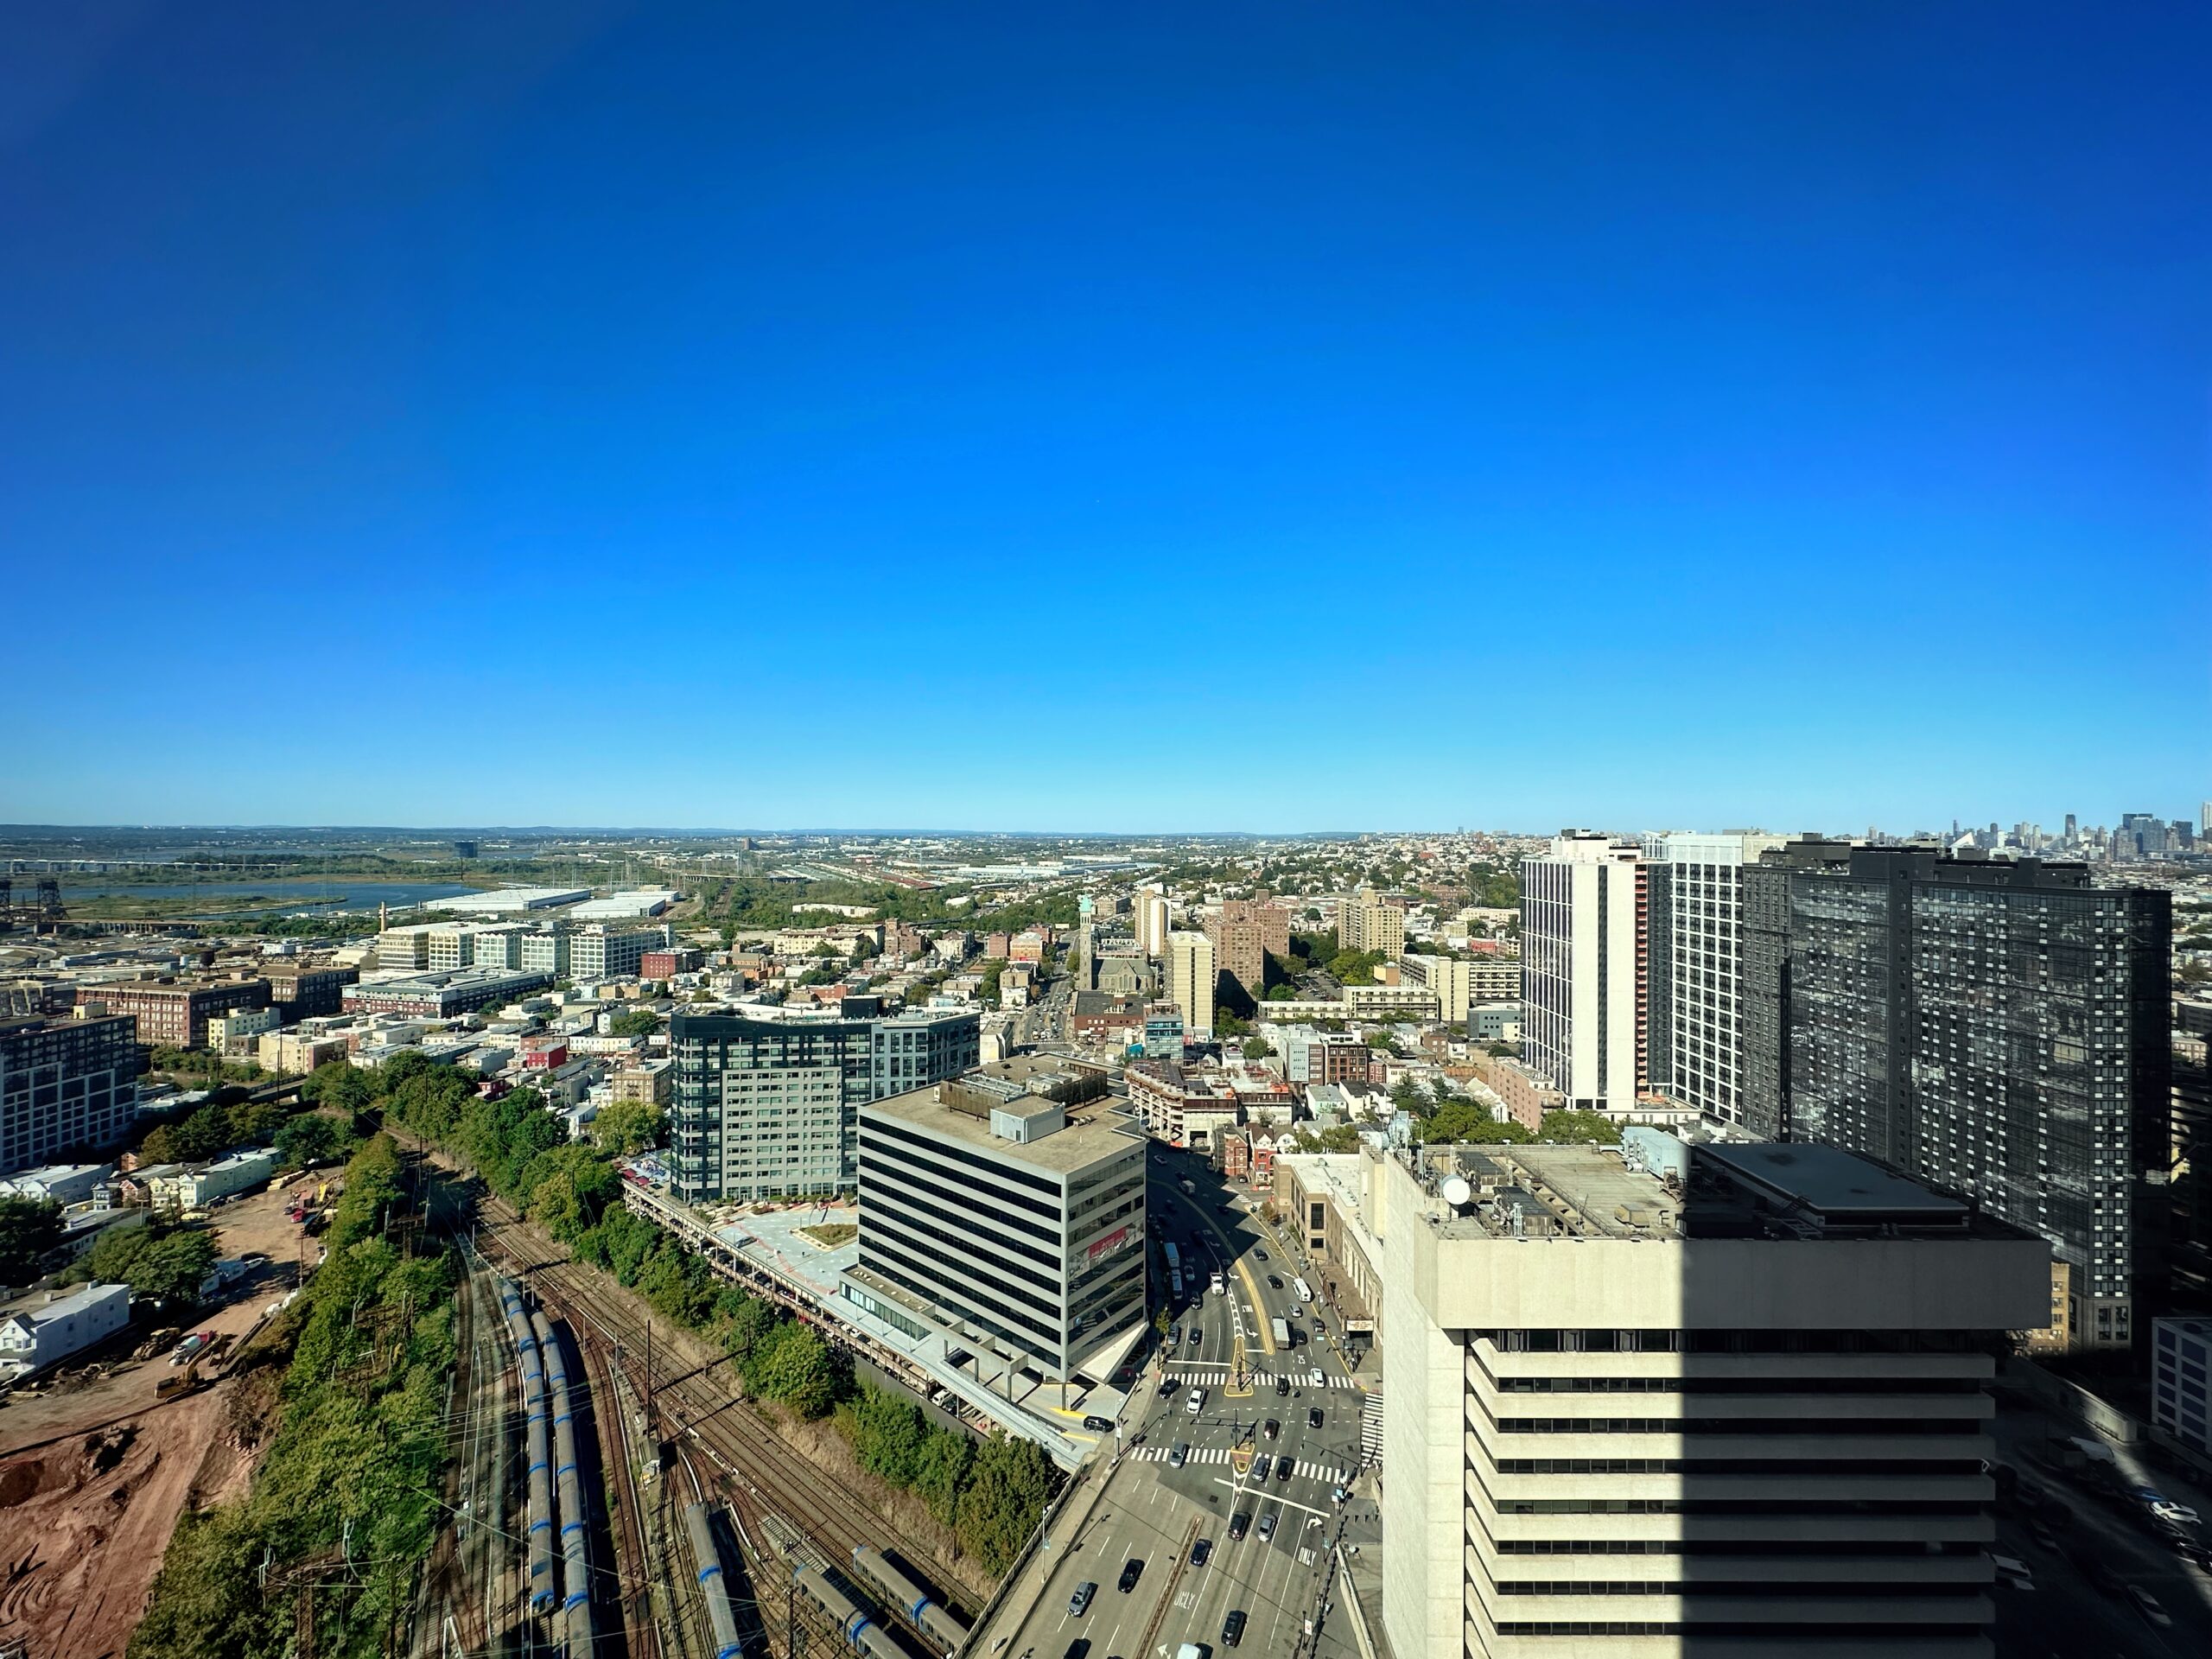
Views from The Journal. Photo by Michael Young.
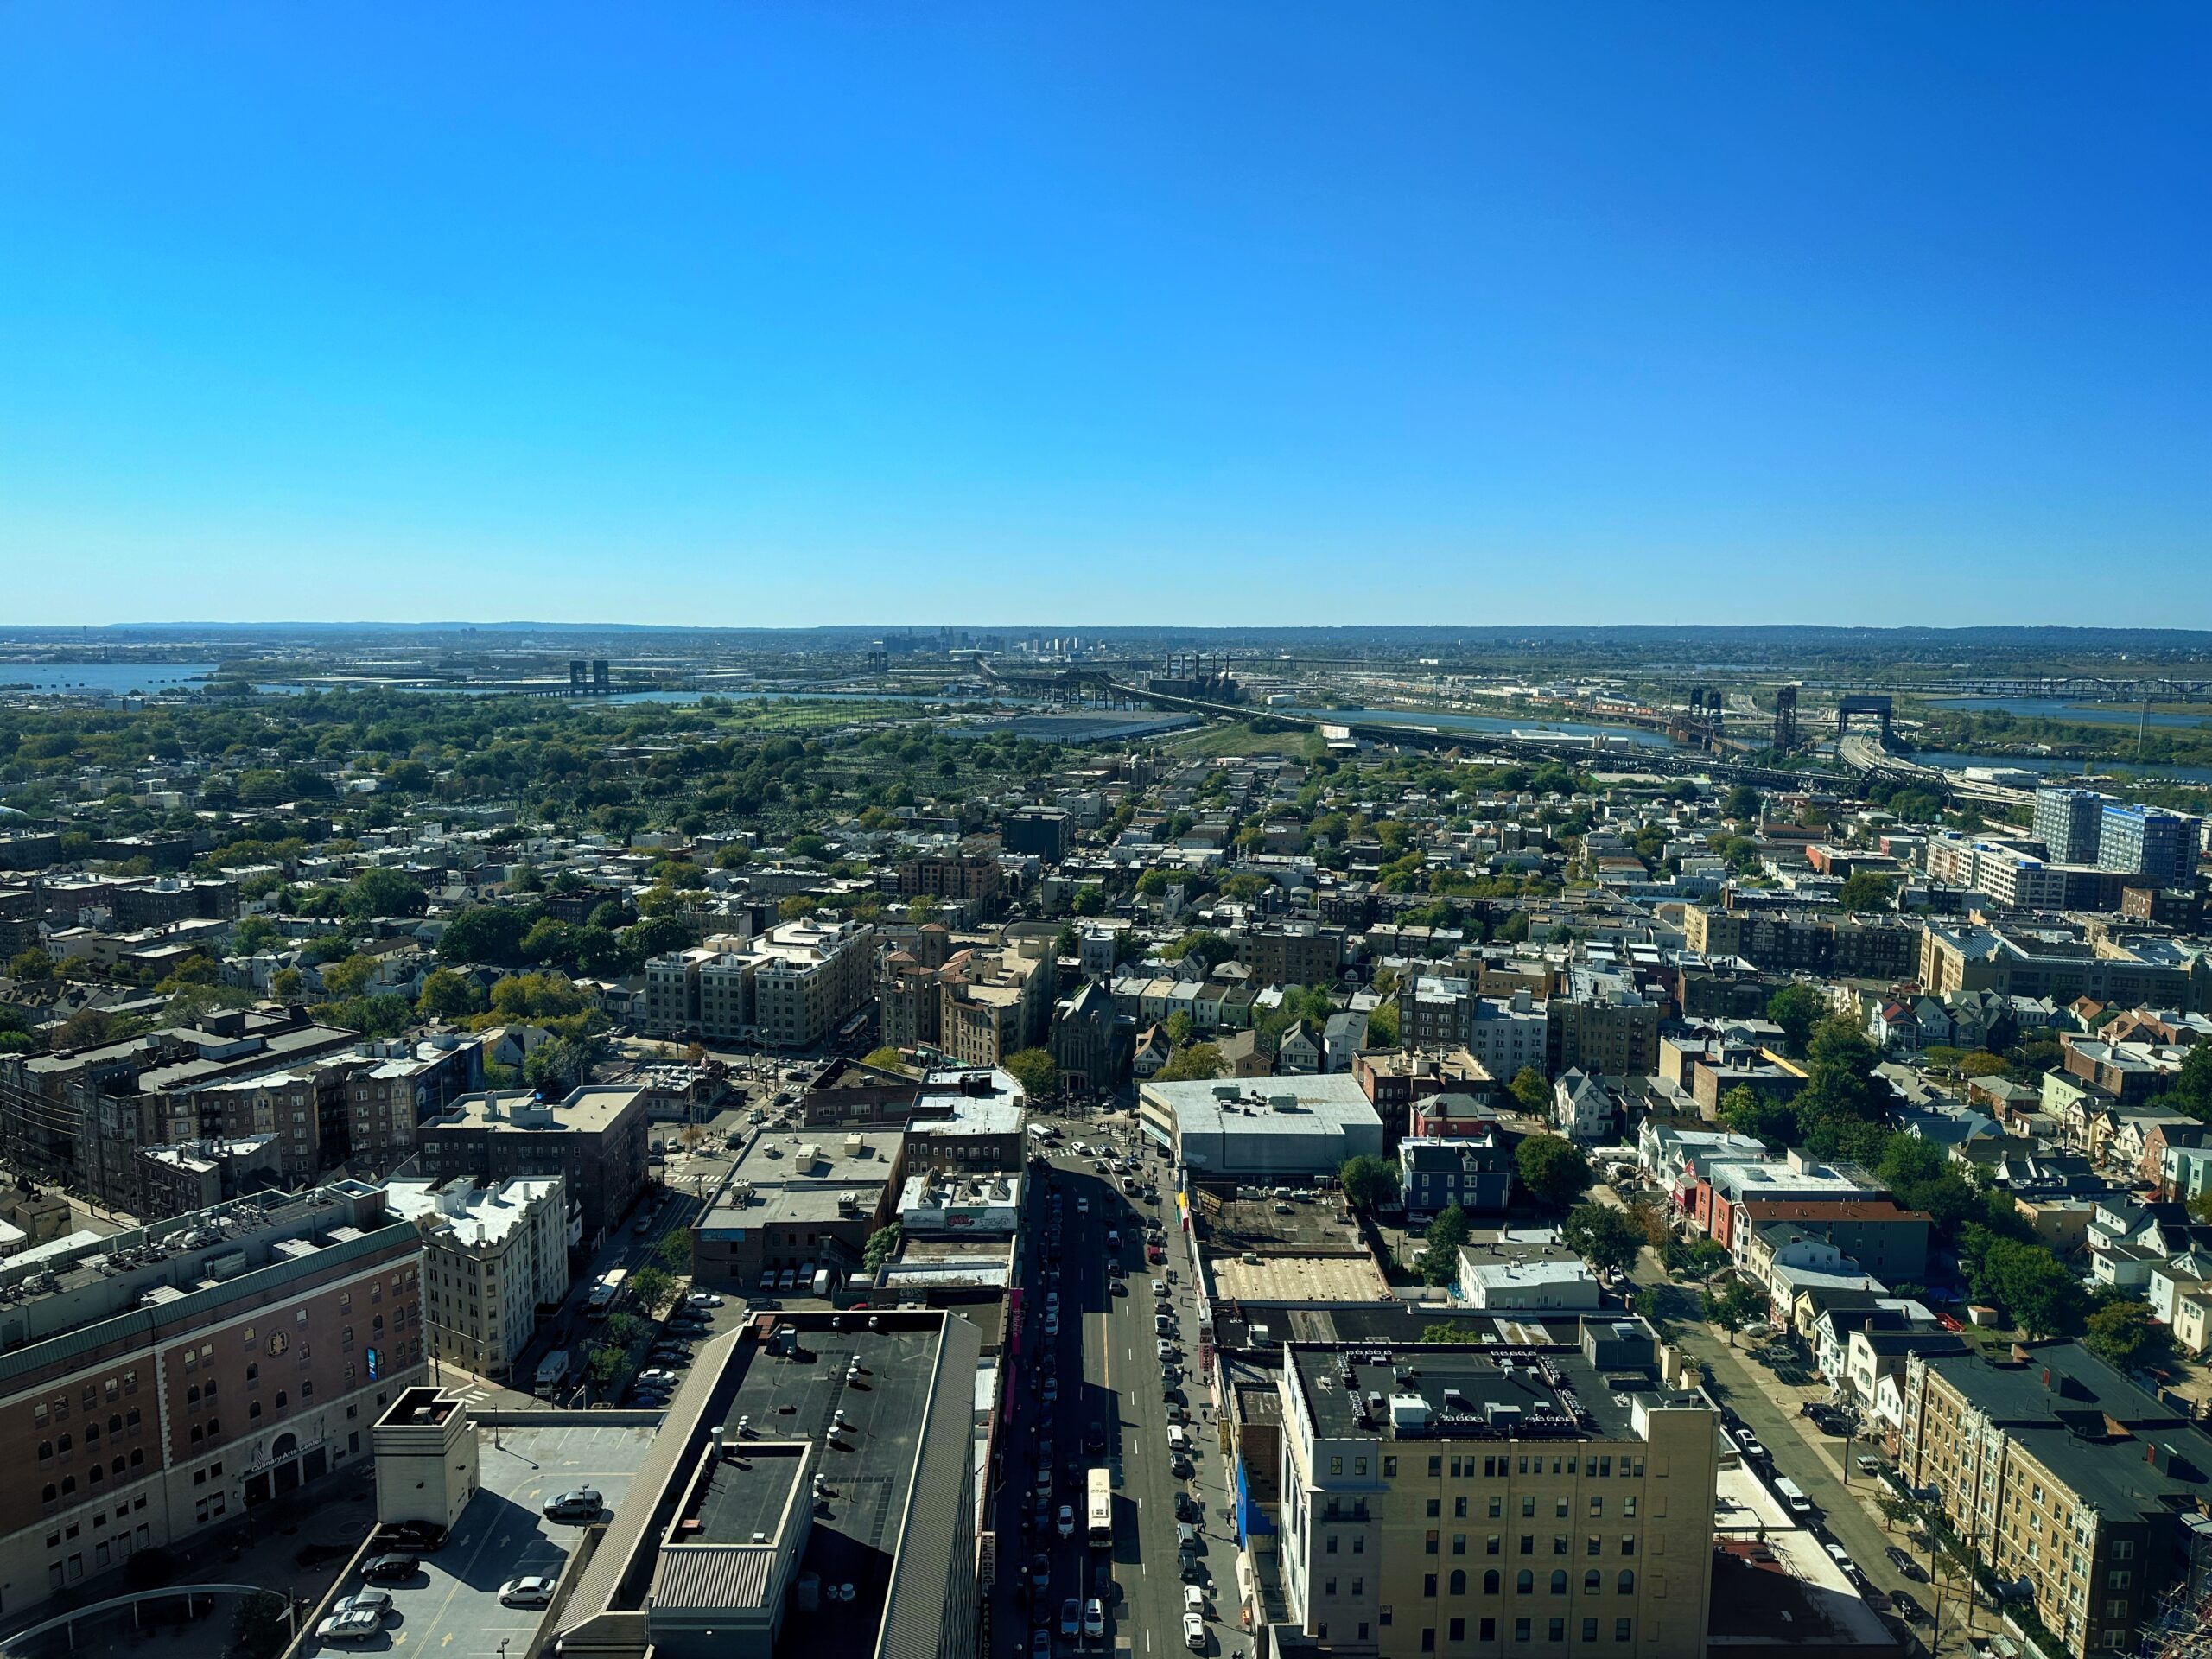
Views from The Journal. Photo by Michael Young.
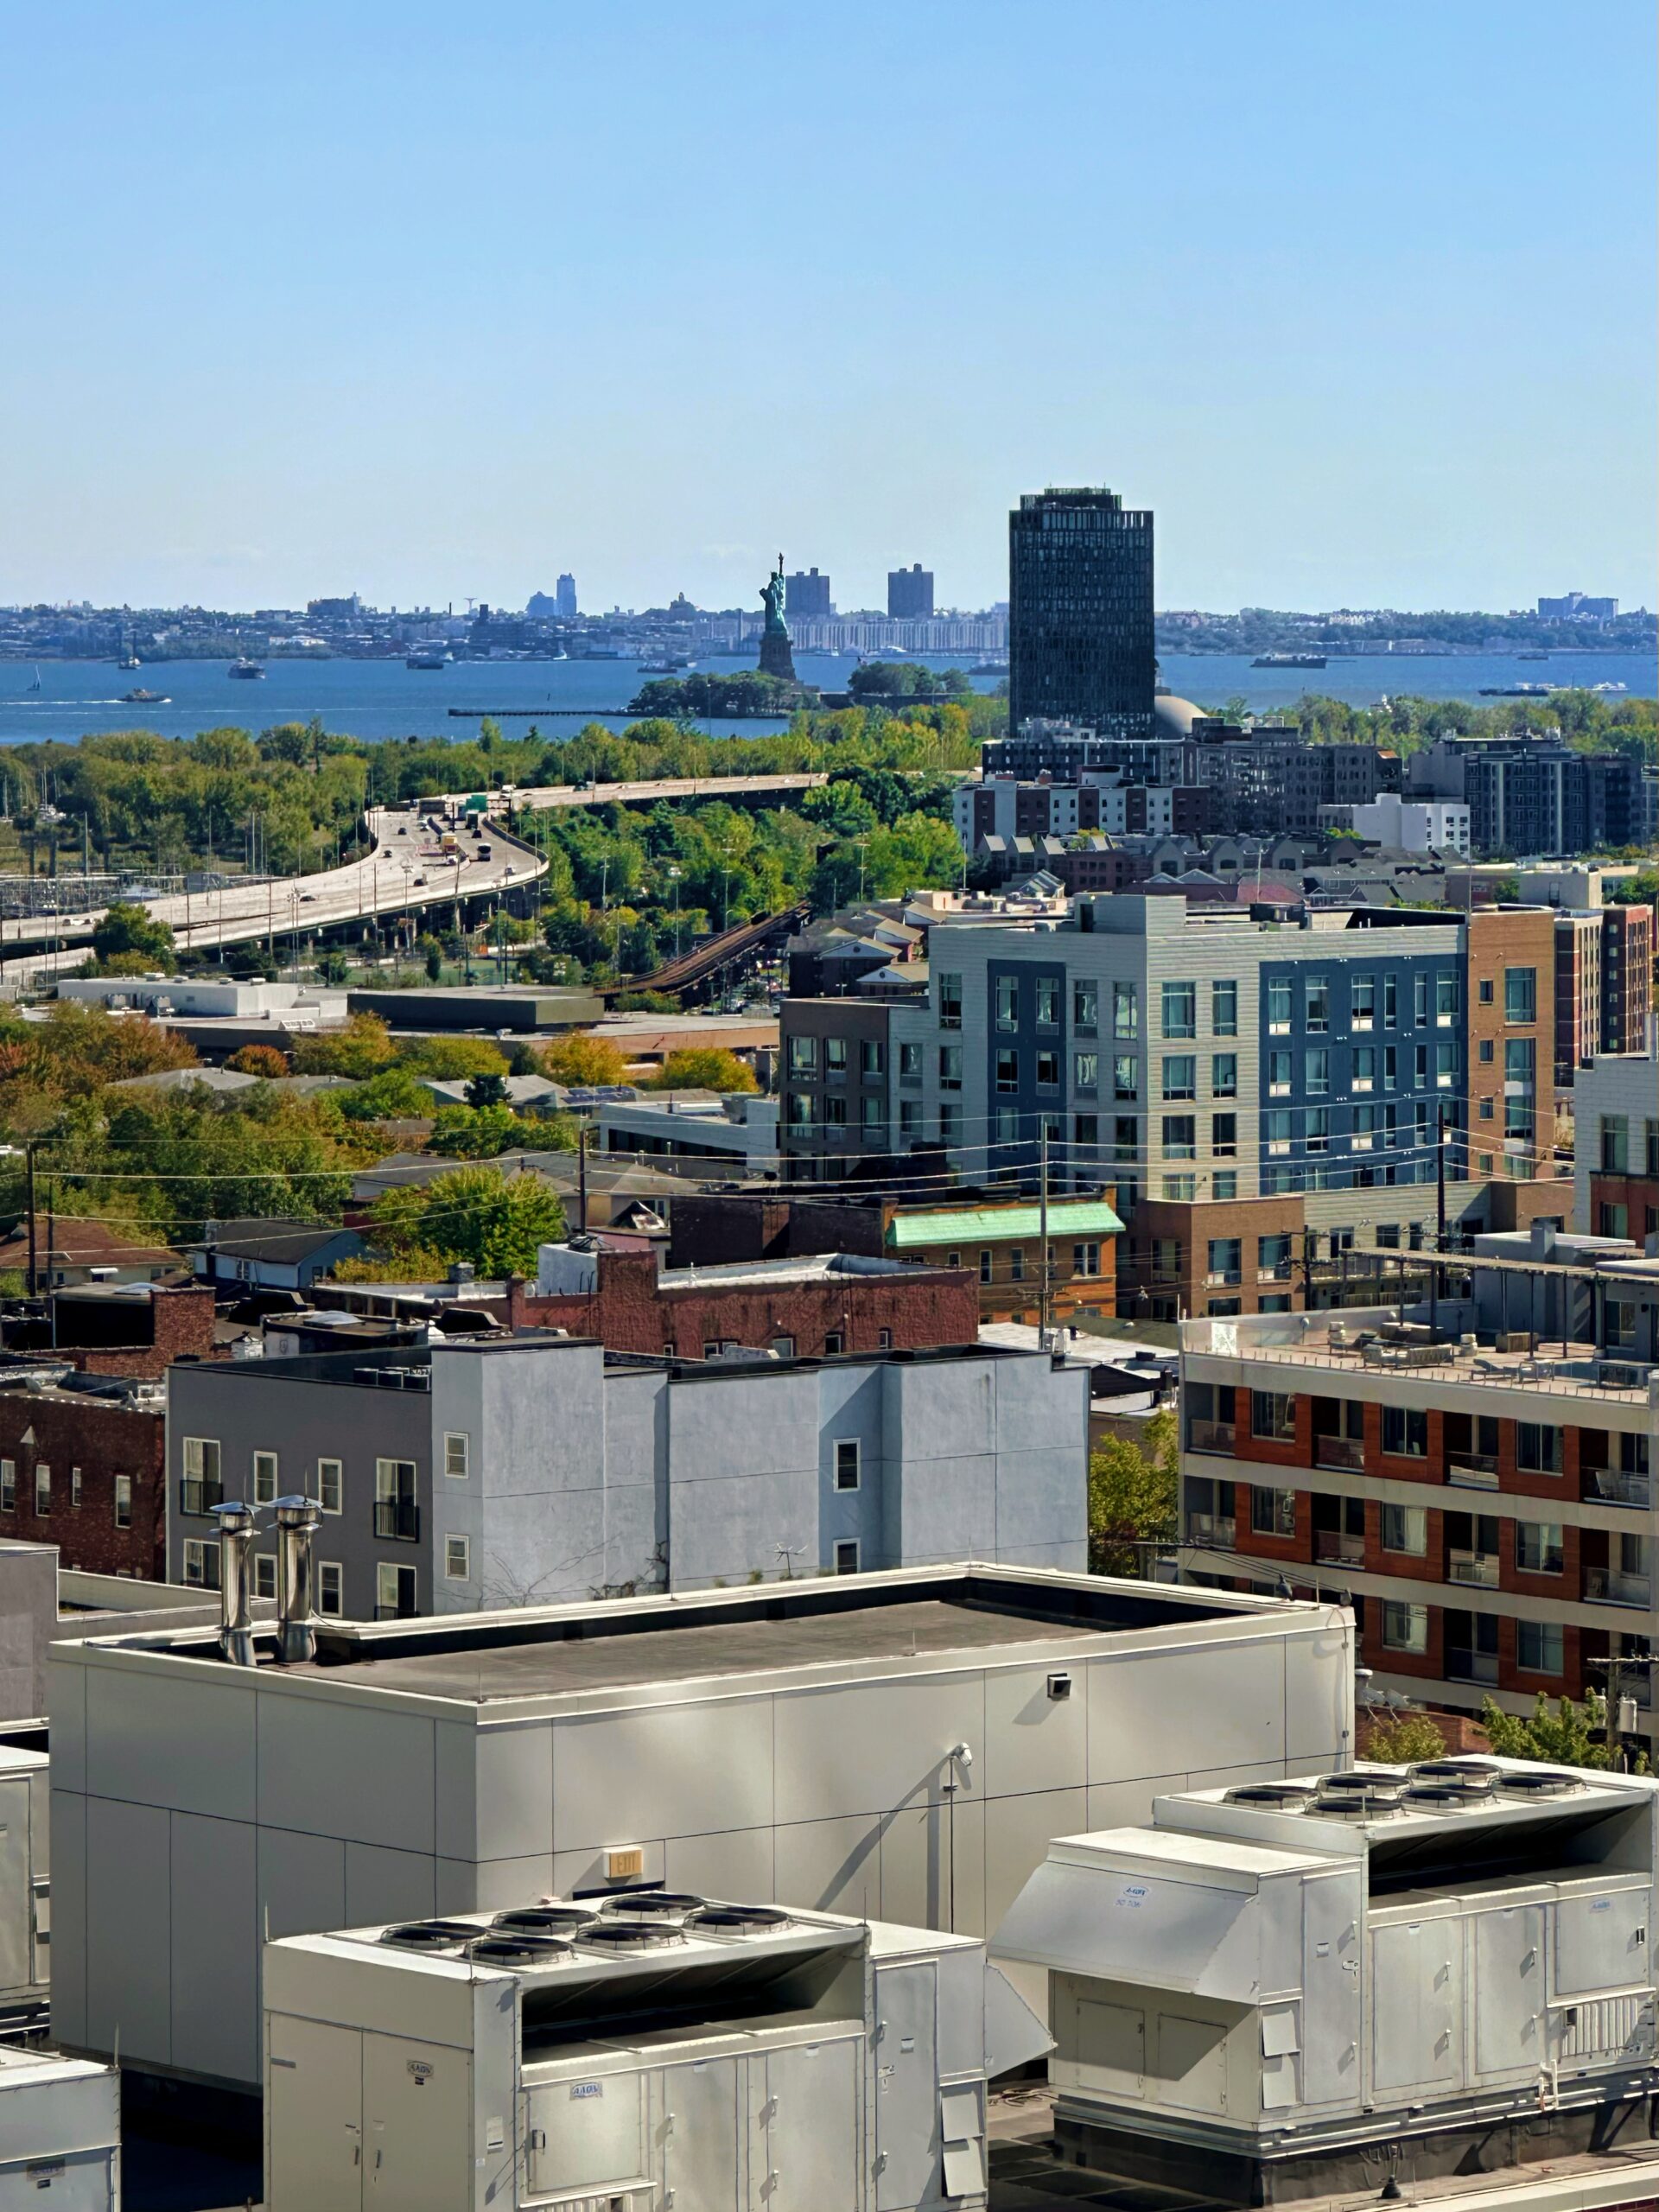
Views from The Journal. Photo by Michael Young.
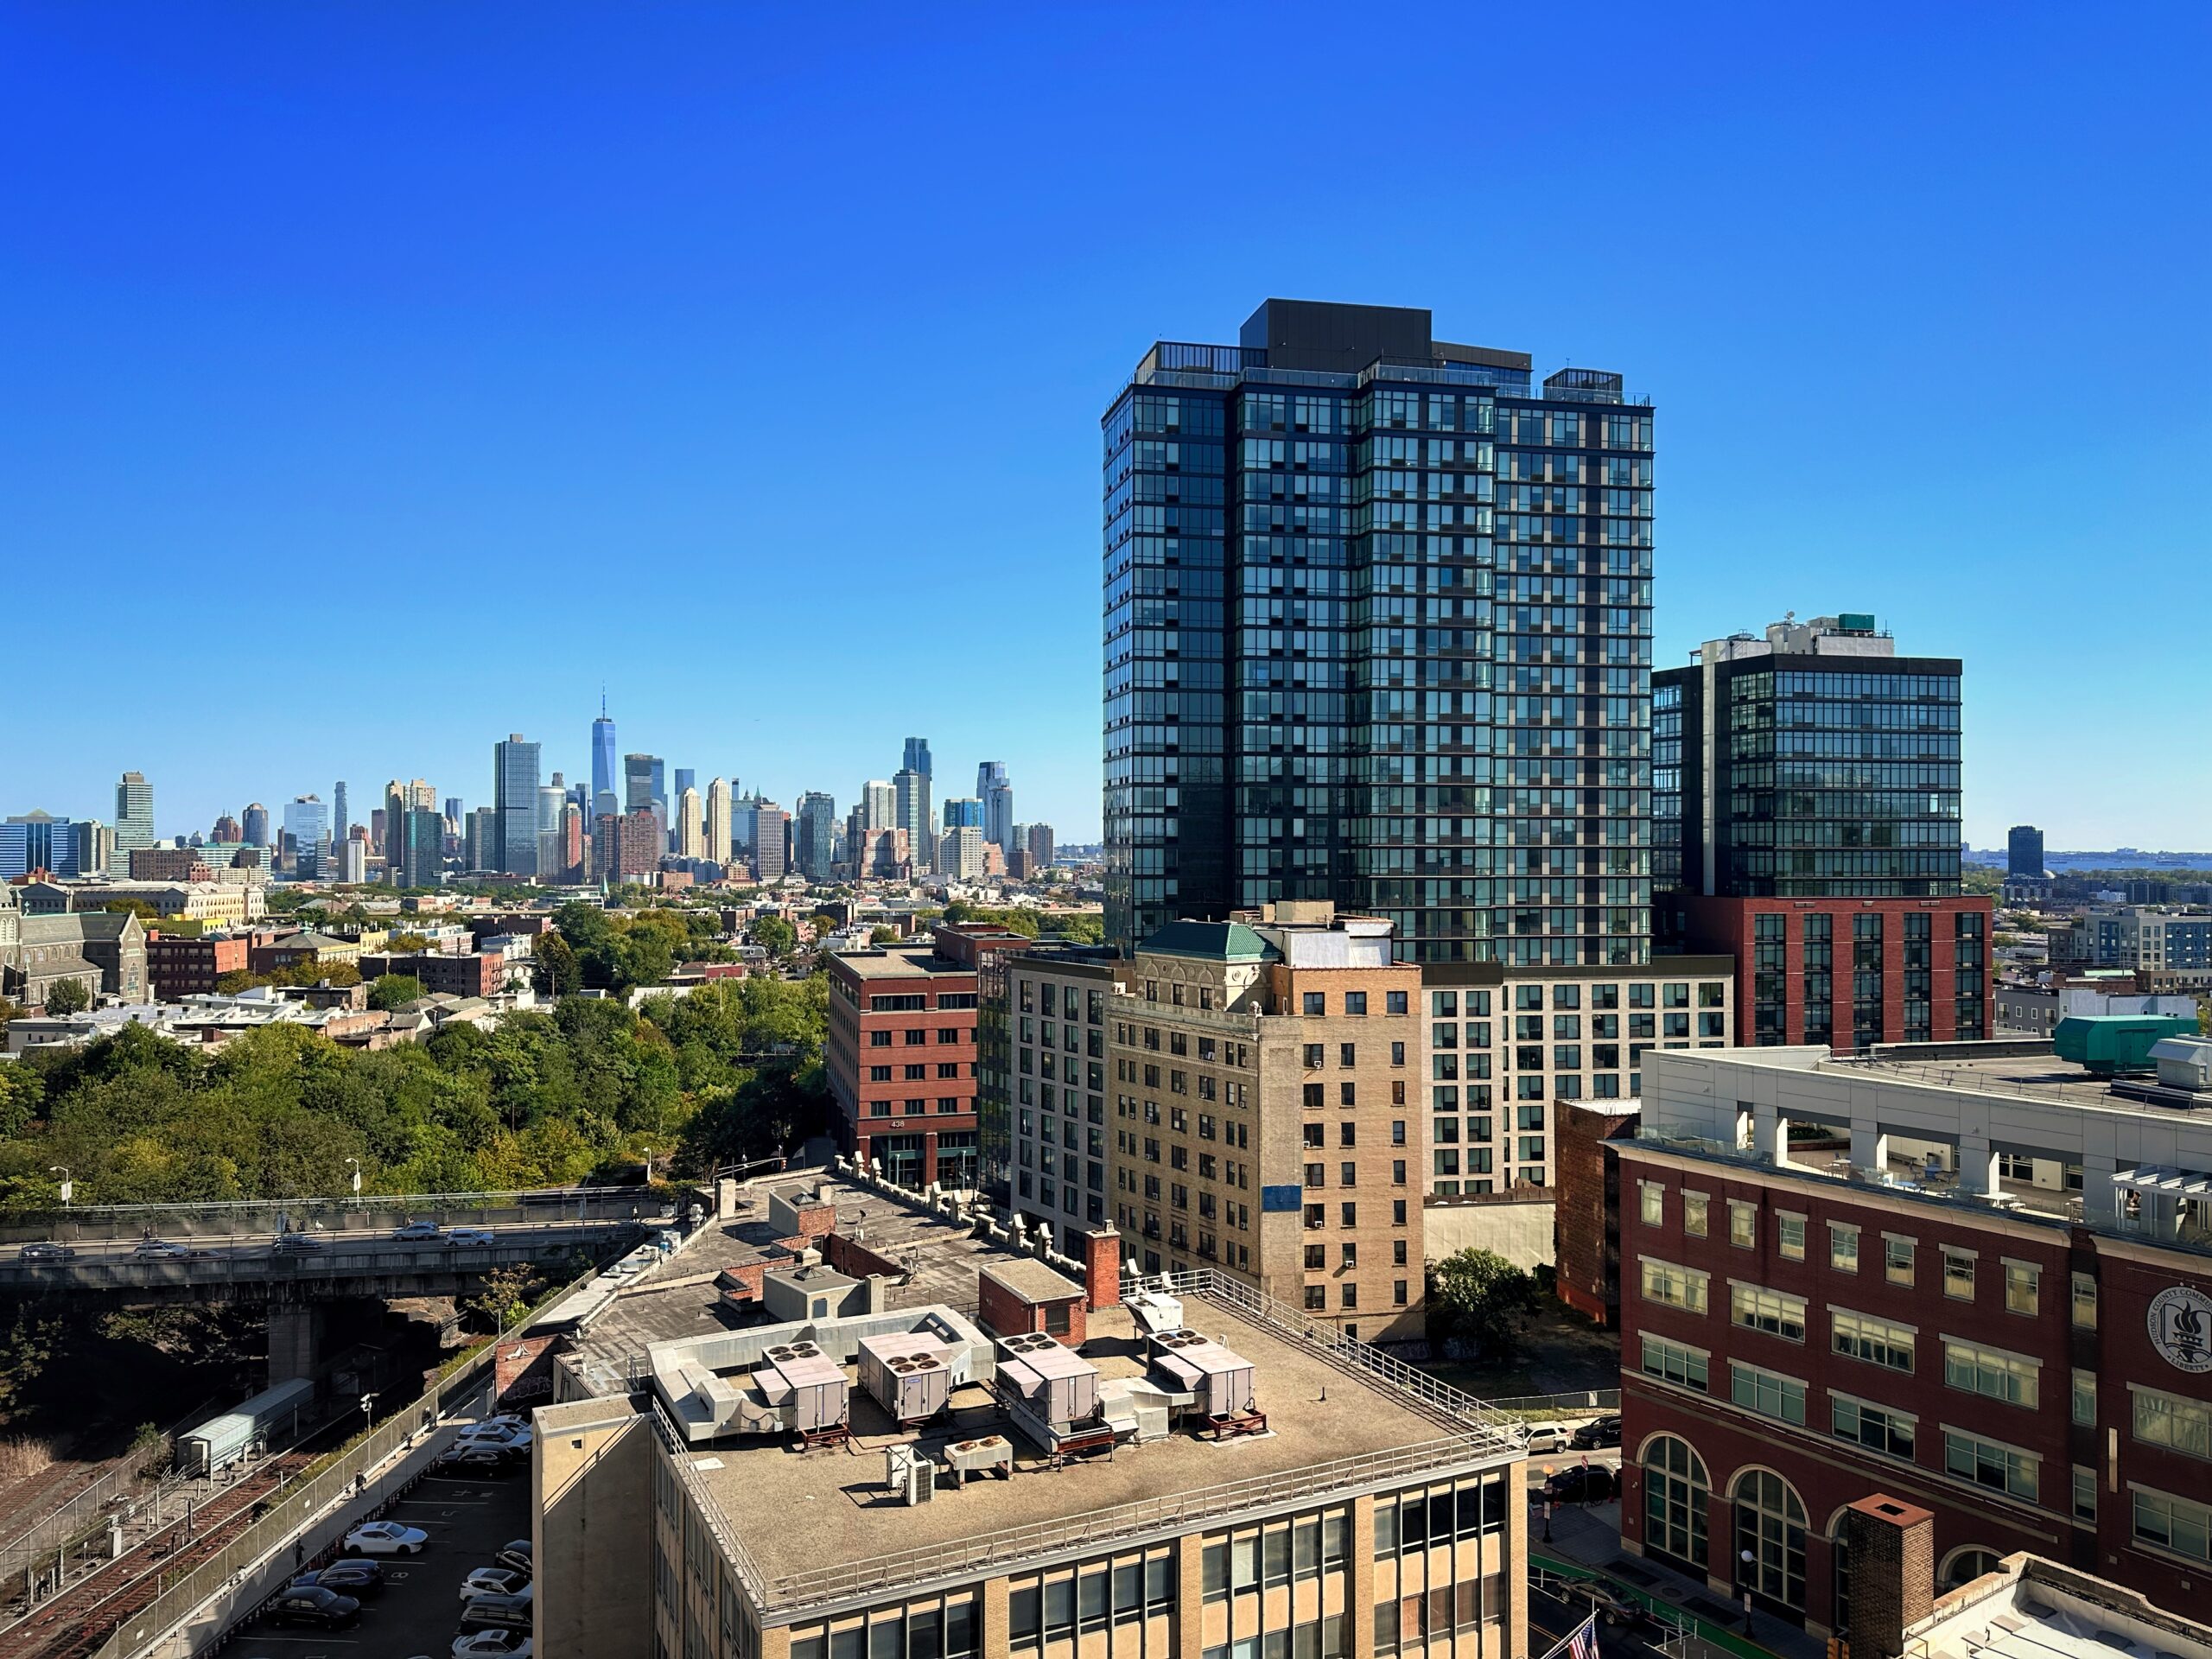
Views from The Journal. Photo by Michael Young.
660 Lexington Avenue. Photo by Michael Young.
59 Maiden Lane. Photo by Michael Young.

1 East 57th Street. Photo by Michael Young.

1 East 57th Street. Photo by Michael Young.

1 East 57th Street. Photo by Michael Young.
1 East 57th Street. Photo by Michael Young.
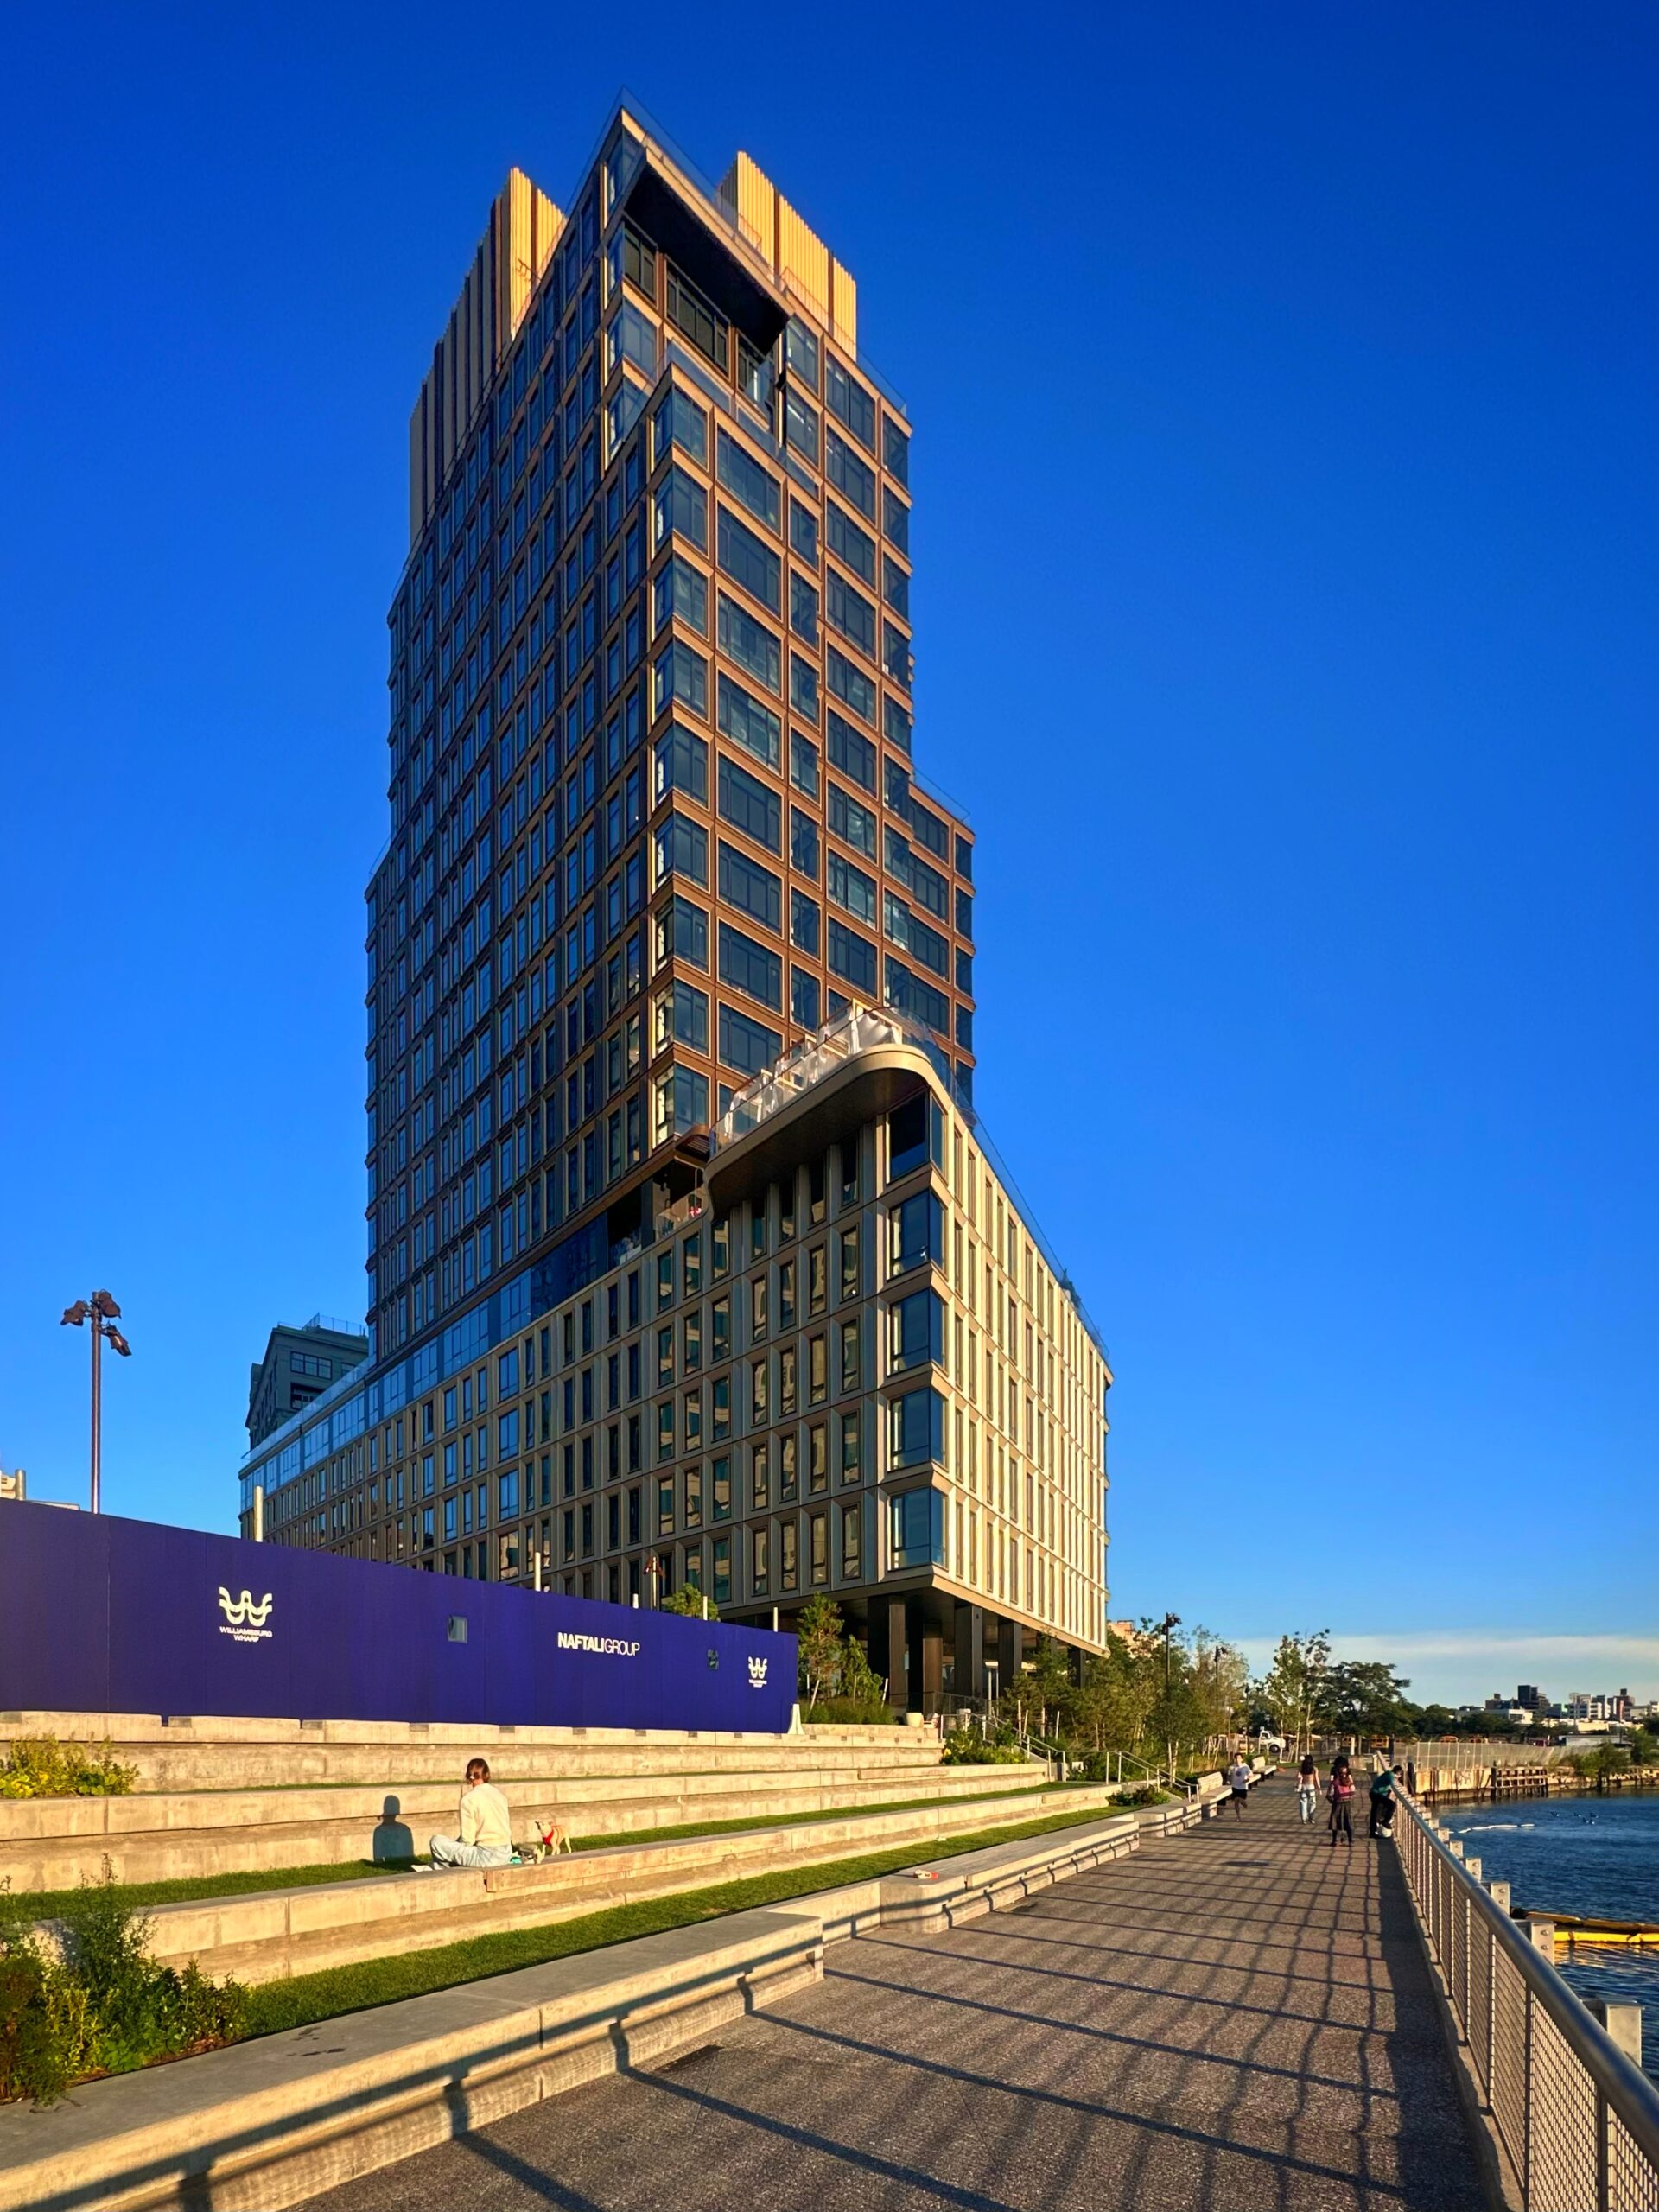
Williamsburg Wharf. Photo by Michael Young.
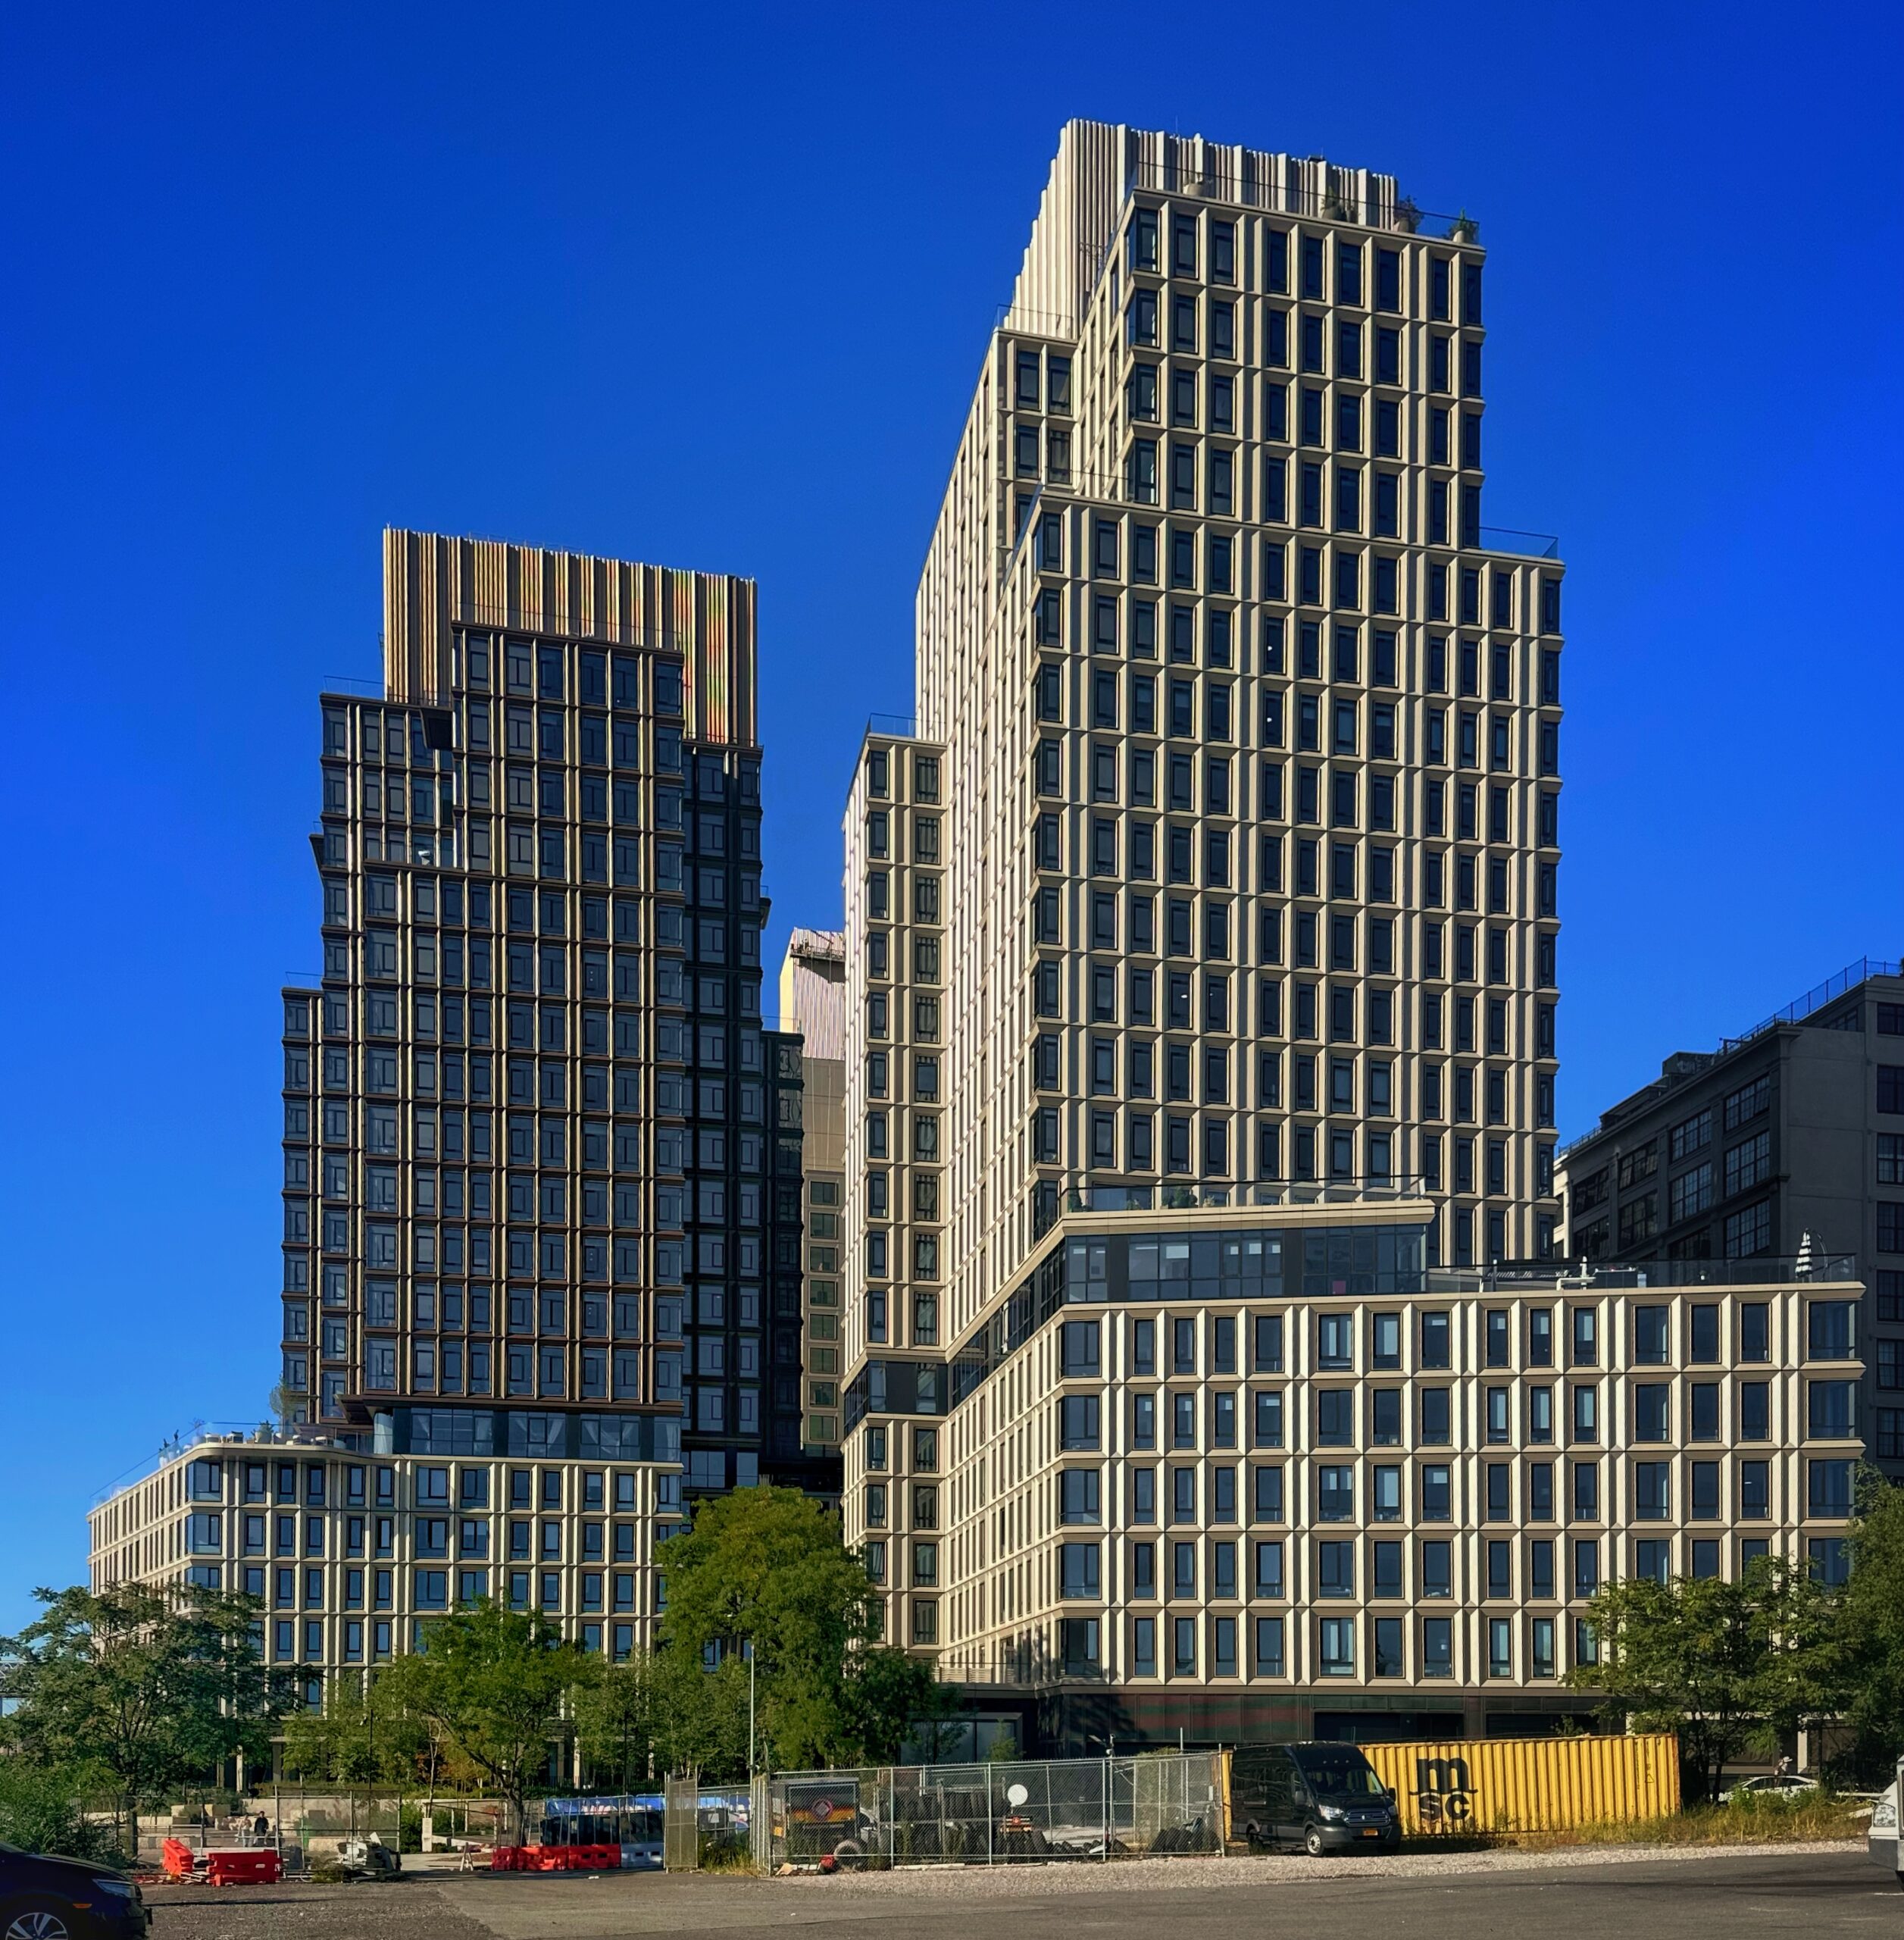
Williamsburg Wharf. Photo by Michael Young.
Williamsburg Wharf. Photo by Michael Young.
Williamsburg Wharf. Photo by Michael Young.
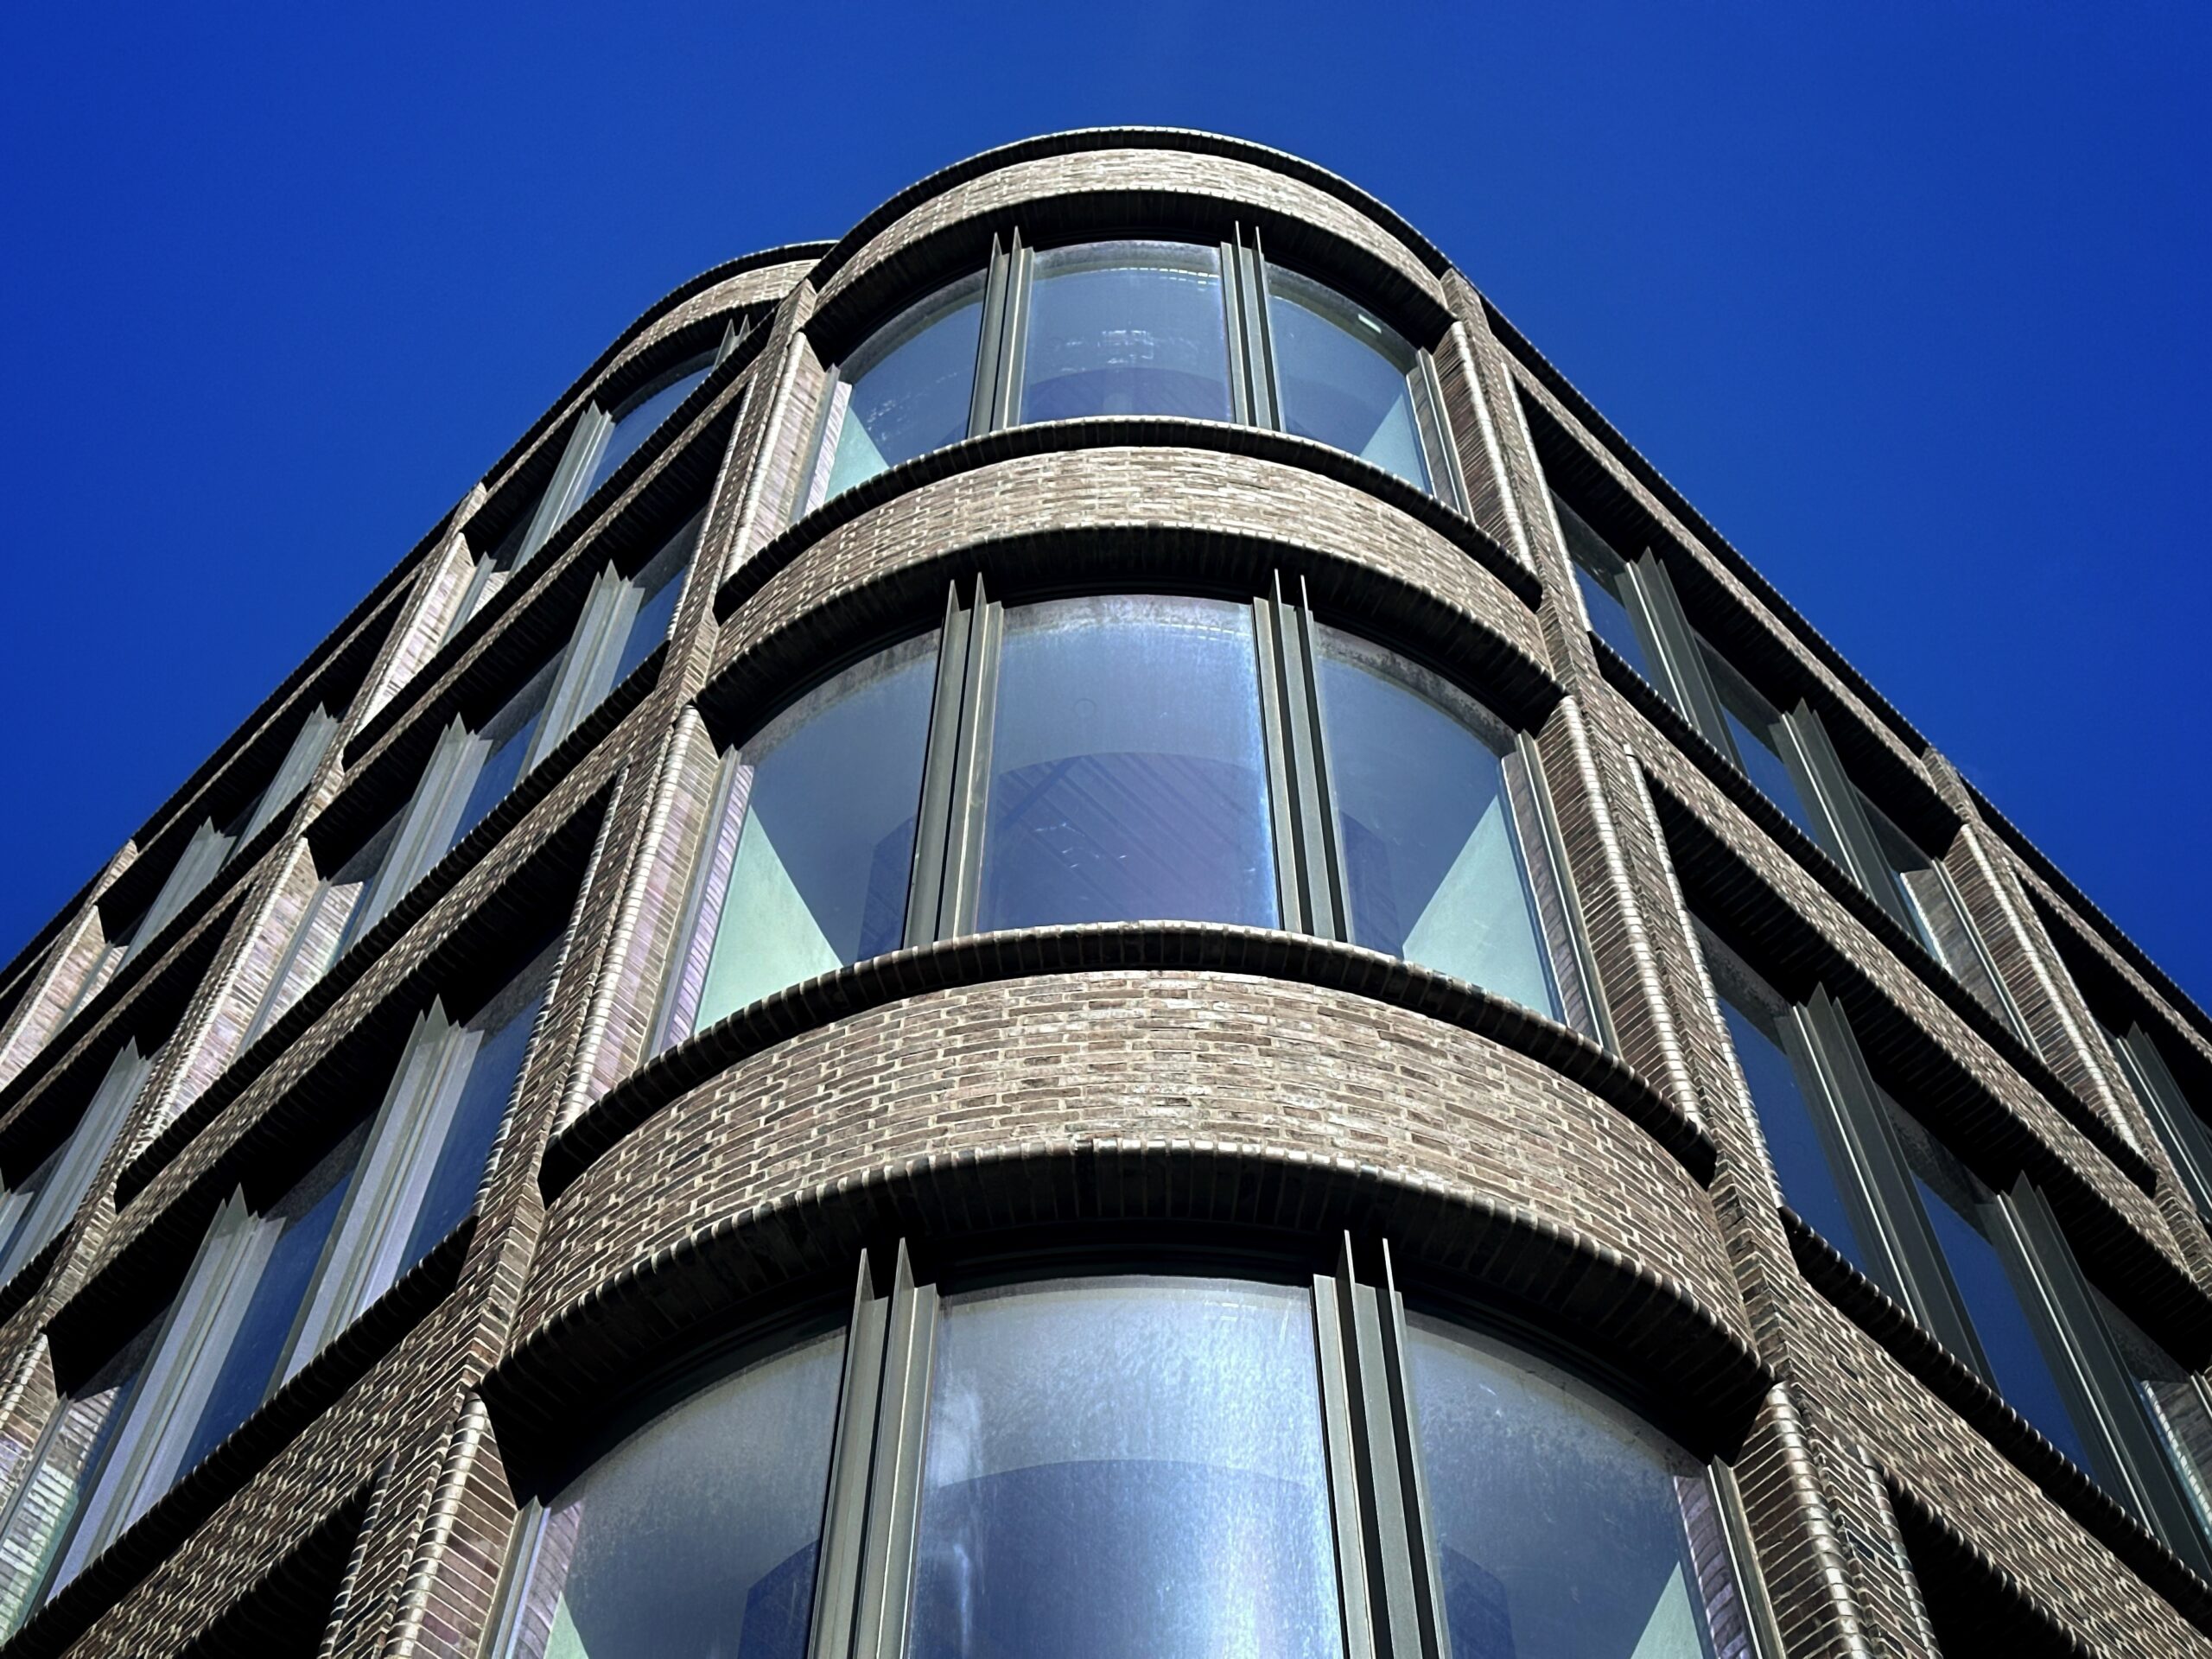
3 St. Mark’s Place. Photo by Michael Young.
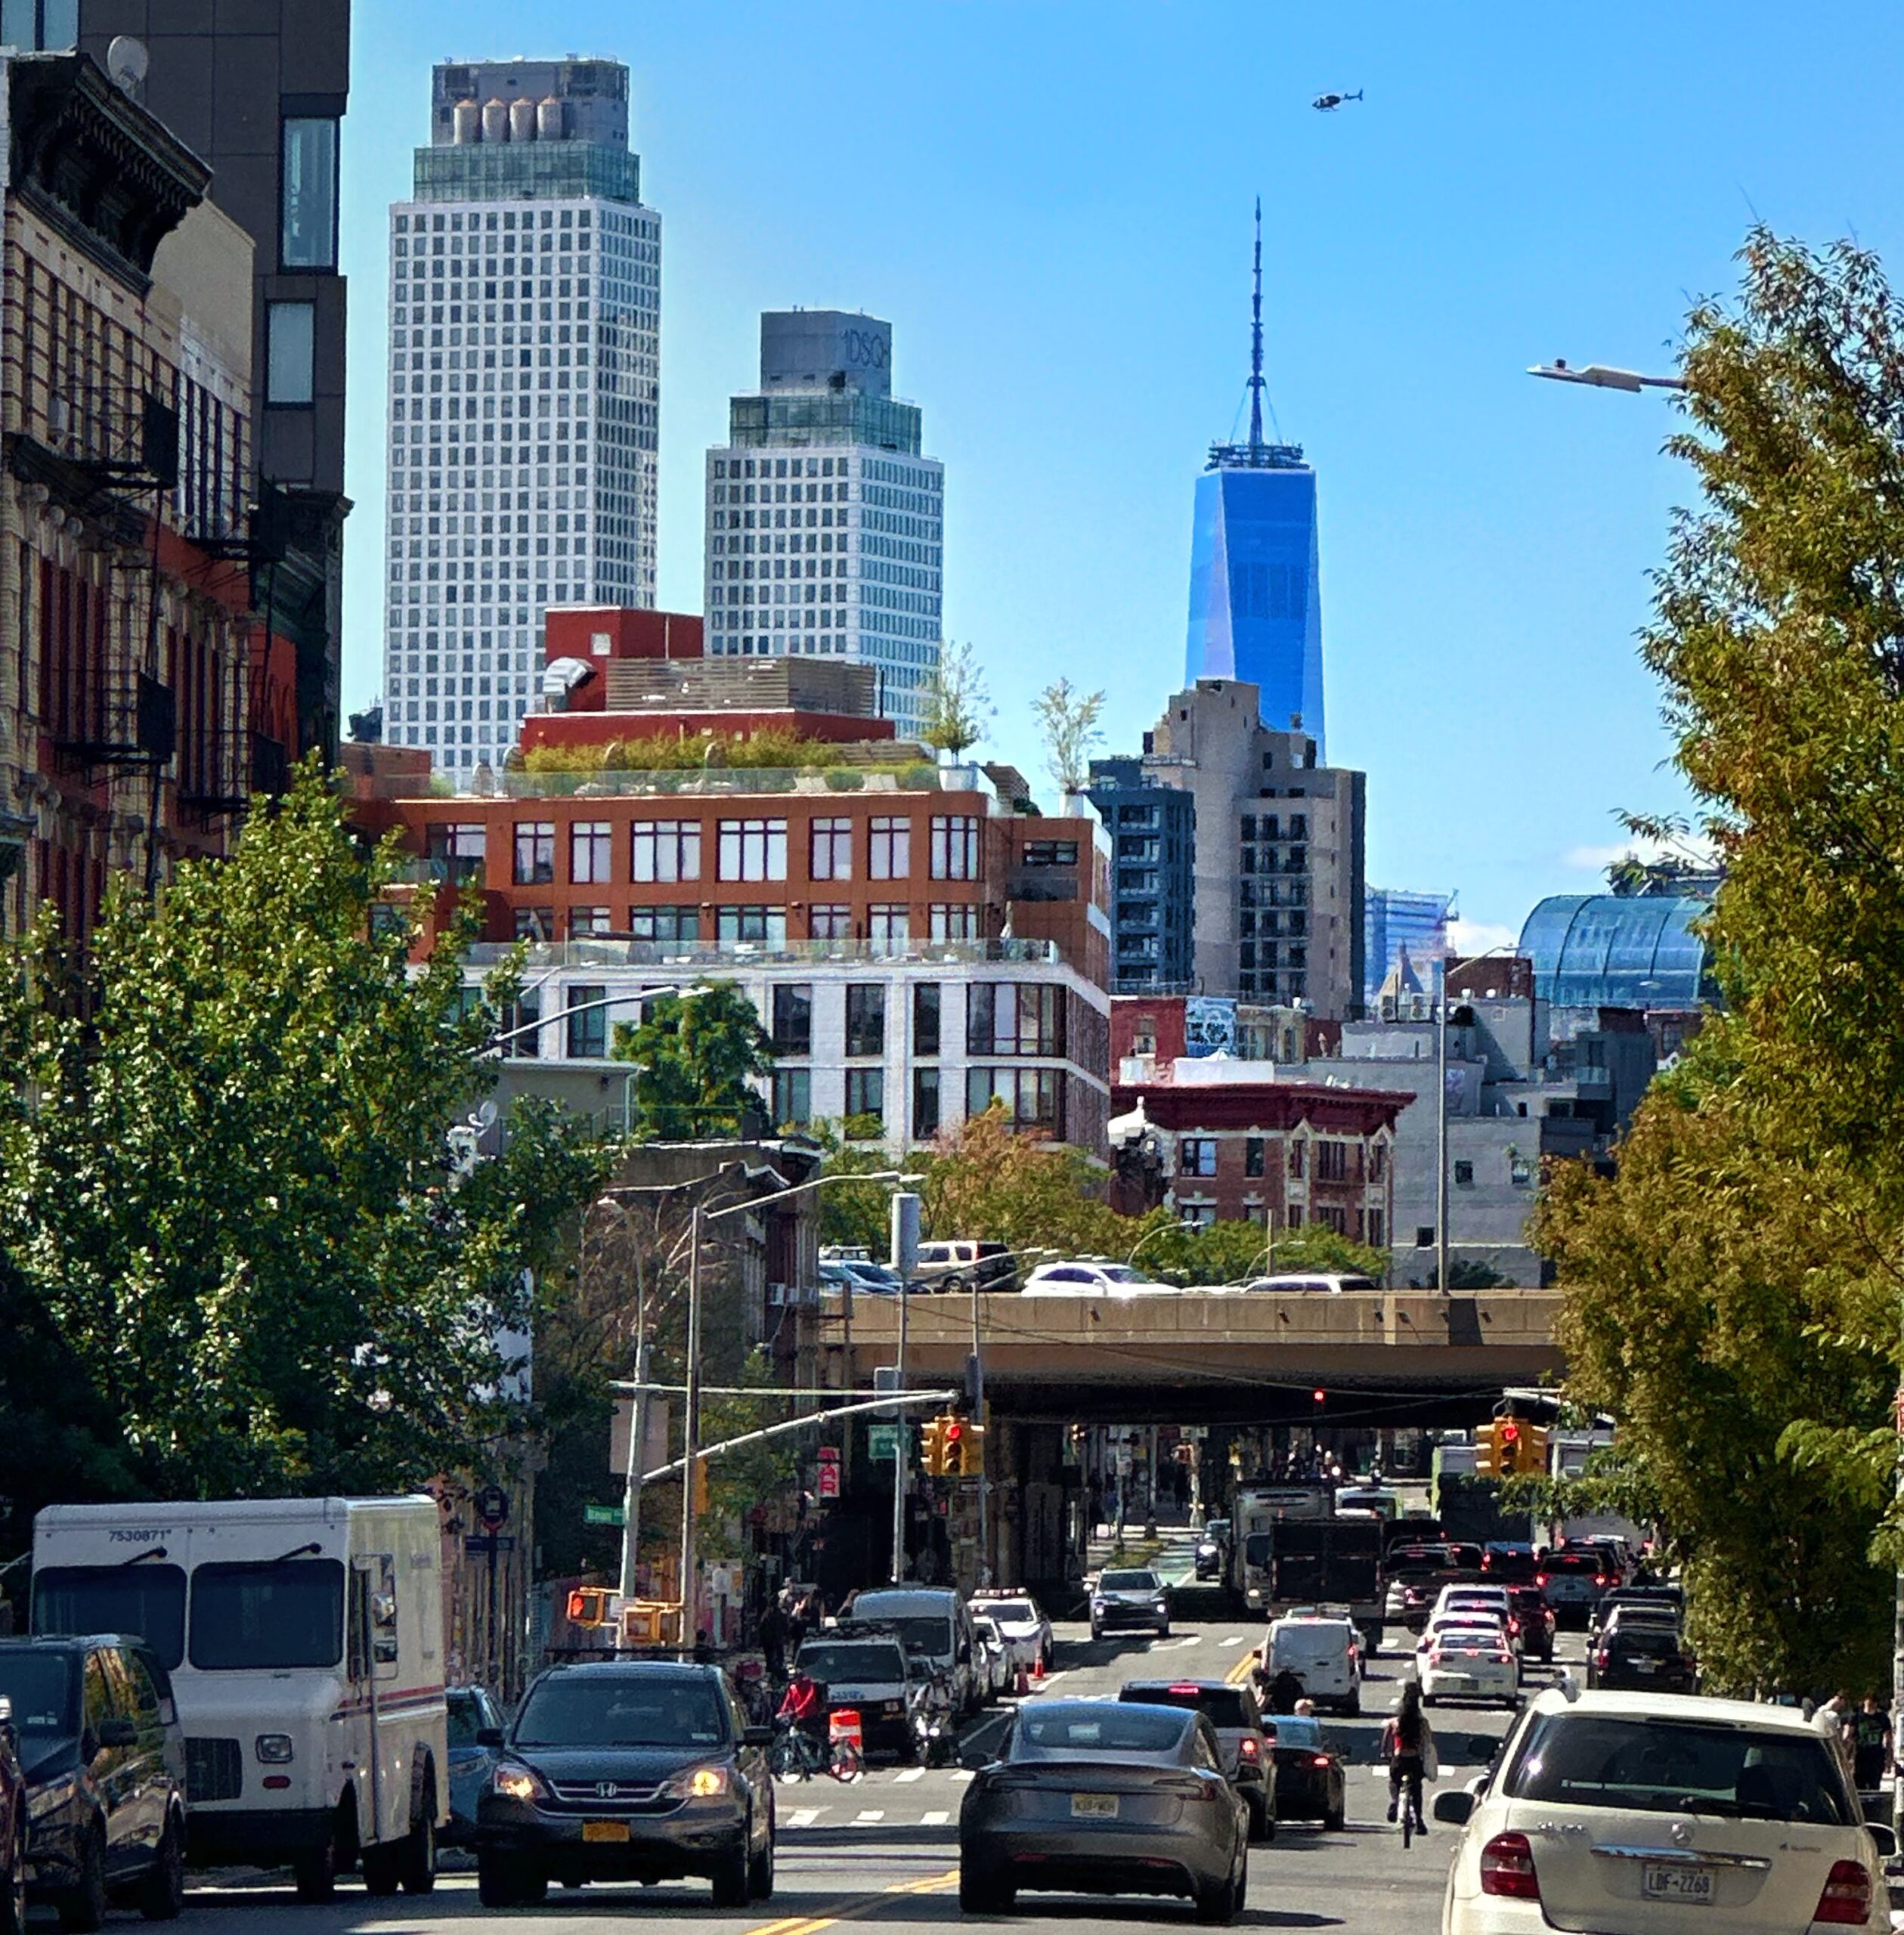
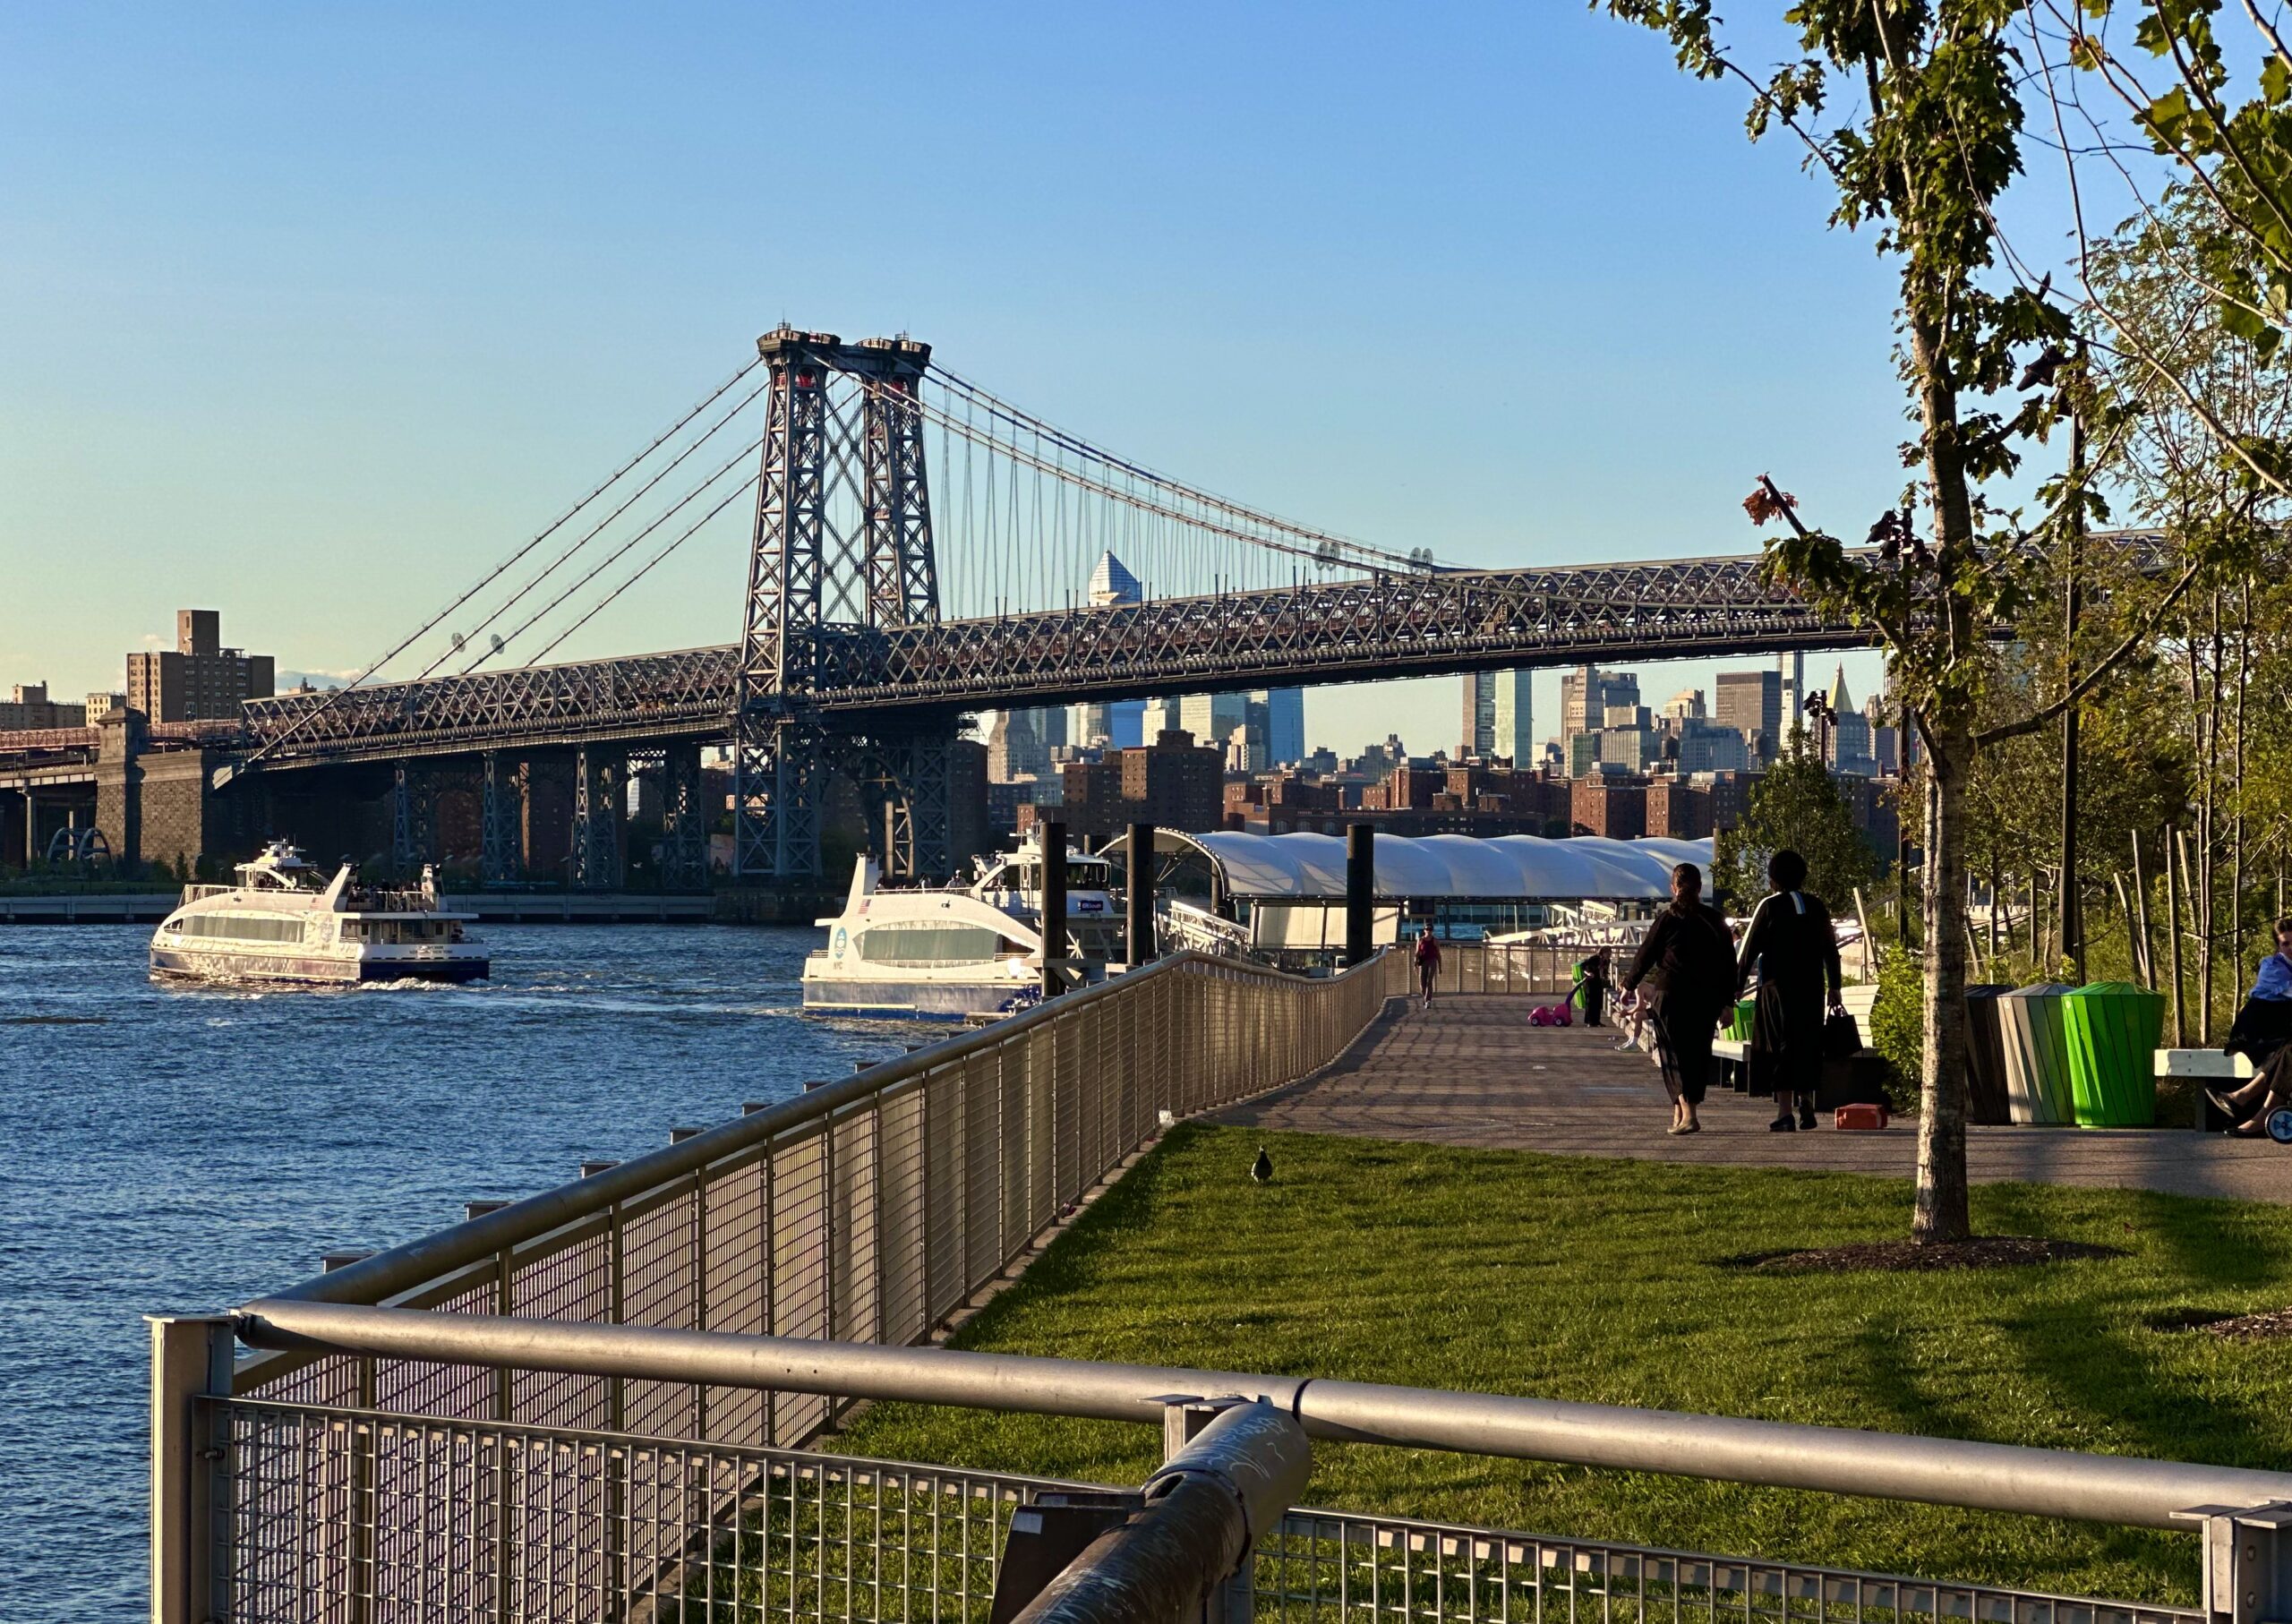
Williamsburg, Brooklyn. Photo by Michael Young.
7 Platt Street. Photo by Michael Young.
7 Platt Street. Photo by Michael Young.
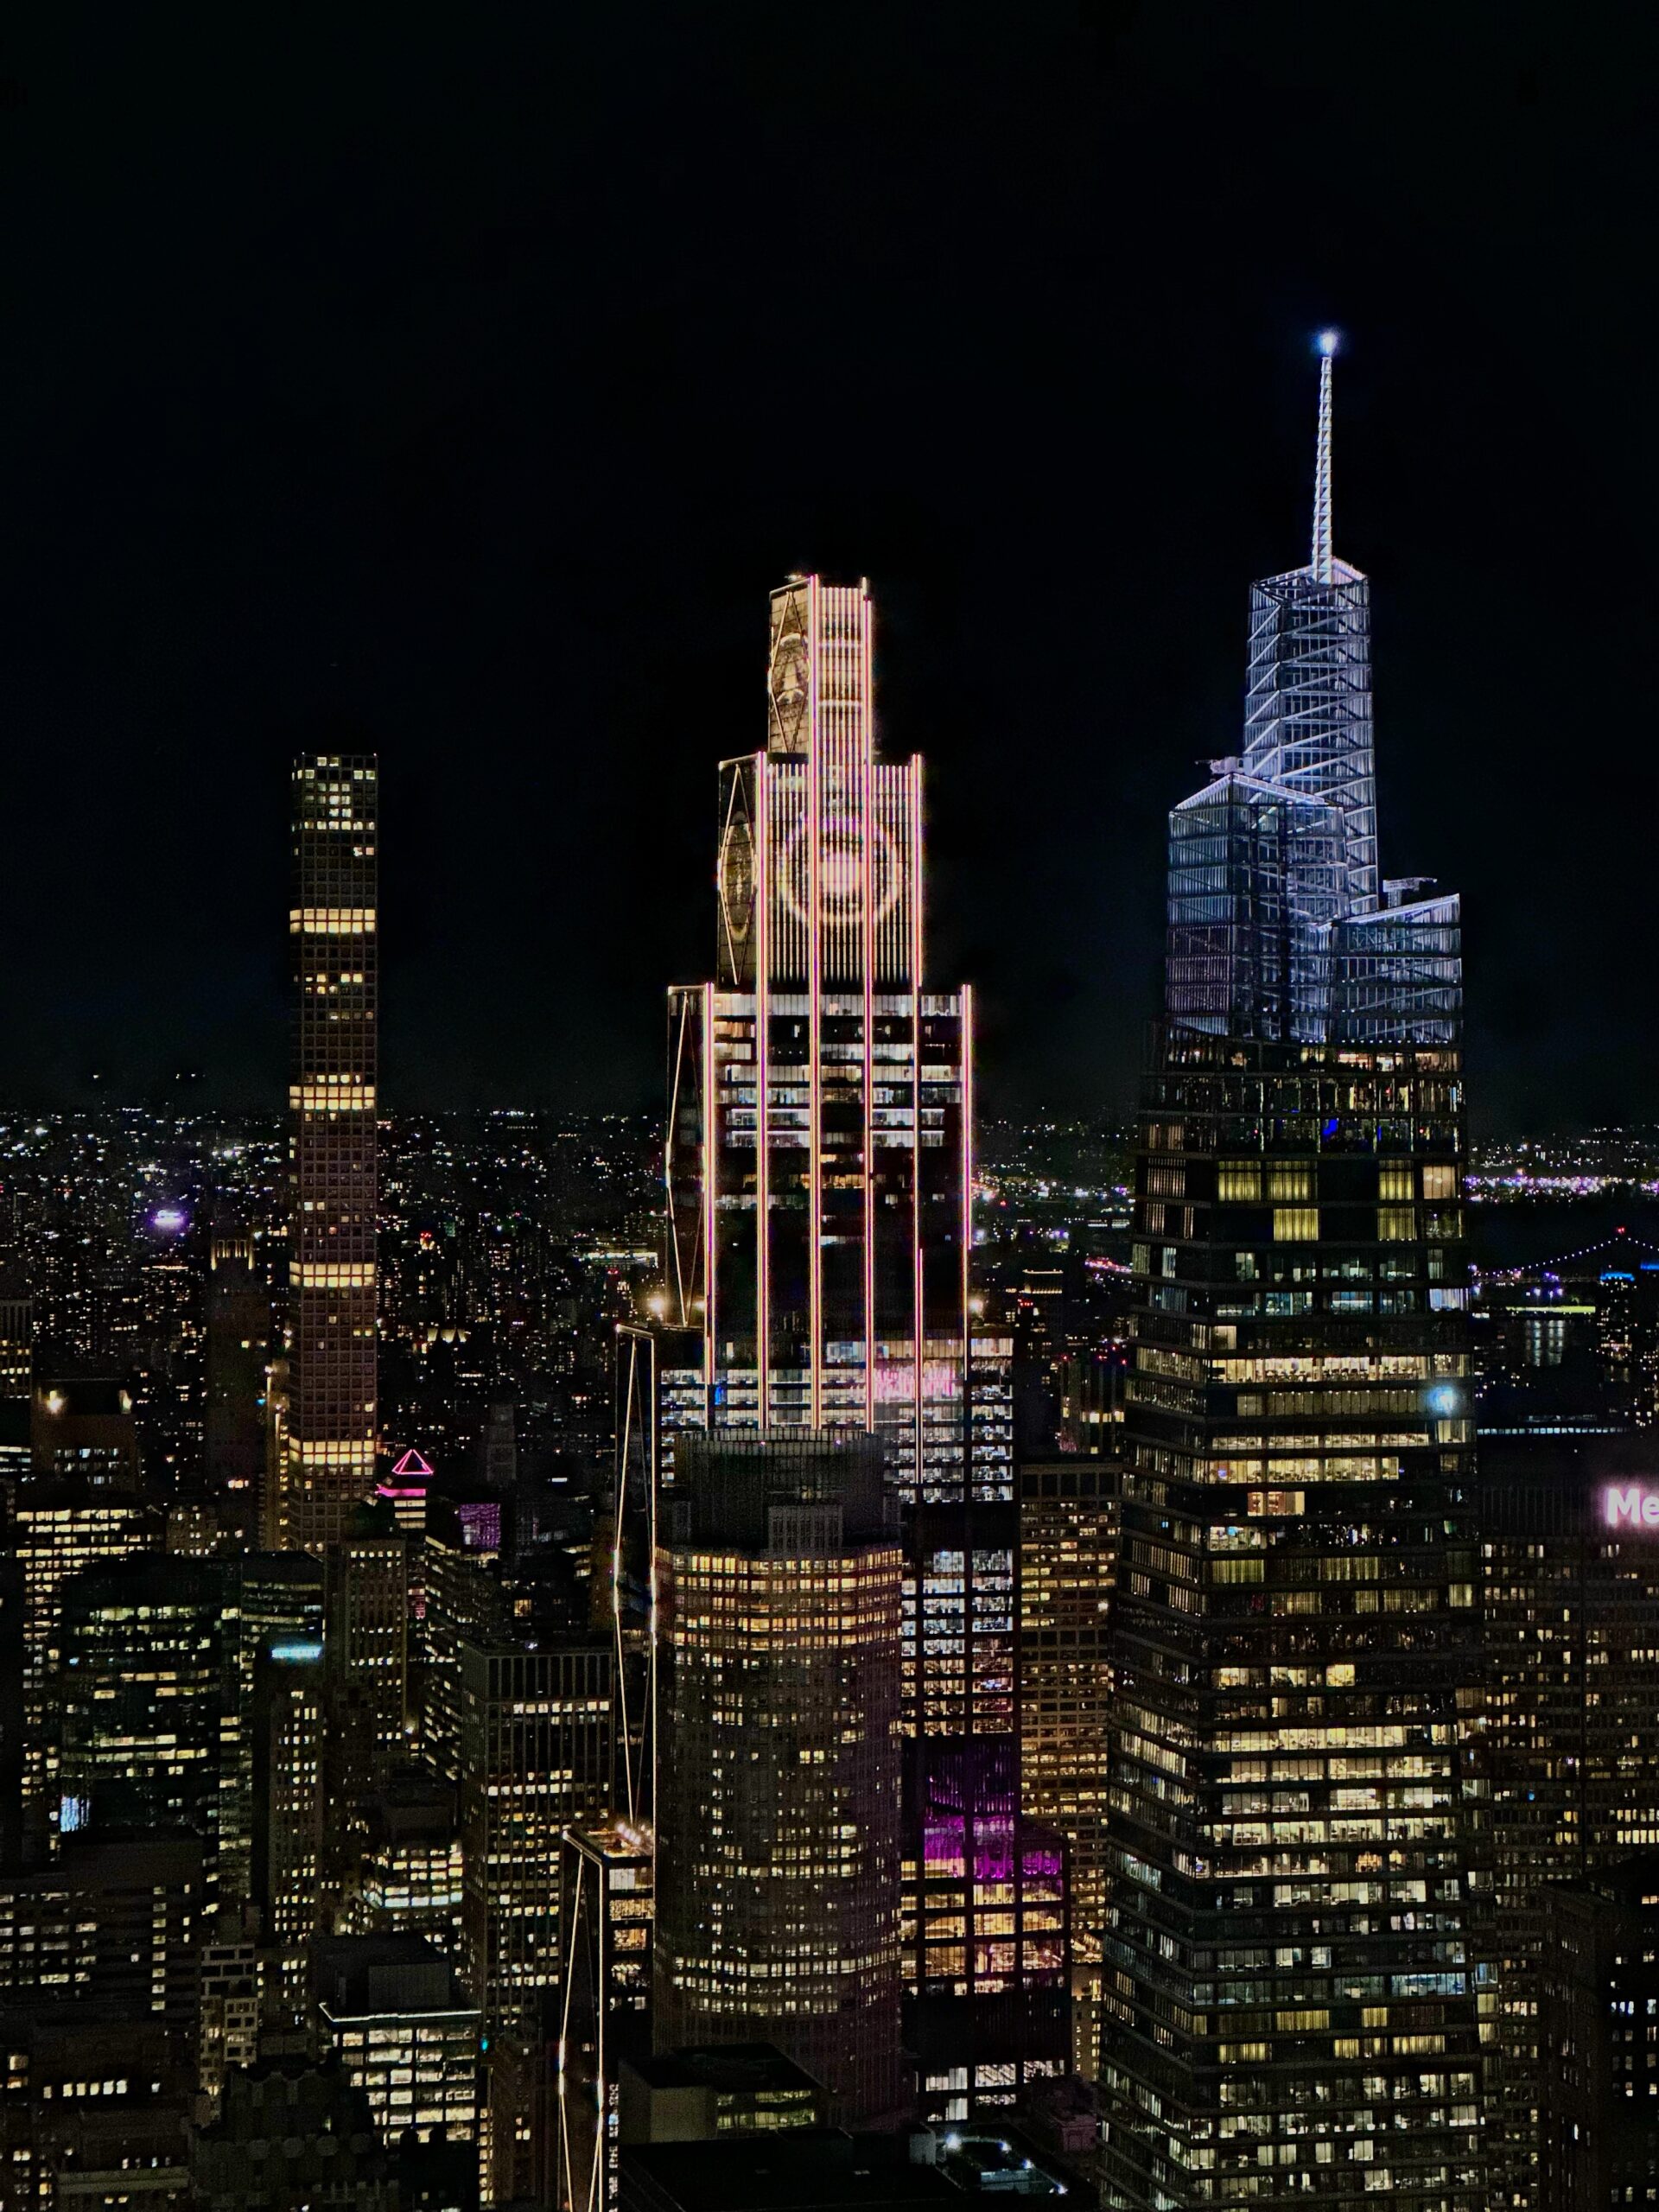
270 Park Avenue. Photo by Michael Young.
Subscribe to YIMBY’s daily e-mail
![]()
Follow YIMBYgram for real-time photo updates
Like YIMBY on Facebook
Follow YIMBY’s Twitter for the latest in YIMBYnews
New York on a building boom.
Excellent photos, as always.
Brooklyn, with the same population as Chicago, is again the leader. The Bronx is a nice surprise. Another surprise is all the 2-family projects and it would be interesting to see some photos of these new projects when finished.
Thank you, Michael Young — as always!
30+ years of building boom…
just not enough