
New York YIMBY has tallied the records for new building permit filings for the first quarter of 2024, and the results are one for the record books. According to data compiled from permit filings submitted to the Department of Buildings, during the three-month period from January through March, builders throughout the city filed a combined total of 19,819 residential and hotel units, the highest total for any three-month period since YIMBY started tracking the statistic in 2020. Similarly, the combined filed-for square footage of 26 million is also the highest quarterly tally for the decade so far.
Of the 1,044 new building permits, 57 were filed for high-rise buildings standing ten stories and higher, which will boost the skyline and contribute much-needed density in some of the city’s most pedestrian-friendly, transit-oriented communities. Below we break down the data via a series of charts and analyses that track the city’s development trends during the year’s first quarter.
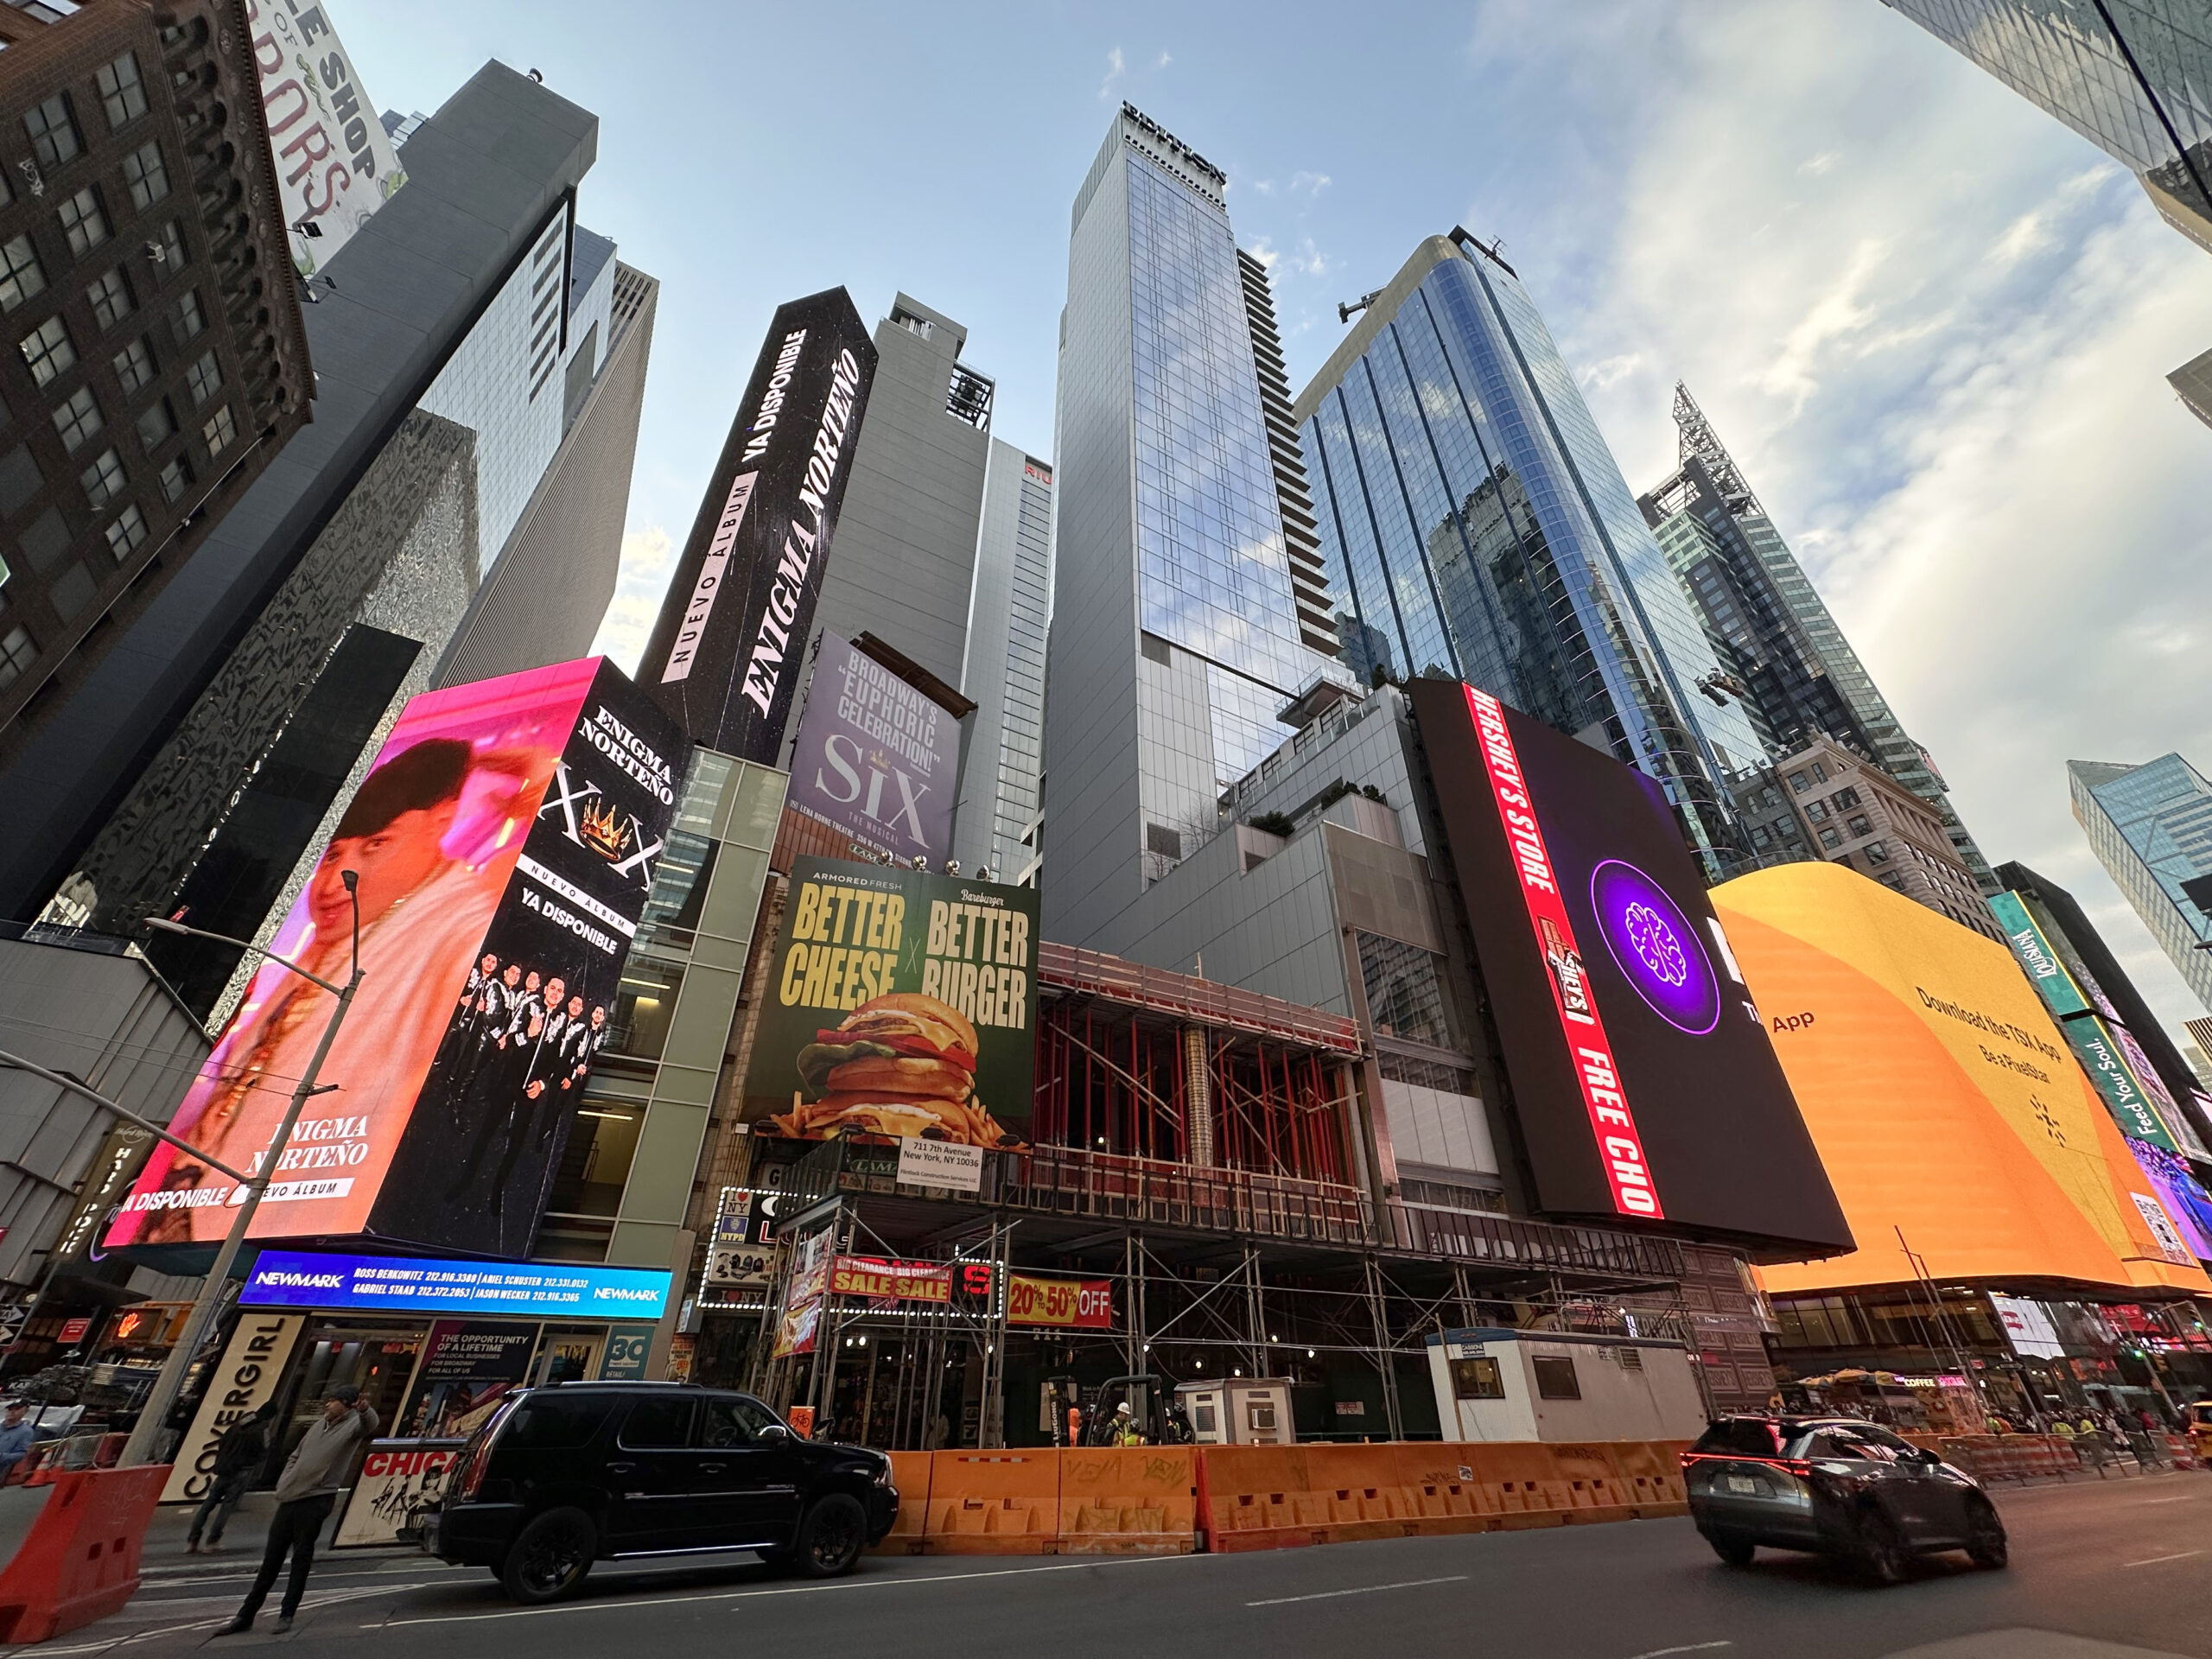
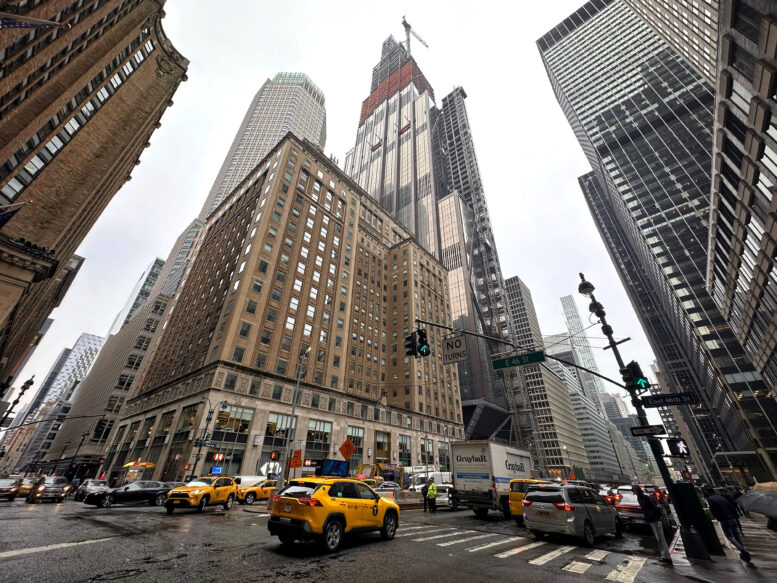
Photo by Michael Young
Number of permit filings per month
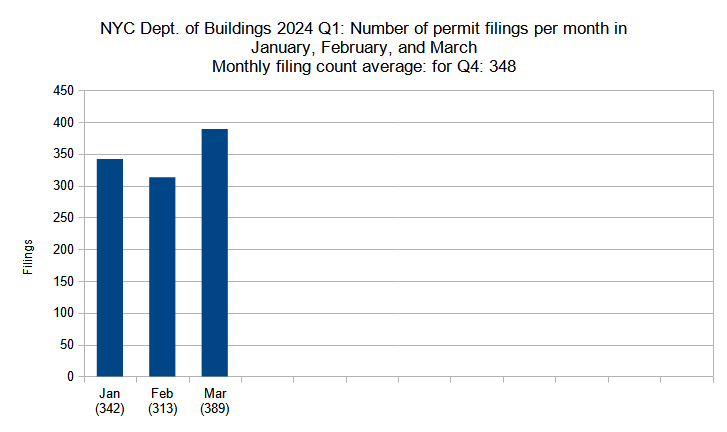
Number of new construction permits filed per month in New York City in Q1 (January through March) 2024. Data source: the Department of Buildings. Data aggregation and graphics credit: Vitali Ogorodnikov
The third quarter of 2023 saw a record-setting average of 345 new building permit filings in New York City per month in July, August, and September. The following three months (Q4 2023) further shattered the record with an astounding monthly average of 507 permits, with 794 permits filed in December alone.
While the first-quarter average for 2024 fell well below the previous quarter outlier, its total of 348 new building filings still slightly surpassed the 2023 Q3 total to rank as the second-highest quarterly average since YIMBY started keeping tally in 2020. With a total of 389 filings, March 2024 holds the third-highest monthly count since YIMBY began keeping track, reflecting the enduring strength of the city’s construction and real estate industries.
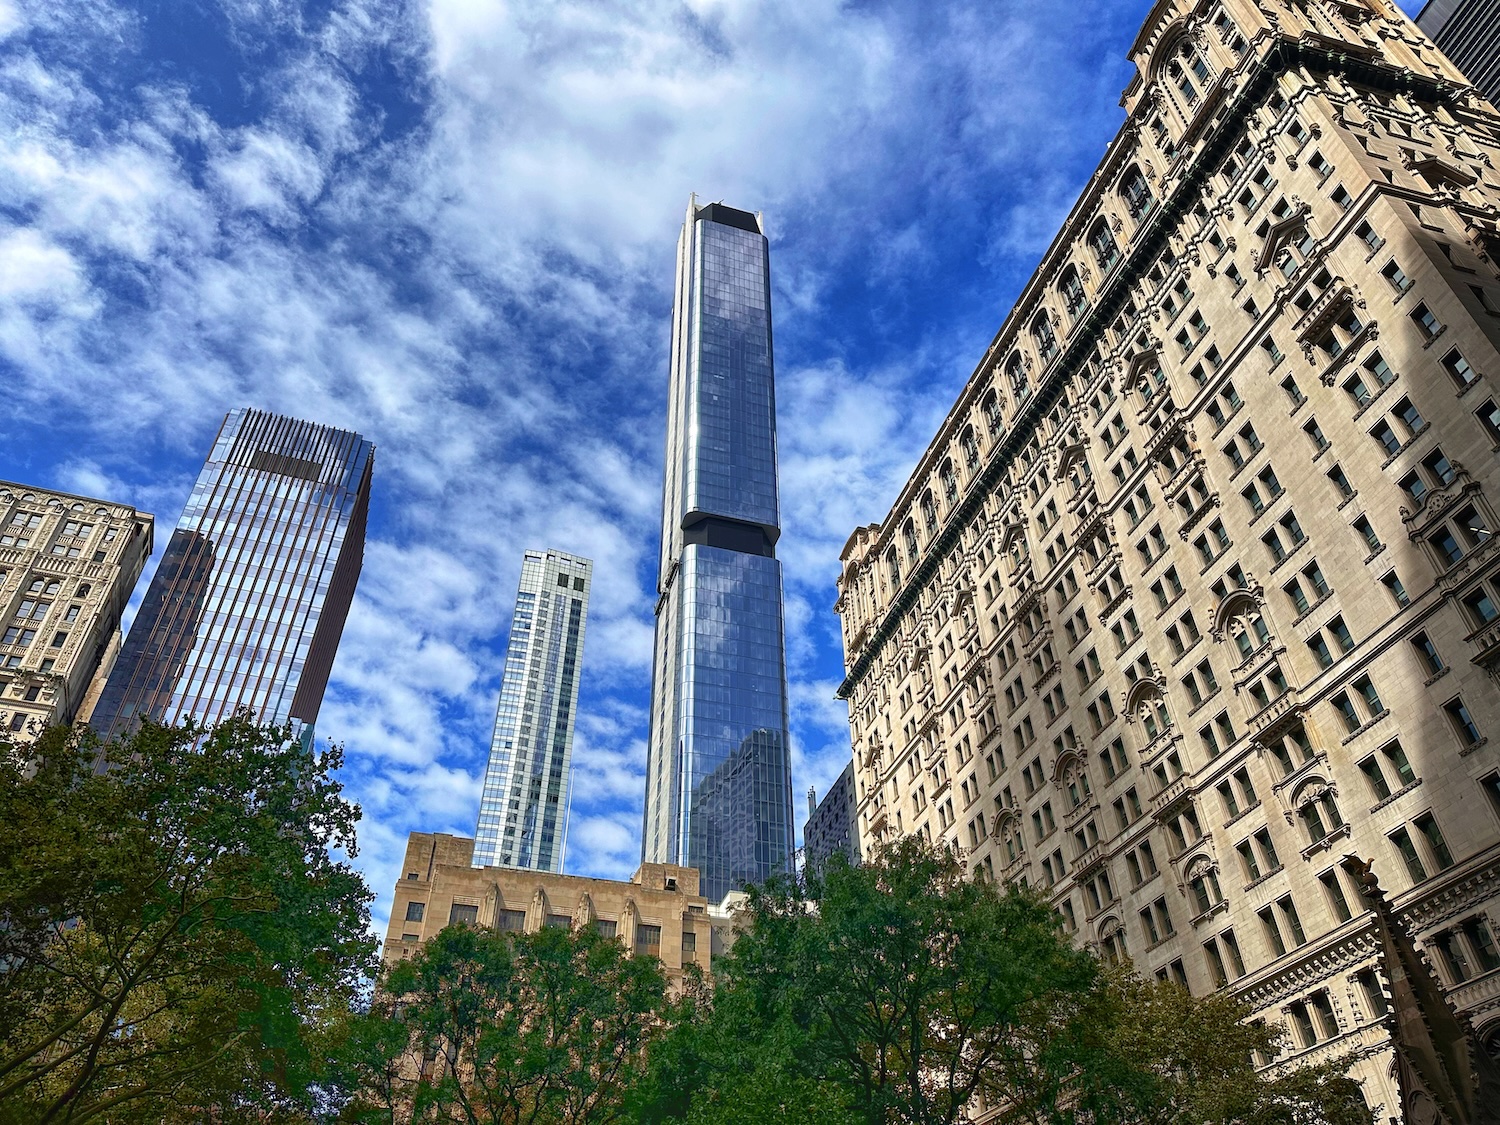
Photograph of The Greenwich from street level, by Michael Young
Number of permit filings by borough
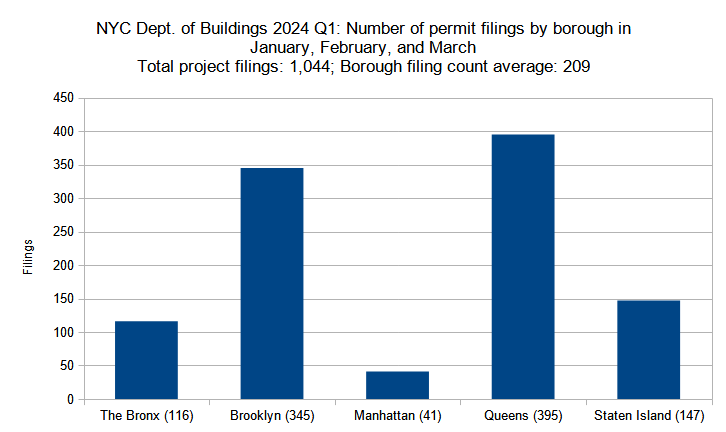
Number of new construction permits filed per borough in New York City in Q1 (January through March) 2024. Data source: the Department of Buildings. Data aggregation and graphics credit: Vitali Ogorodnikov
As expected, the first quarter generally saw fewer filings in more densely populated boroughs, such as Manhattan and The Bronx, where individual projects tend to be less numerous yet much larger in scale. Below is the breakdown of borough statistic changes from Q4 2023 to Q1 2024.
- The Bronx: 12-percent increase (104 to 116 permits)
- Brooklyn: 6-percent increase (325 to 345)
- Manhattan: 3-percent increase (40 to 41)
- Queens: 11-percent increase (357 to 395)
- Staten Island: 79-percent decrease (695 to 147)
Almost every borough saw increases in new building permit filings, from 3 percent (Manhattan) to 12 percent (The Bronx). The most precipitous drop took place in Staten Island, where the total plummeted by 79 percent from 695 permits in Q4 2023 to just 147 permits in Q1 2024. This singular decrease is responsible for the borough filing count average dropping by almost a hundred, from 304 down to 209.

Photo by Michael Young
Permits listed by unit count per filing
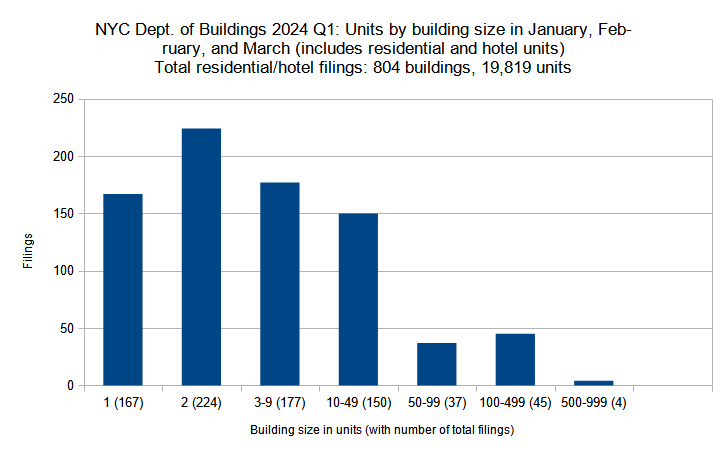
New residential and hotel construction permits filed in New York City in Q1 (January through March) 2024 grouped by unit count per filling. Data source: the Department of Buildings. Data aggregation and graphics credit: Vitali Ogorodnikov
Since Staten Island is almost exclusively comprised of small-scale residential development, the borough’s drop in new building filings is generally responsible for a corresponding significant lowering of single- and two-family permits. Between the two quarters, each category dropped by half of more.
In contrast, filing counts for every category with three or more dwellings have increased. Notably, the two largest categories saw significant increases, with filings for buildings with 100 to 499 units rising from 36 to 45 and for buildings with 500 to 999 units growing from one to four, which bodes well for increasing the city’s supply of new housing.
Below, the filing size categories are compared between Q4 2023 and Q1 2024 individually:
- Single-family: 65-percent decrease (482 to 167 units)
- Two-family: 49-percent decrease (442 to 224)
- Three to nine units: 3-percent increase (172 to 177)
- Ten to 49 units: 19-percent increase (126 to 150)
- 50 to 99 units: 3-percent increase (36 to 37)
- 100 to 499 units: 25-percent increase (36 to 45)
- 500 to 599 units: 400-percent increase (1 to 4)
Below are the top five Q1 projects with the highest unit counts per filing:
- 589 Fulton Street in Downtown Brooklyn (591 units)
- 126-43 39th Avenue in Willets Point, Queens (534 units)
- 94-15 Sutphin Boulevard in Jamaica, Queens (524 units)
- 147-35 95th Avenue in Jamaica, Queens (521 units)
- 1440 Amsterdam Avenue in Manhattanville in Manhattan (490 units)
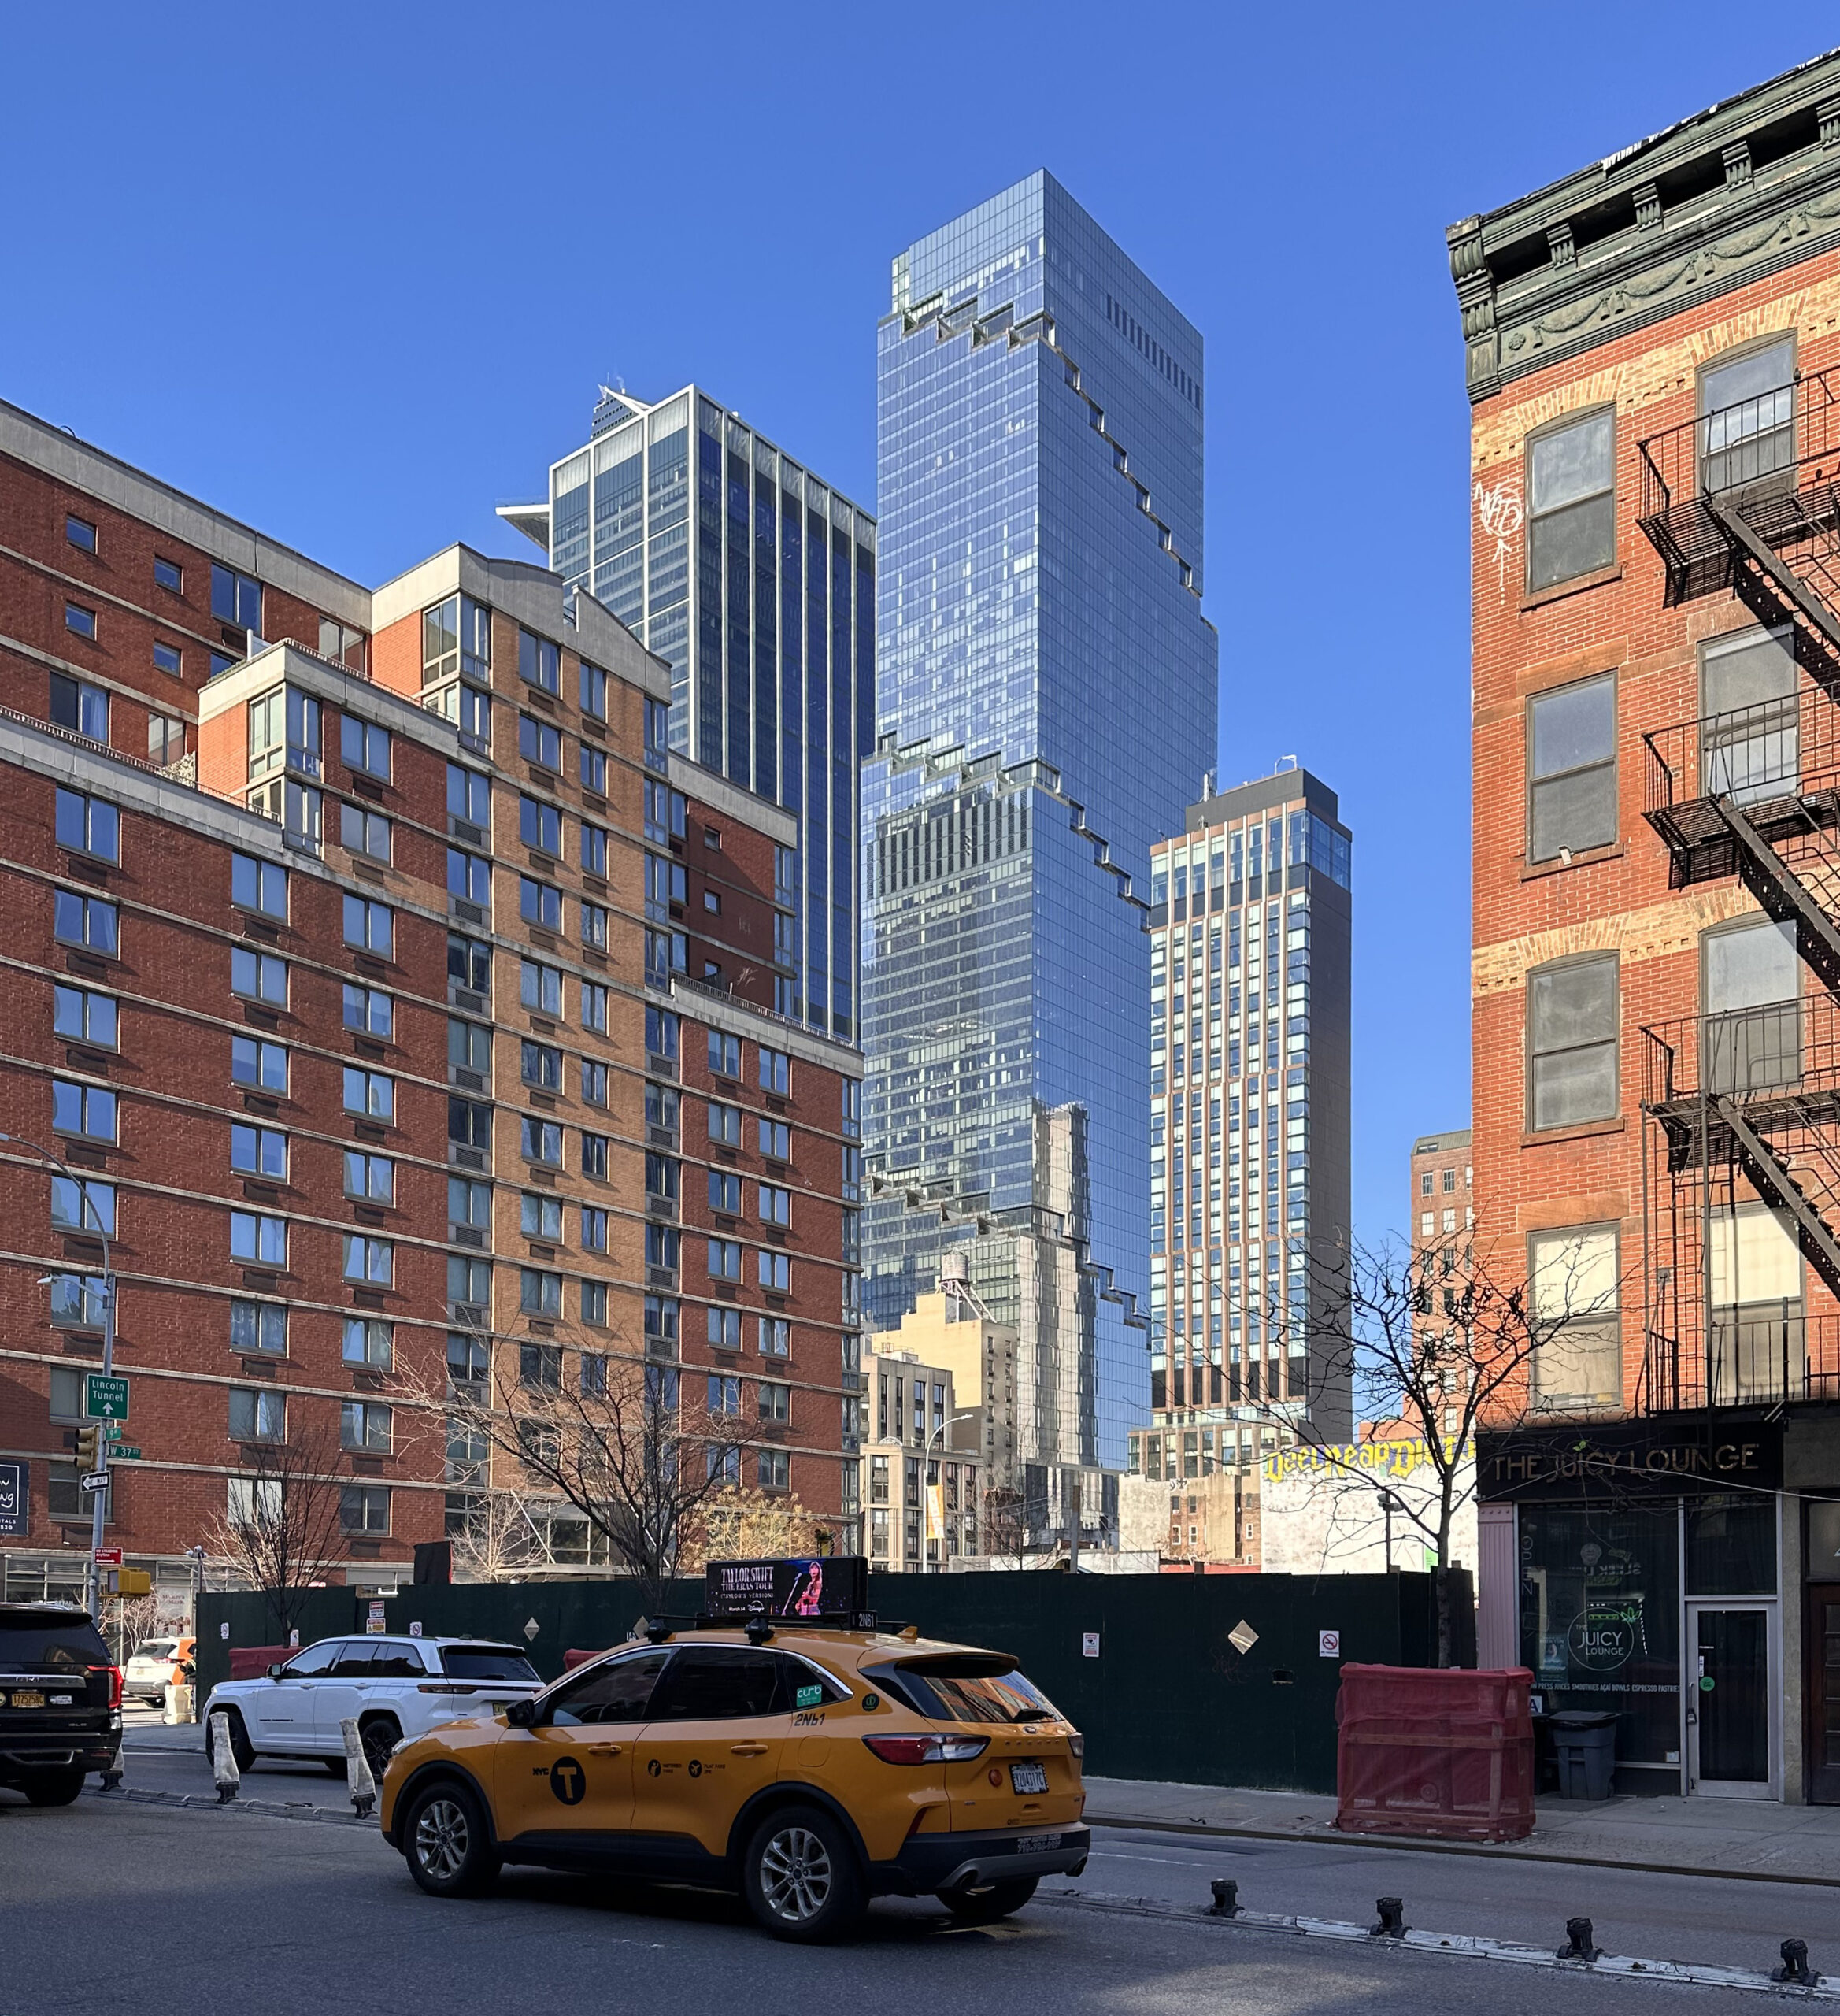
Photo by Michael Young
Residential and hotel units filed per borough
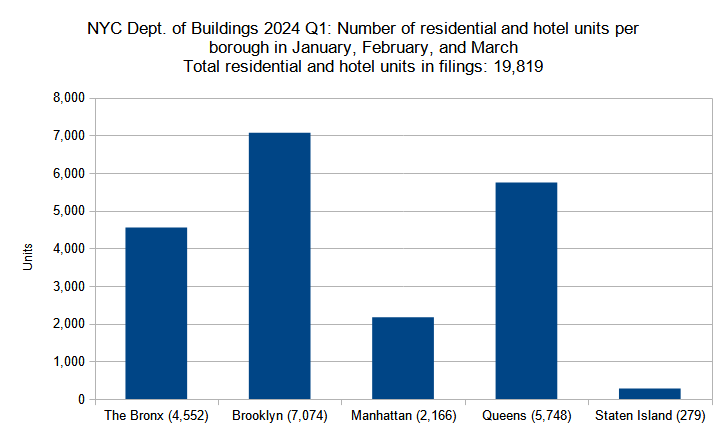
Number of residential and hotel units in new construction permits filed per borough in New York City in Q1 (January through March) 2024. Data source: the Department of Buildings. Data aggregation and graphics credit: Vitali Ogorodnikov
While the number of permits filed in the first quarter of 2024 dropped from the previous total, an inverse change took place among the number of filed-for residential and hotel units, which grew by 21 percent, from 16,396 in Q4 2023 to 19,819 in Q1 2024.
Below is a by-borough comparison between the two quarters:
- The Bronx: 6-percent decrease (4,845 to 4,552 residential and hotel units)
- Brooklyn: 36-percent increase (5,192 to 7,074)
- Manhattan: 24-percent increase (1,747 to 2,166)
- Queens: 75-percent increase (3,267 to 5,748)
- Staten Island: 79-percent decrease (1,345 to 279)
The Bronx observed slight, six-percent decrease, while Staten Island plummeted by 79 percent, losing more than 1,000 filed-for units in the process. However, the gains among Brooklyn, Manhattan, and Queens were more than enough to offset the losses, with Queens recording both the highest relative and absolute increases with a growth of 75 percent or 2,481 filed-for units.
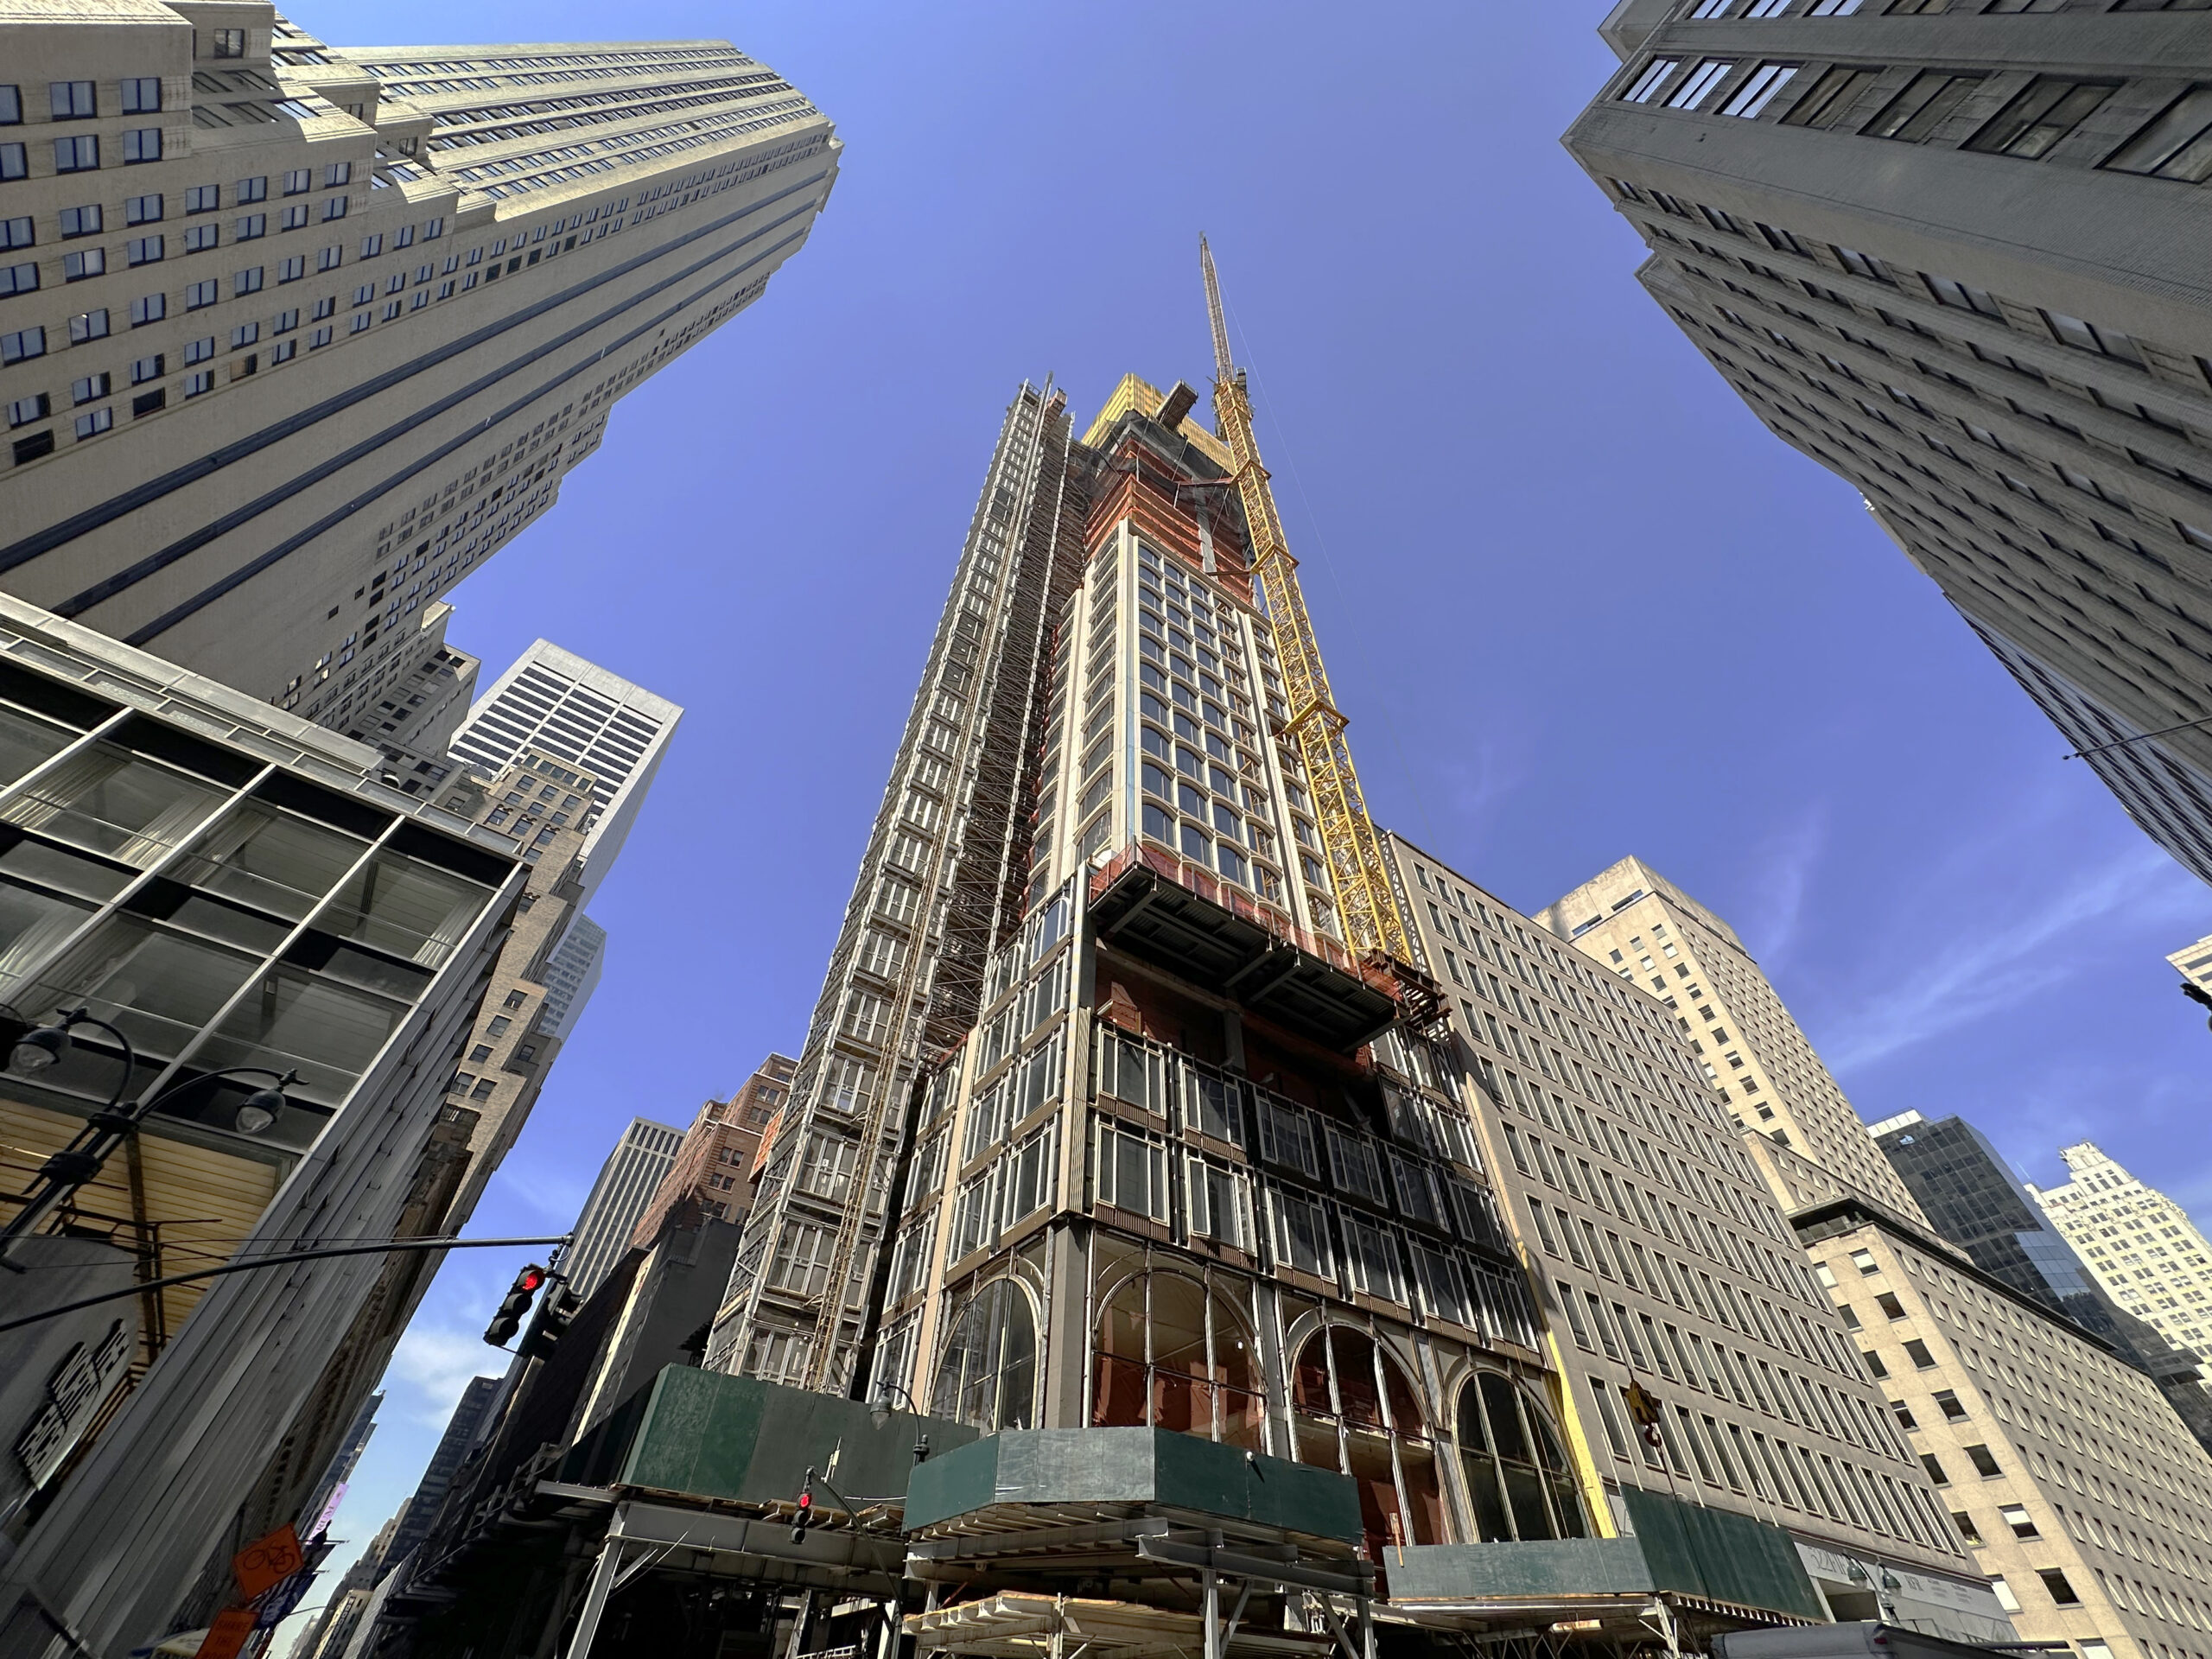
Photo by Michael Young
Permits listed by average unit count per filing
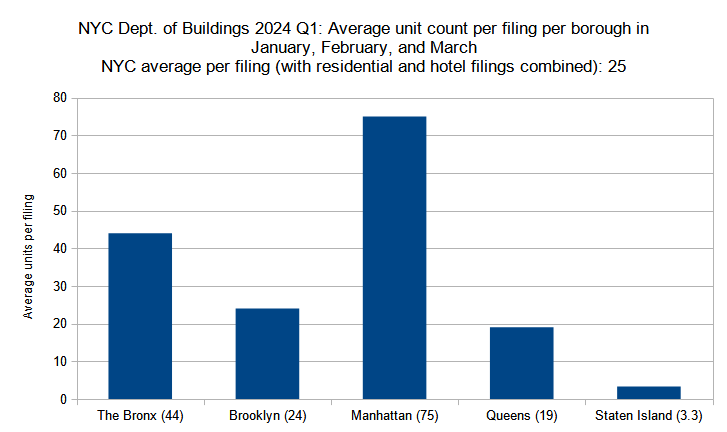
Average unit count (residential and hotel) per new construction permit per borough filed in New York City in Q1 (January through March) 2024. Data source: the Department of Buildings. Data aggregation and graphics credit: Vitali Ogorodnikov
Between the fourth quarter of 2023 and the first quarter of 2024, the total number of filed-for permits decreased while the total number of filed-for units grew. This correlation reflects the fact that the average filing now counts significantly more residential and hotel units than it did in the previous quarter, nearly doubling from an average of 13 in Q4 2023 to 25 in Q1 2024.
Below is a by-borough comparison between the two quarters:
- The Bronx: 14-percent decrease (51 to 44 residential and hotel units)
- Brooklyn: 26-percent increase (19 to 24)
- Manhattan: 50-percent increase (50 to 75)
- Queens: 58-percent increase (12 to 19)
- Staten Island: 50-percent increase (2.2 to 3.3)
During the period, only The Bronx noted a decrease in average filing unit count, dropping by 14 percent. The other four boroughs registered significant increases, ranging from 26 percent (Brooklyn) to 58 percent (Queens).
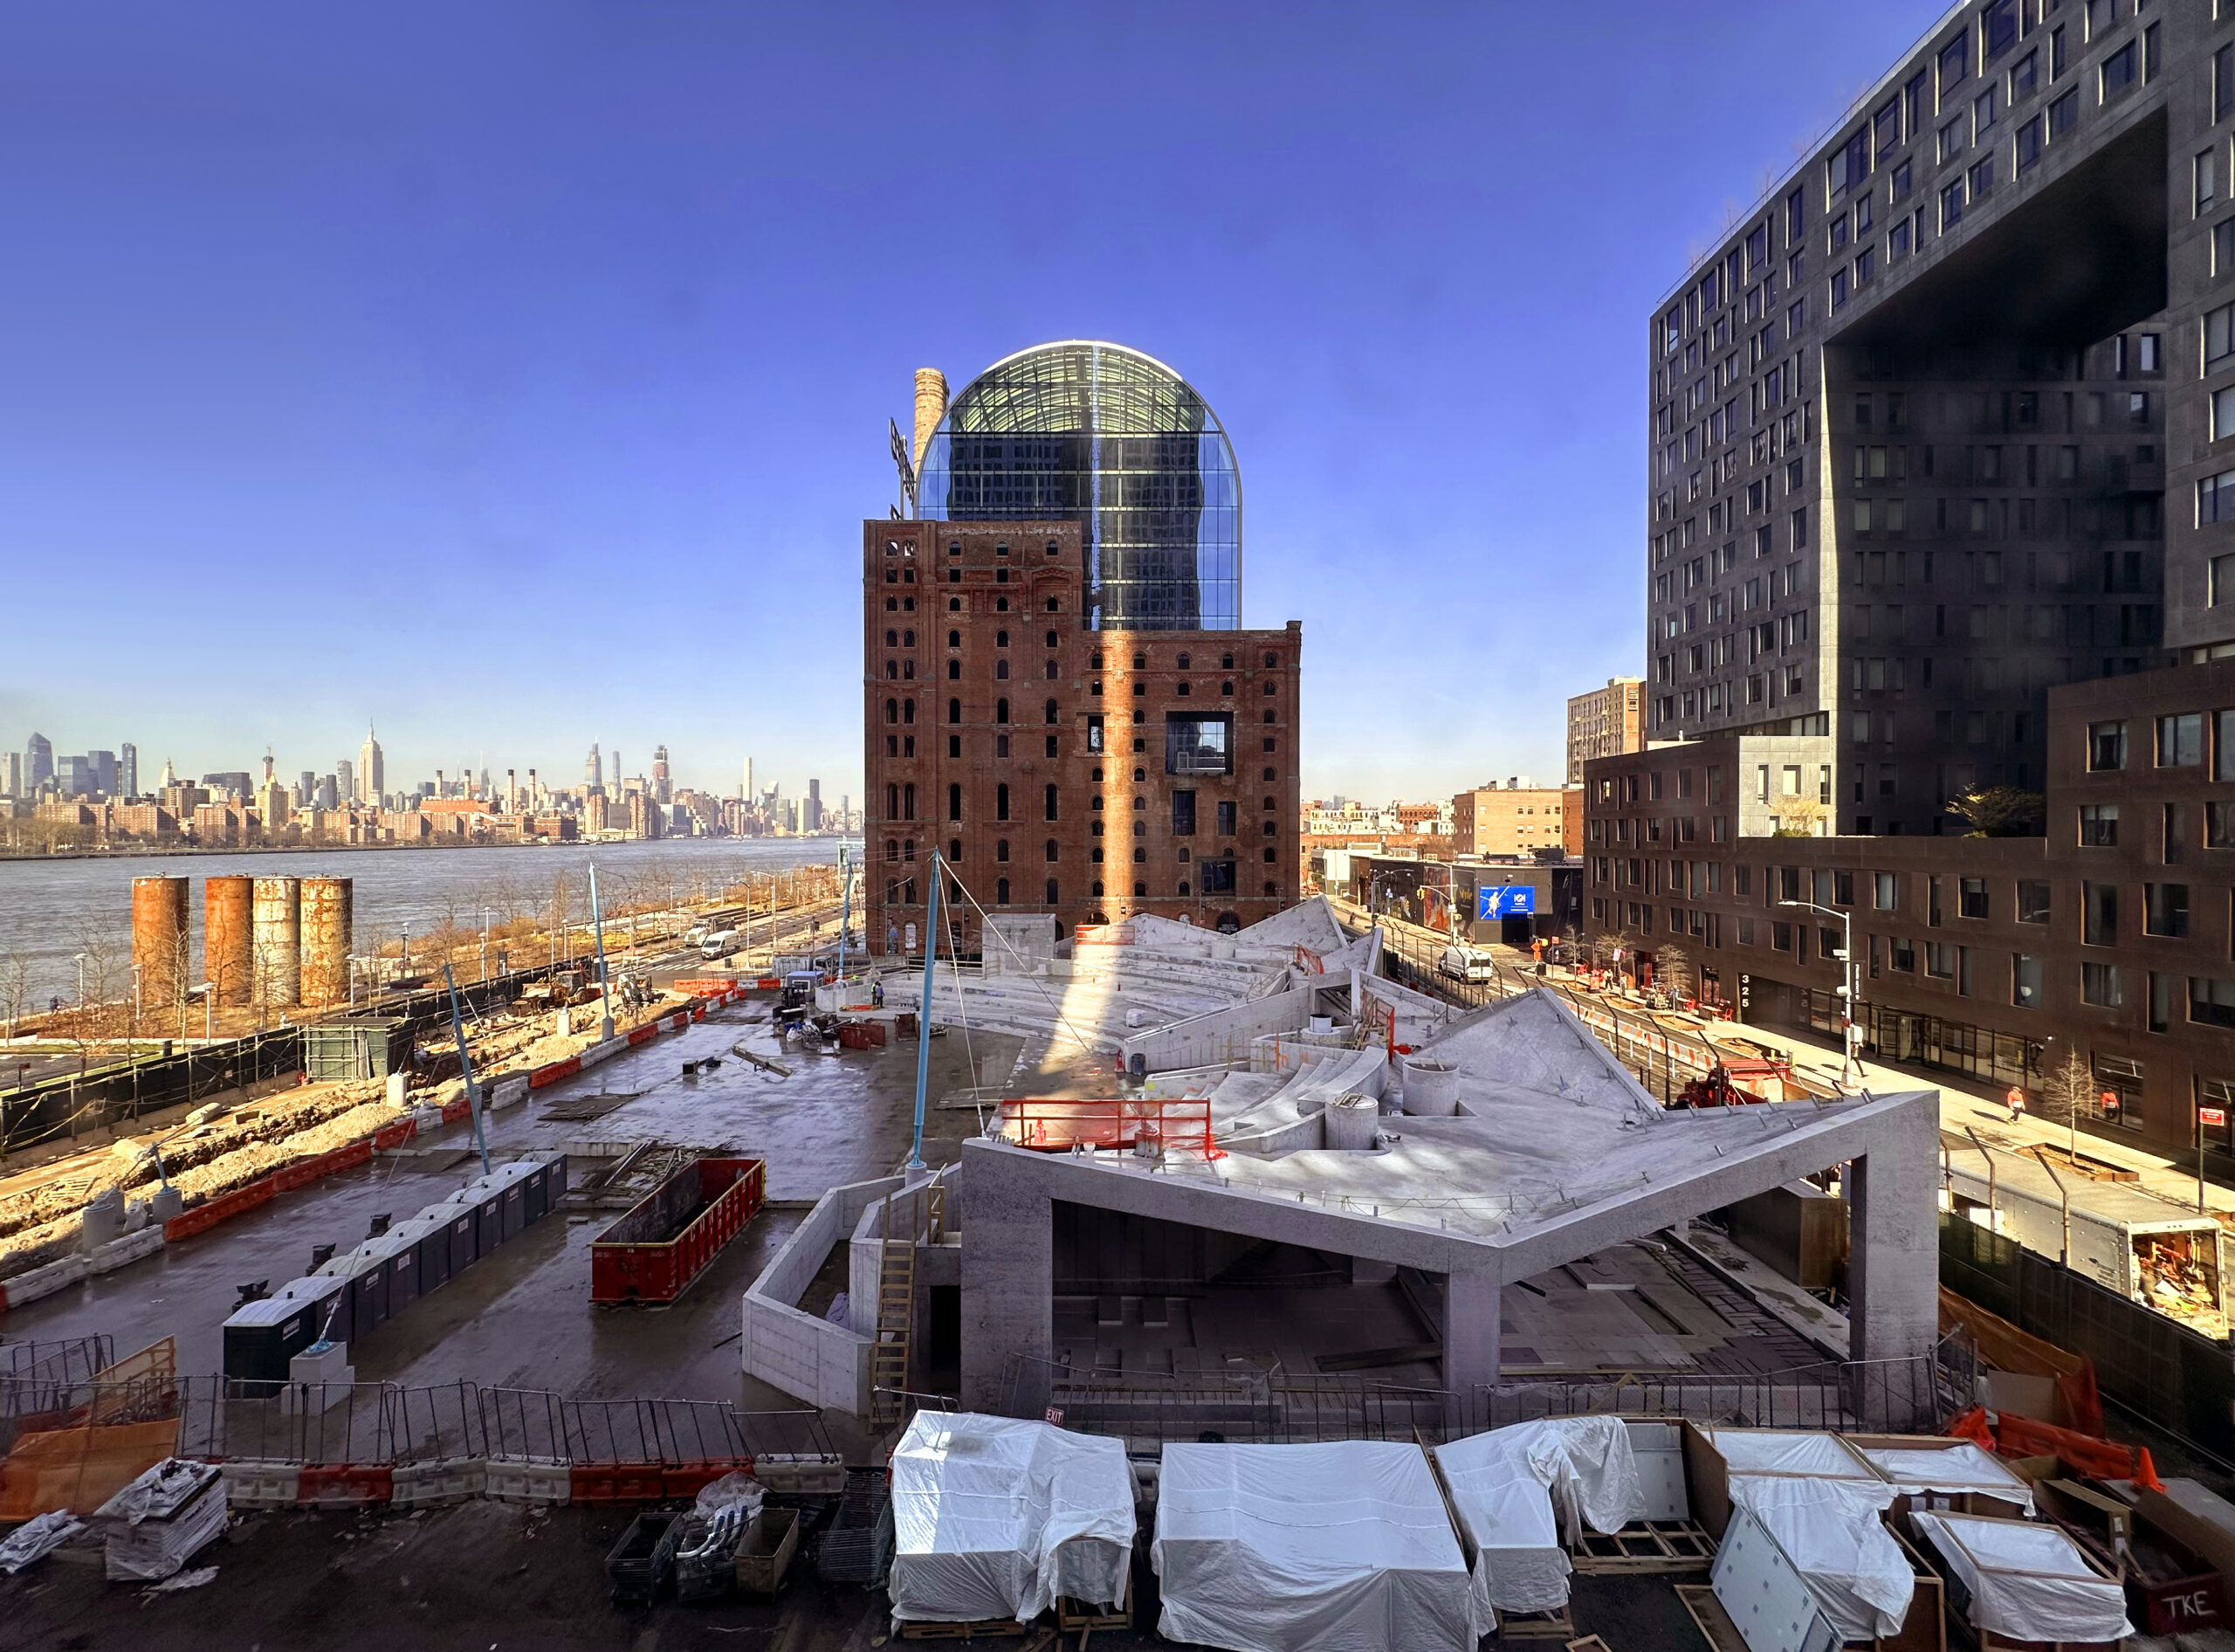
Photo by Michael Young
Permit filings by floor count category
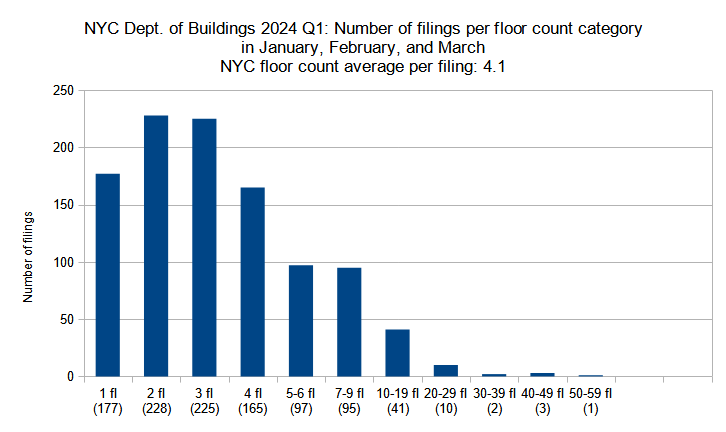
New construction permits filed in New York City in Q1 (January through March) 2024 grouped by floor count. Data source: the Department of Buildings. Data aggregation and graphics credit: Vitali Ogorodnikov
Between the fourth quarter of 2023 and the first quarter of 2024, the average floor count per filing rose significantly from 3.5 to 4.1 floors. This change stems both from a dramatic drop in lower floor-count categories as well as increases in higher floor-count categories.
Below is a comparison per floor-count category between the two quarters:
- Single-story: 3-percent decrease (183 to 177 permits)
- Two-story: 40-percent decrease (379 to 228)
- Three-story: 59-percent decrease (553 to 225)
- Four-story: 7-percent decrease (177 to 165)
- Five to six floors: 8-percent increase (90 to 97)
- Seven to nine floors: 4-percent increase (91 to 95)
- Ten to 19 floors: 14-percent increase (36 to 41)
- 20 to 29 floors: 200-percent increase (5 to 10)
- 30 to 39 floors: 60-percent decrease (5 to 2)
- 40 to 49 floors: 300-percent increase (1 to 3)
- 50 to 59 floors: no change (1)
The floor counts for every category with four or fewer floors decreased, with filings for two- and three-story structures dropping by several hundreds. In turn, almost every category with five or more floors saw growth in the total number of filings; categories with 20 to 29 floors and 40 to 49 floors increased their permit filings from five to ten and from one to three, respectively, which will further the growth of the city skyline.
Below are the top ten permit filings with the highest floor counts, in order:
- 589 Fulton Street in Downtown Brooklyn (52 floors)
- 26-38 Jackson Avenue in the Court Square section of Long Island City, Queens (49 floors)
- 205 Montague Street in Downtown Brooklyn (47 floors)
- 16 Dupont Street in Greenpoint, Brooklyn (41 floors)
- 1448 Third Avenue on the Upper East Side, Manhattan (38 floors)
- 1522 First Avenue on the Upper East Side, Manhattan (30 floors)
- 1440 Amsterdam Avenue in Manhattanville, Manhattan (28 floors)
- 41-46 27th Street in the Court Square section of Long Island City, Queens (27 floors)
- 150 Lawrence Street in Downtown Brooklyn (25 floors)
- 94-15 Sutphin Boulevard and 147-35 95th Avenue in Jamaica, Queens (24 floors each)
The location of the top 11 buildings with the highest floor counts in Q1 2024 (with a tie for the tenth place) reflects the continuing cross-borough spread of the city’s skyline. Brooklyn and Queens tallied four entries each, with Manhattan tailing just behind with three filings. Two of the filings, 94-15 Sutphin Boulevard and 147-35 95th Avenue in Queens, are situated all the way in Jamaica, 9 miles away from Midtown Manhattan.
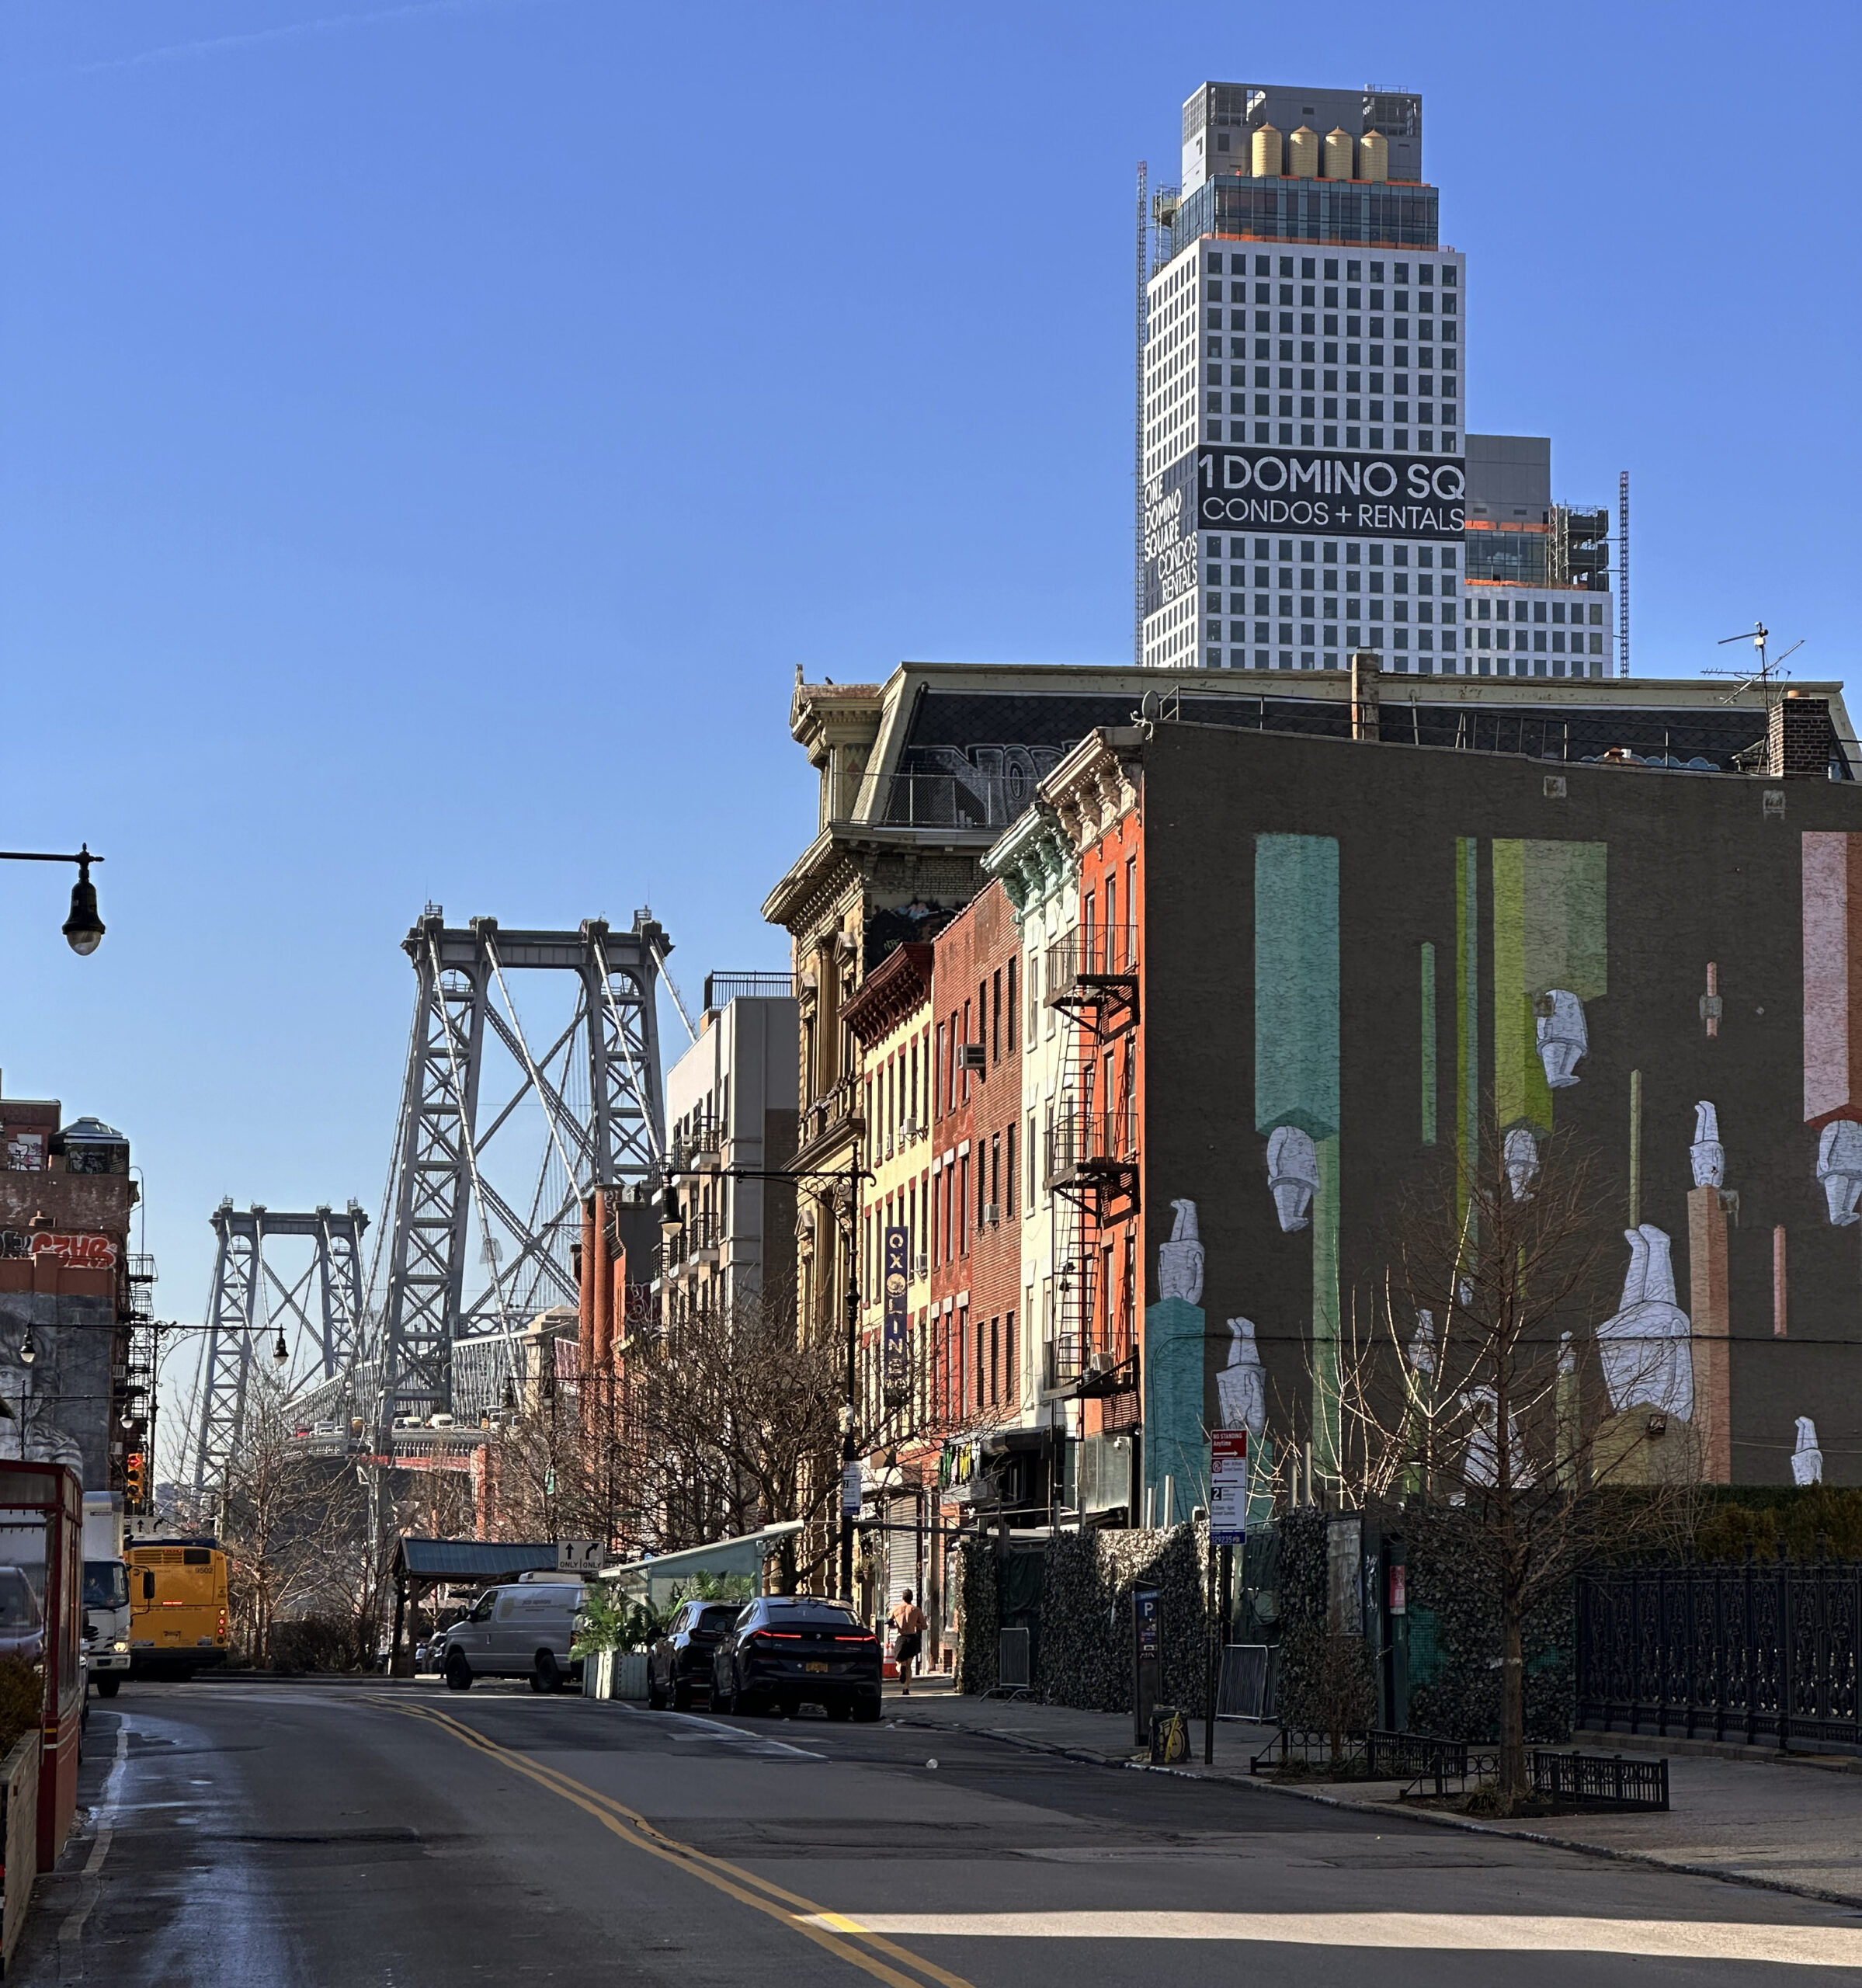
Photo by Michael Young
Average number of floors per filing per borough
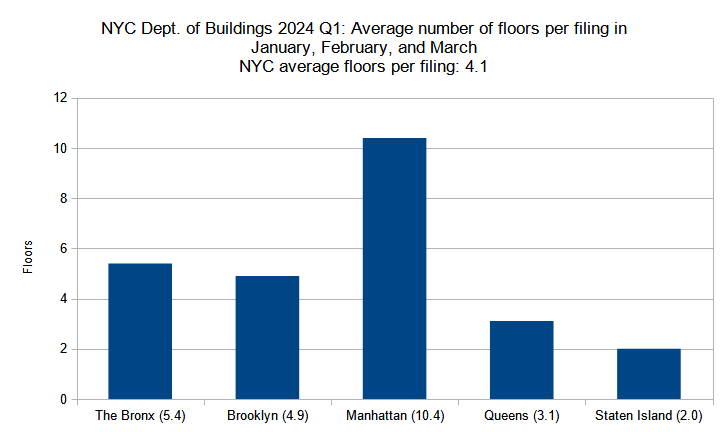
Average number of floors per new construction permit per borough filed in New York City in Q1 (January through March) 2023. Data source: the Department of Buildings. Data aggregation and graphics credit: Vitali Ogorodnikov
Between the fourth quarter of 2023 and the first quarter of 2024, the average floor count per filing increased from 3.5 to 4.1 while the overall trend for individual boroughs largely remained the same: Manhattan remains in an uncontested first place, with The Bronx trailing far behind in second, closely followed by Brooklyn, then Queens and Staten Island. Individual changes per borough fluctuate slightly.
Below is the by-borough comparison between the two quarters:
- The Bronx: 13-percent decrease (6.2 to 5.4 floors)
- Brooklyn: 9-percent increase (4.5 to 4.9)
- Manhattan: 15-percent decrease (12.3 to 10.4)
- Queens: 11-percent increase (2.8 to 3.1)
- Staten Island: 20-percent decrease (2.5 to 2.0)
The following are the permit filings in each borough with the highest floor counts:
- The Bronx: 1051 Whitlock Avenue in Longwood (14 floors)
- Brooklyn: 589 Fulton Street in Downtown Brooklyn (52 floors)
- Manhattan: 1448 Third Avenue on the Upper East Side (38 floors)
- Queens: 26-38 Jackson Avenue in the Court Square section of Long Island City (49 floors)
- Staten Island: 5 Stuyvesant Place in St. George (seven floors)
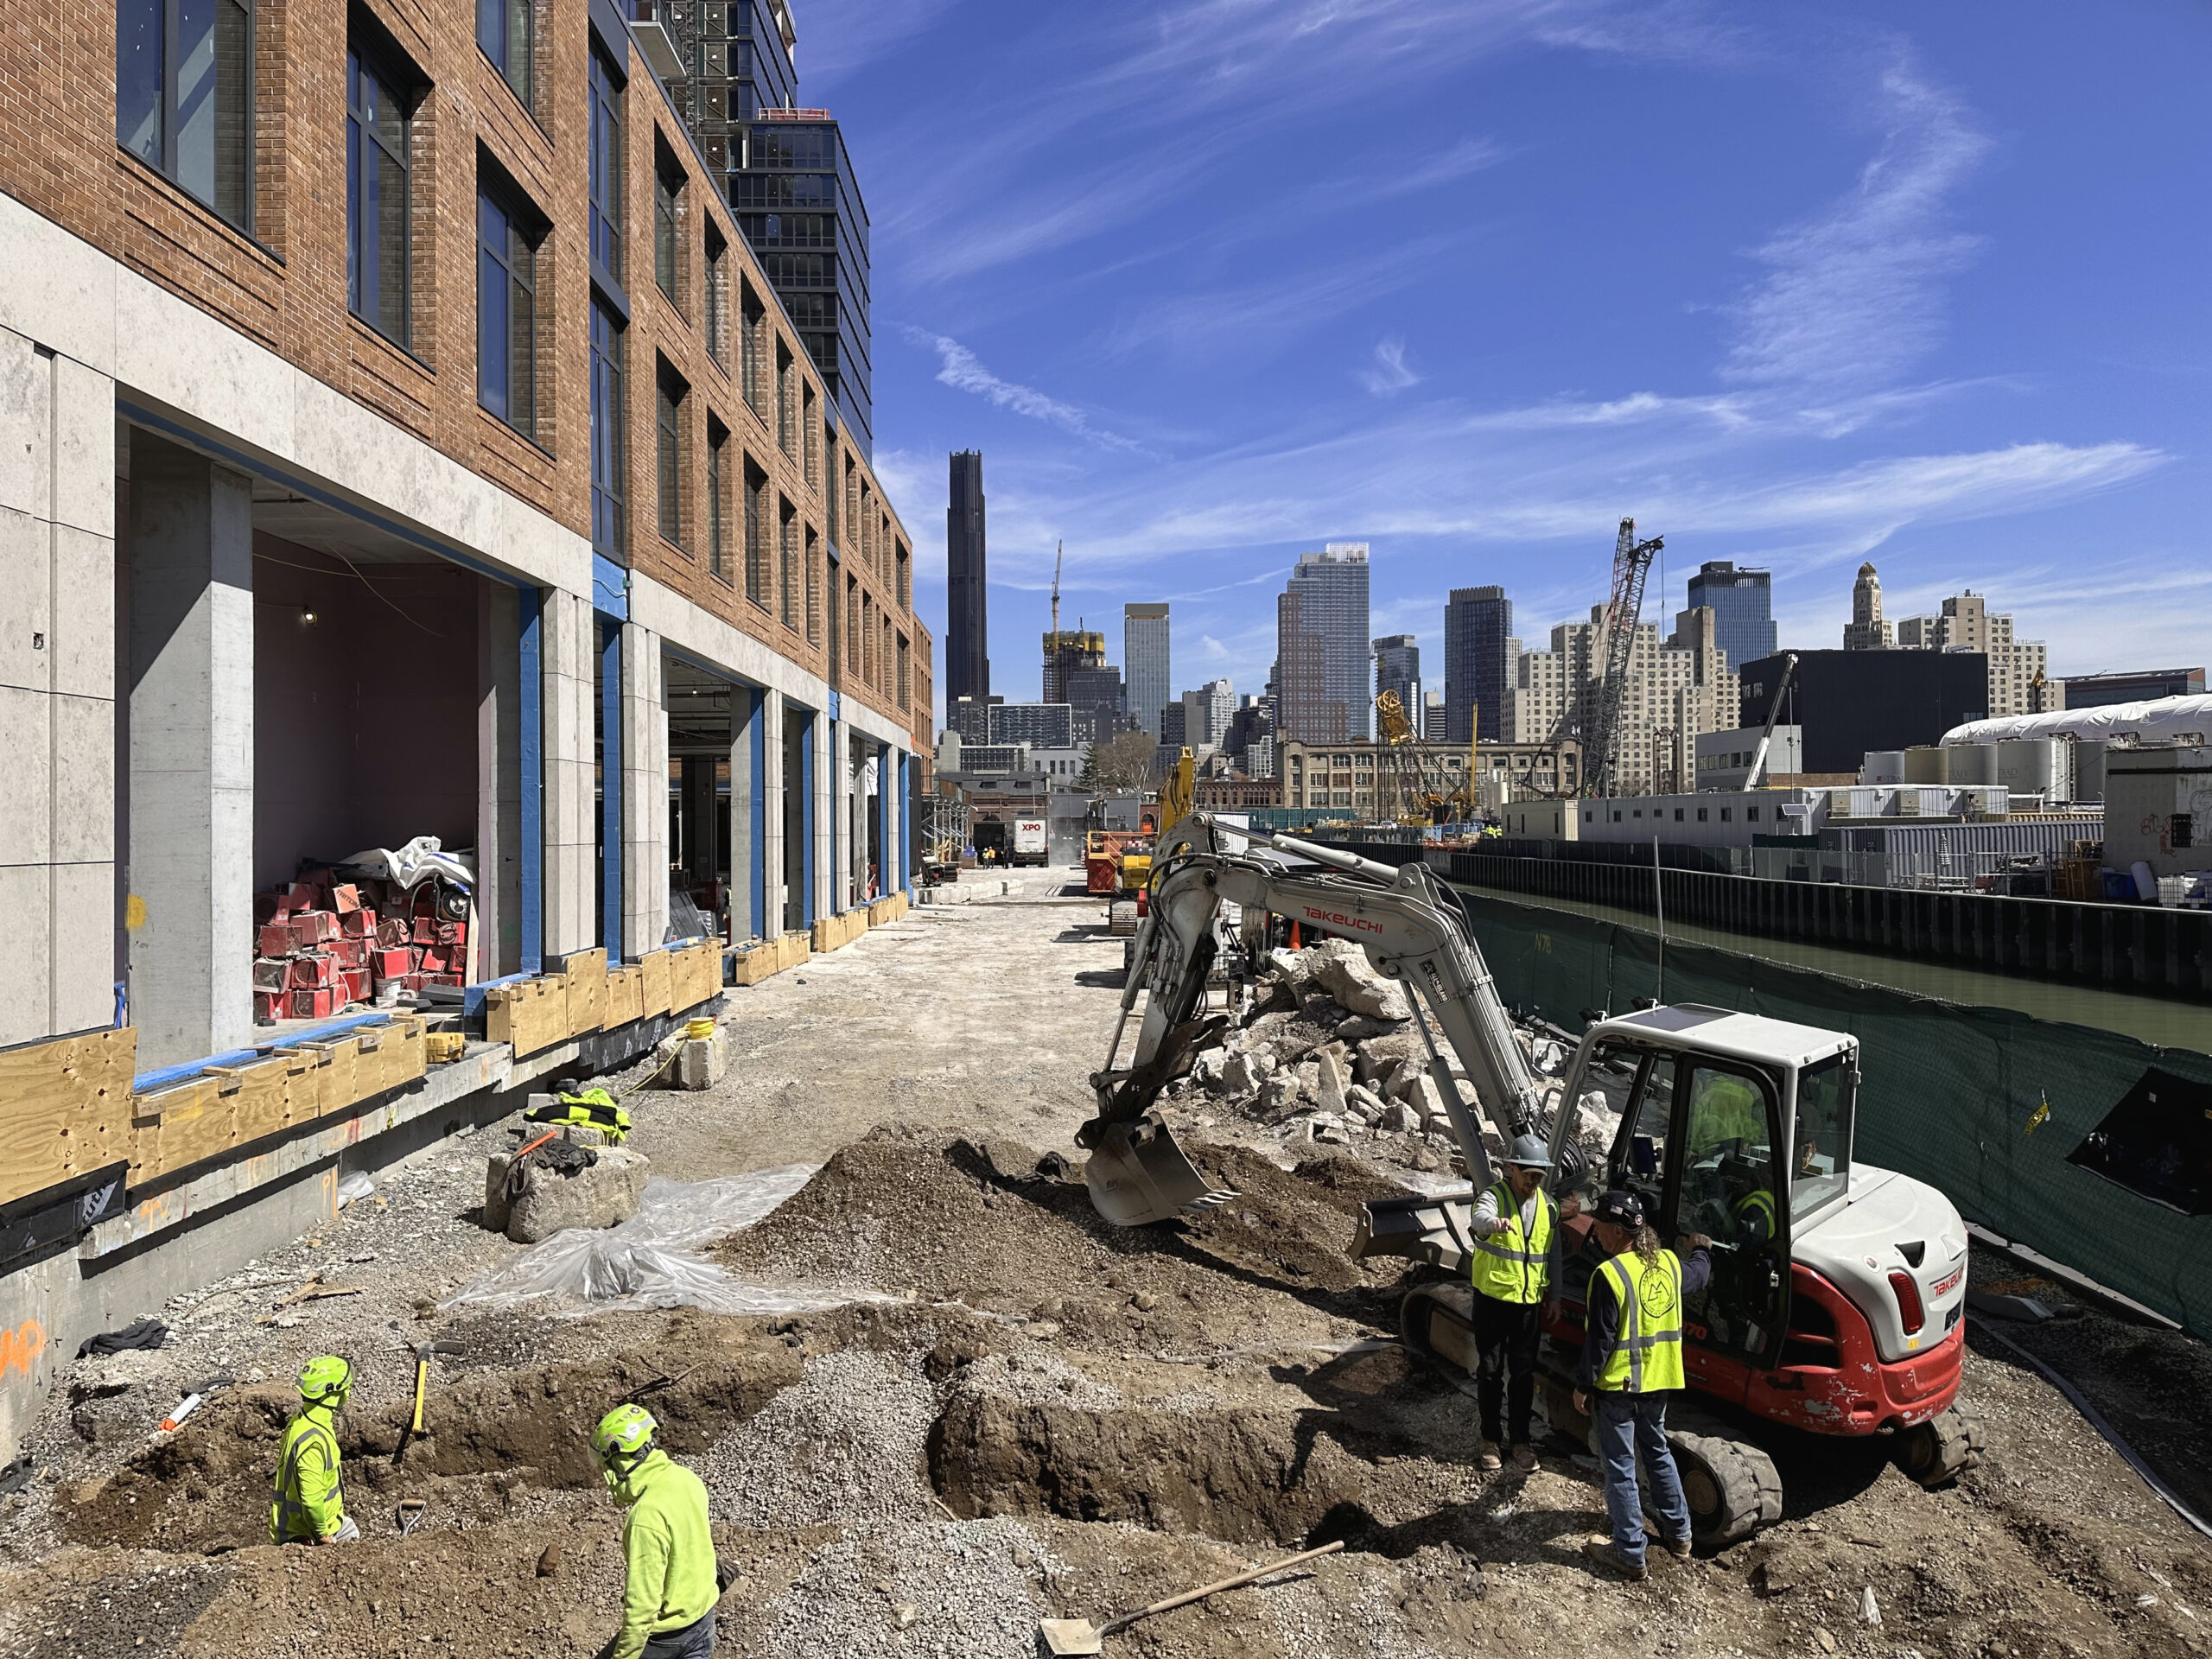
Photo by Michael Young
Permits listed by floor area per filing
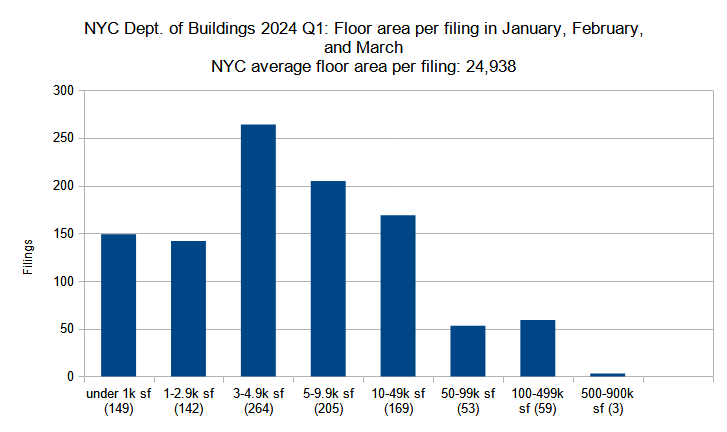
New construction permits filed in New York City in Q1 (January through March) 2024 grouped by total floor area. Data source: the Department of Buildings. Data aggregation and graphics credit: Vitali Ogorodnikov
The floor area of the average new building filing increased dramatically between the fourth quarter of 2023 and the first quarter of 2024, growing from 15,206 to 24,938 square feet. Despite a substantial drop in the number of smaller floor-area filings, increases in filing counts in some of the most sizable building categories were significant enough to increase the total average.
Below is a breakdown by floor area category:
- Under 1,000 square feet: 1-percent decrease (150 to 149 permits)
- 1,000 to 2,999 SF: 59-percent decrease (349 to 142)
- 3,000 to 4,999 SF: 48-percent decrease (512 to 264)
- 5,000 to 9,999 SF: 14-percent decrease (244 to 205)
- 10,000 to 49,999 SF: 6-percent increase (159 to 169)
- 50,000 to 99,999 SF: 12-percent decrease (60 to 53)
- 100,000 to 499,999 SF: 34-percent increase (44 to 59)
- 500,000 to 999,999 SF: 50-percent increase (2 to 3)
Following the trends set in previous quarters, most of the largest filed-for building proposals are located outside of Manhattan. In the first quarter of 2024, all of the top five largest filed-for projects are located in Queens and Brooklyn, with three in the former and two in the latter.
- 126-87 Willets Point Boulevard in Willets Point, Queens (615,000 square feet)
- 589 Fulton Street in Downtown Brooklyn (597,824 square feet)
- 126-43 39th Avenue in Willets Point, Queens (527,158 square feet)
- 94-15 Sutphin Boulevard in Jamaica, Queens (499,082 square feet)
- 147-35 95th Avenue in Jamaica, Queens (488,327 square feet)
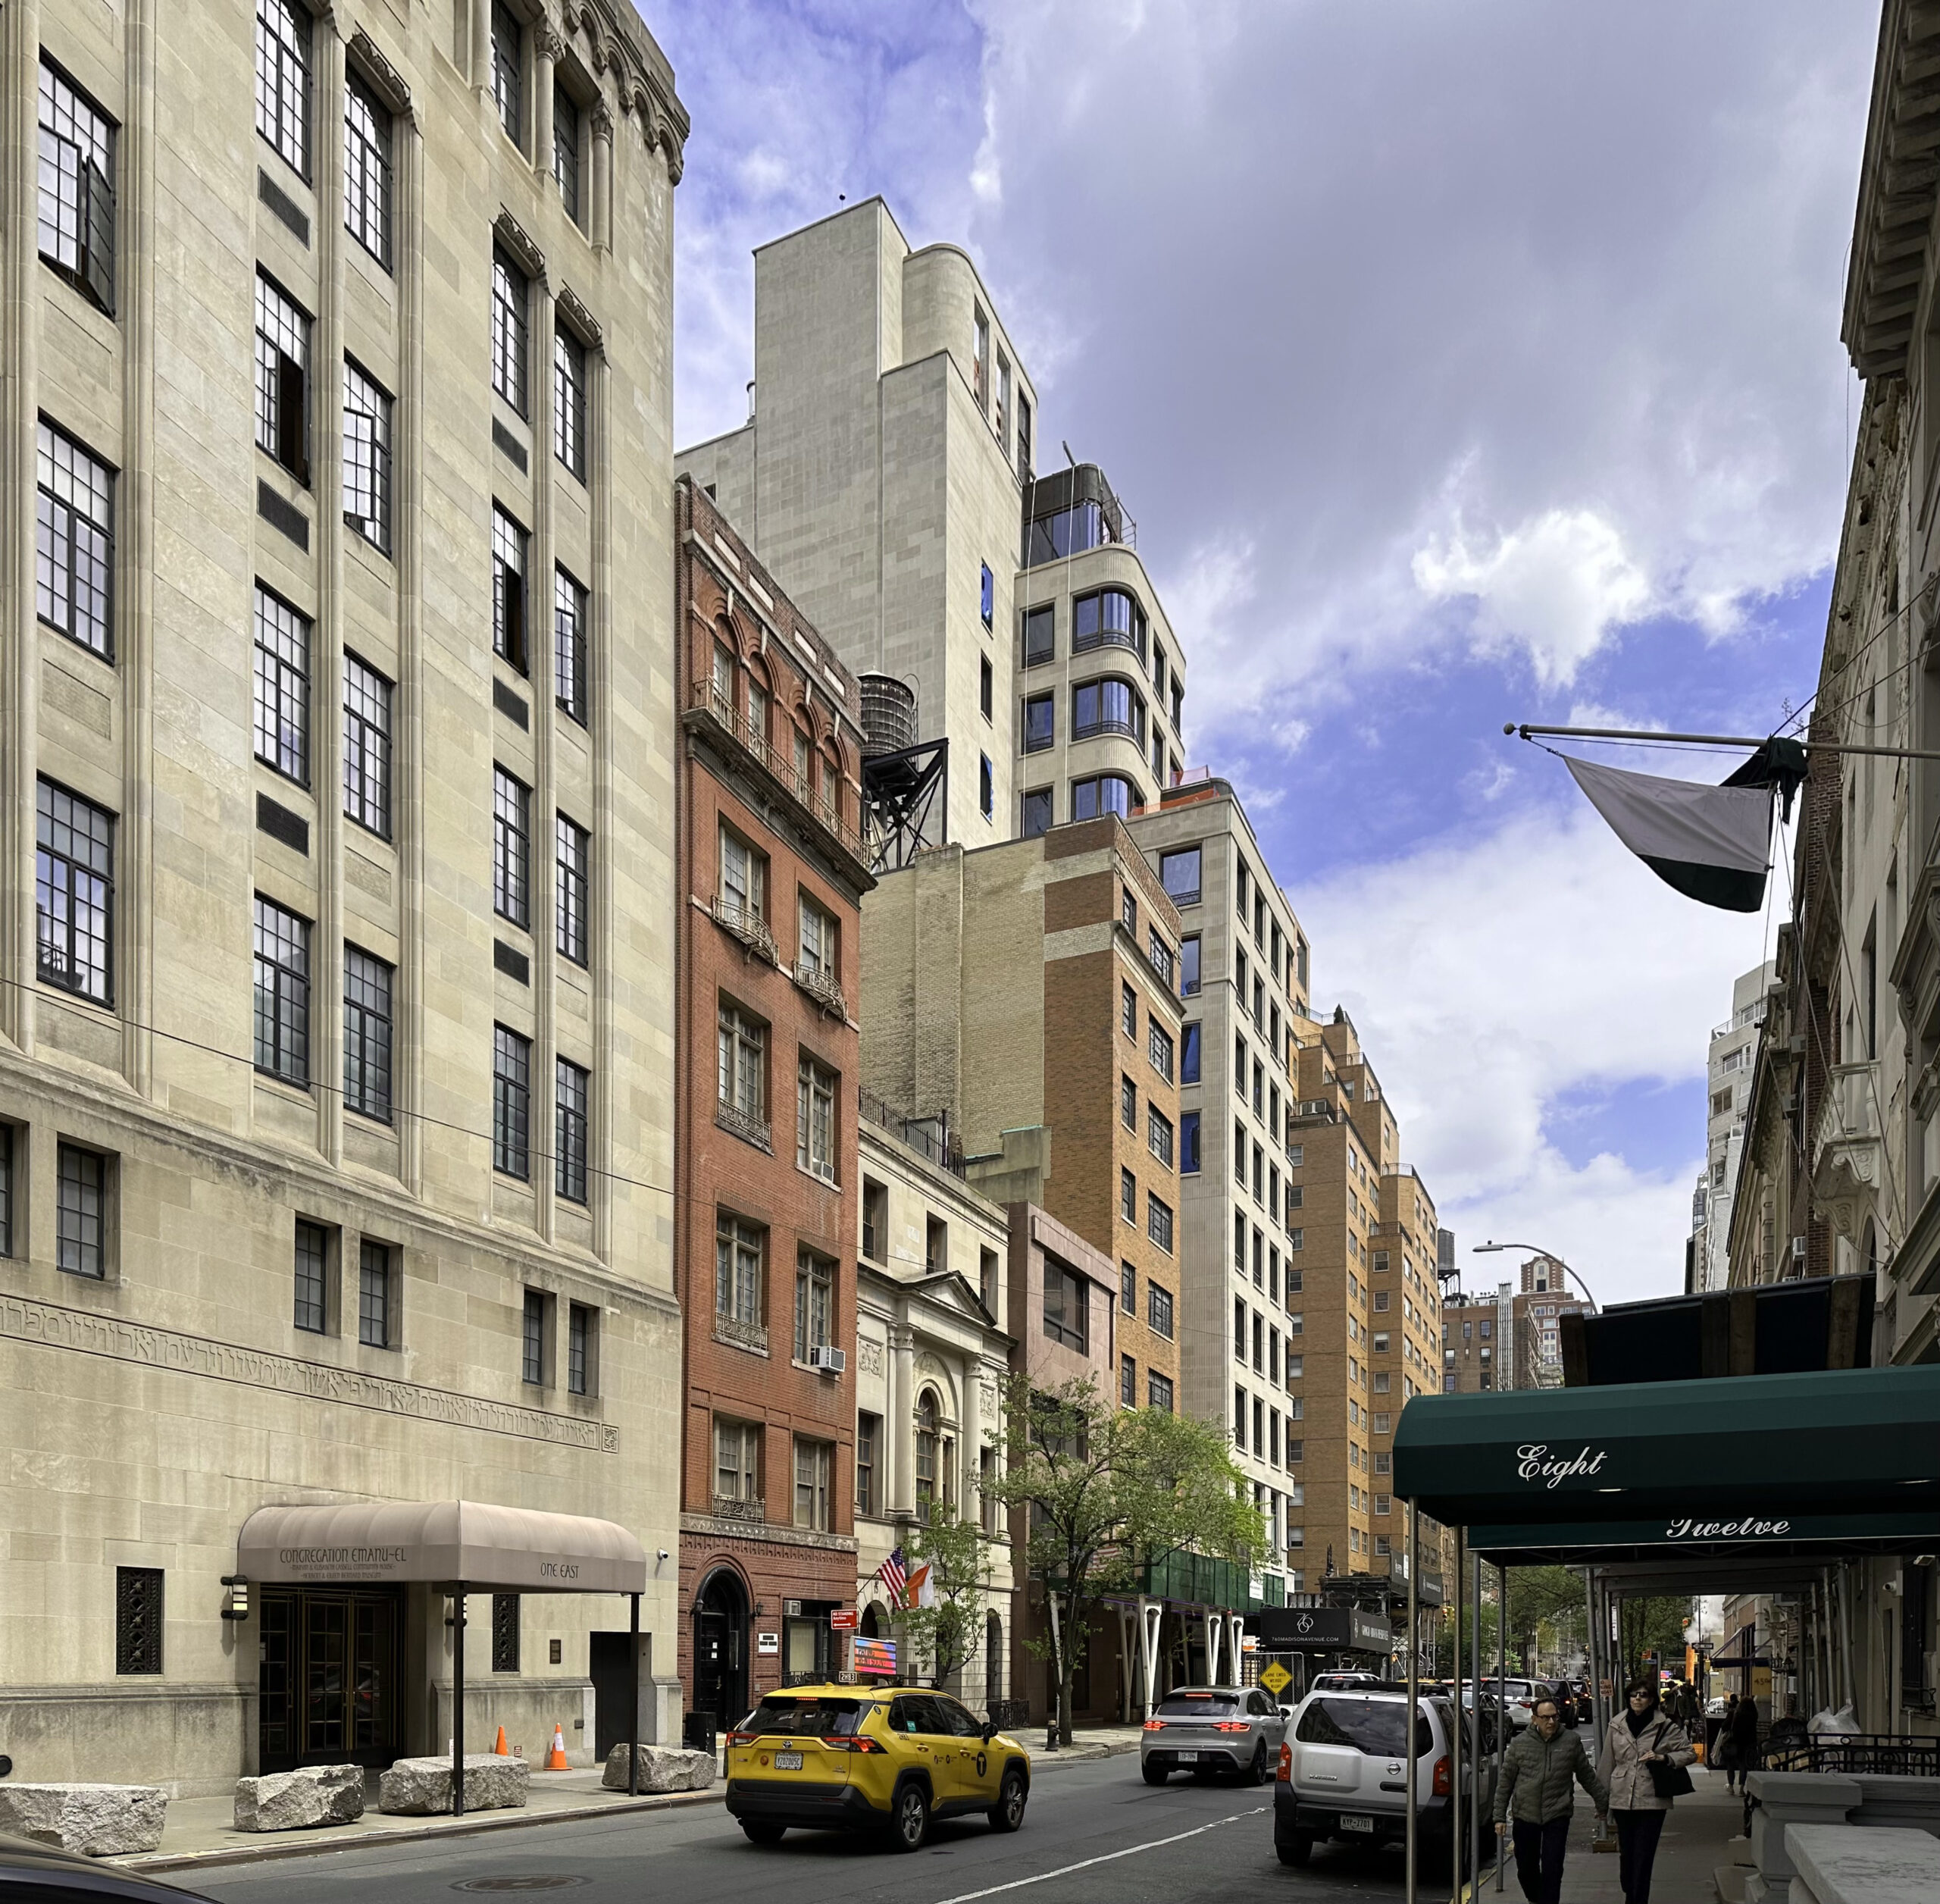
Photo by Michael Young
Total floor area filed by borough
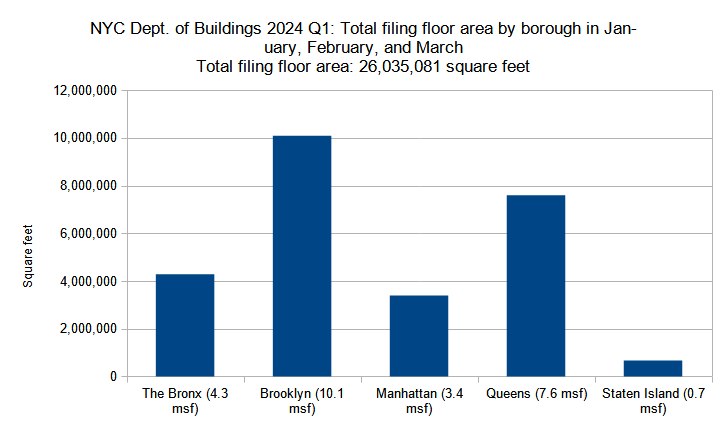
Combined floor area of new construction permits filed per borough in New York City in Q1 (January through March) 2024. Data source: the Department of Buildings. Data aggregation and graphics credit: Vitali Ogorodnikov
The total filed-for square footage for new buildings in New York City increased by 13 percent between the fourth quarter of 2023 and the first quarter of 2024, rising from 23.1 to 26 million square feet. While the overall ranking of square footage volume between the boroughs remained the same (with Brooklyn in the lead, followed by Queens, The Bronx, Manhattan, and Staten Island), changes between individual boroughs vary widely.
Below are the square footage totals per borough compared between Q4 2023 and Q1 2024:
- The Bronx: 2-percent decrease (4.4 to 4.3 million square feet)
- Brooklyn: 28-percent increase (7.9 to 10.1 MSF)
- Manhattan: 3-percent increase (3.3 to 3.4 MSF)
- Queens: 65-percent increase (4.6 to 7.6 MSF)
- Staten Island: 77-percent decrease (3.0 to 0.7 MSF)
The totals for The Bronx and Manhattan remained largely consistent, dropping by 2 percent to 4.3 million square feet in the former and rising by 3 percent to 3.4 million square feet in the latter. Staten Island’s total plunged to a quarter of its previous figure, falling below 1 million square feet. On the other hand, Brooklyn’s total jumped by nearly a third, rising to just over 10 million square feet, and Queens surged by 65 percent, increasing to 7.6 million square feet.
The following are the permit filings in each borough with the largest floor area:
- The Bronx: 138 Bruckner Boulevard in Mott Haven (353,767 square feet)
- Brooklyn: 589 Fulton Street in Downtown Brooklyn (597,824 SF)
- Manhattan: 1440 Amsterdam Avenue in Manhattanville (350,562 SF)
- Queens: 126-87 Willets Point Boulevard in Willets Point (615,000 SF)
- Staten Island: 30 Page Avenue in Tottenville (332,009 SF)
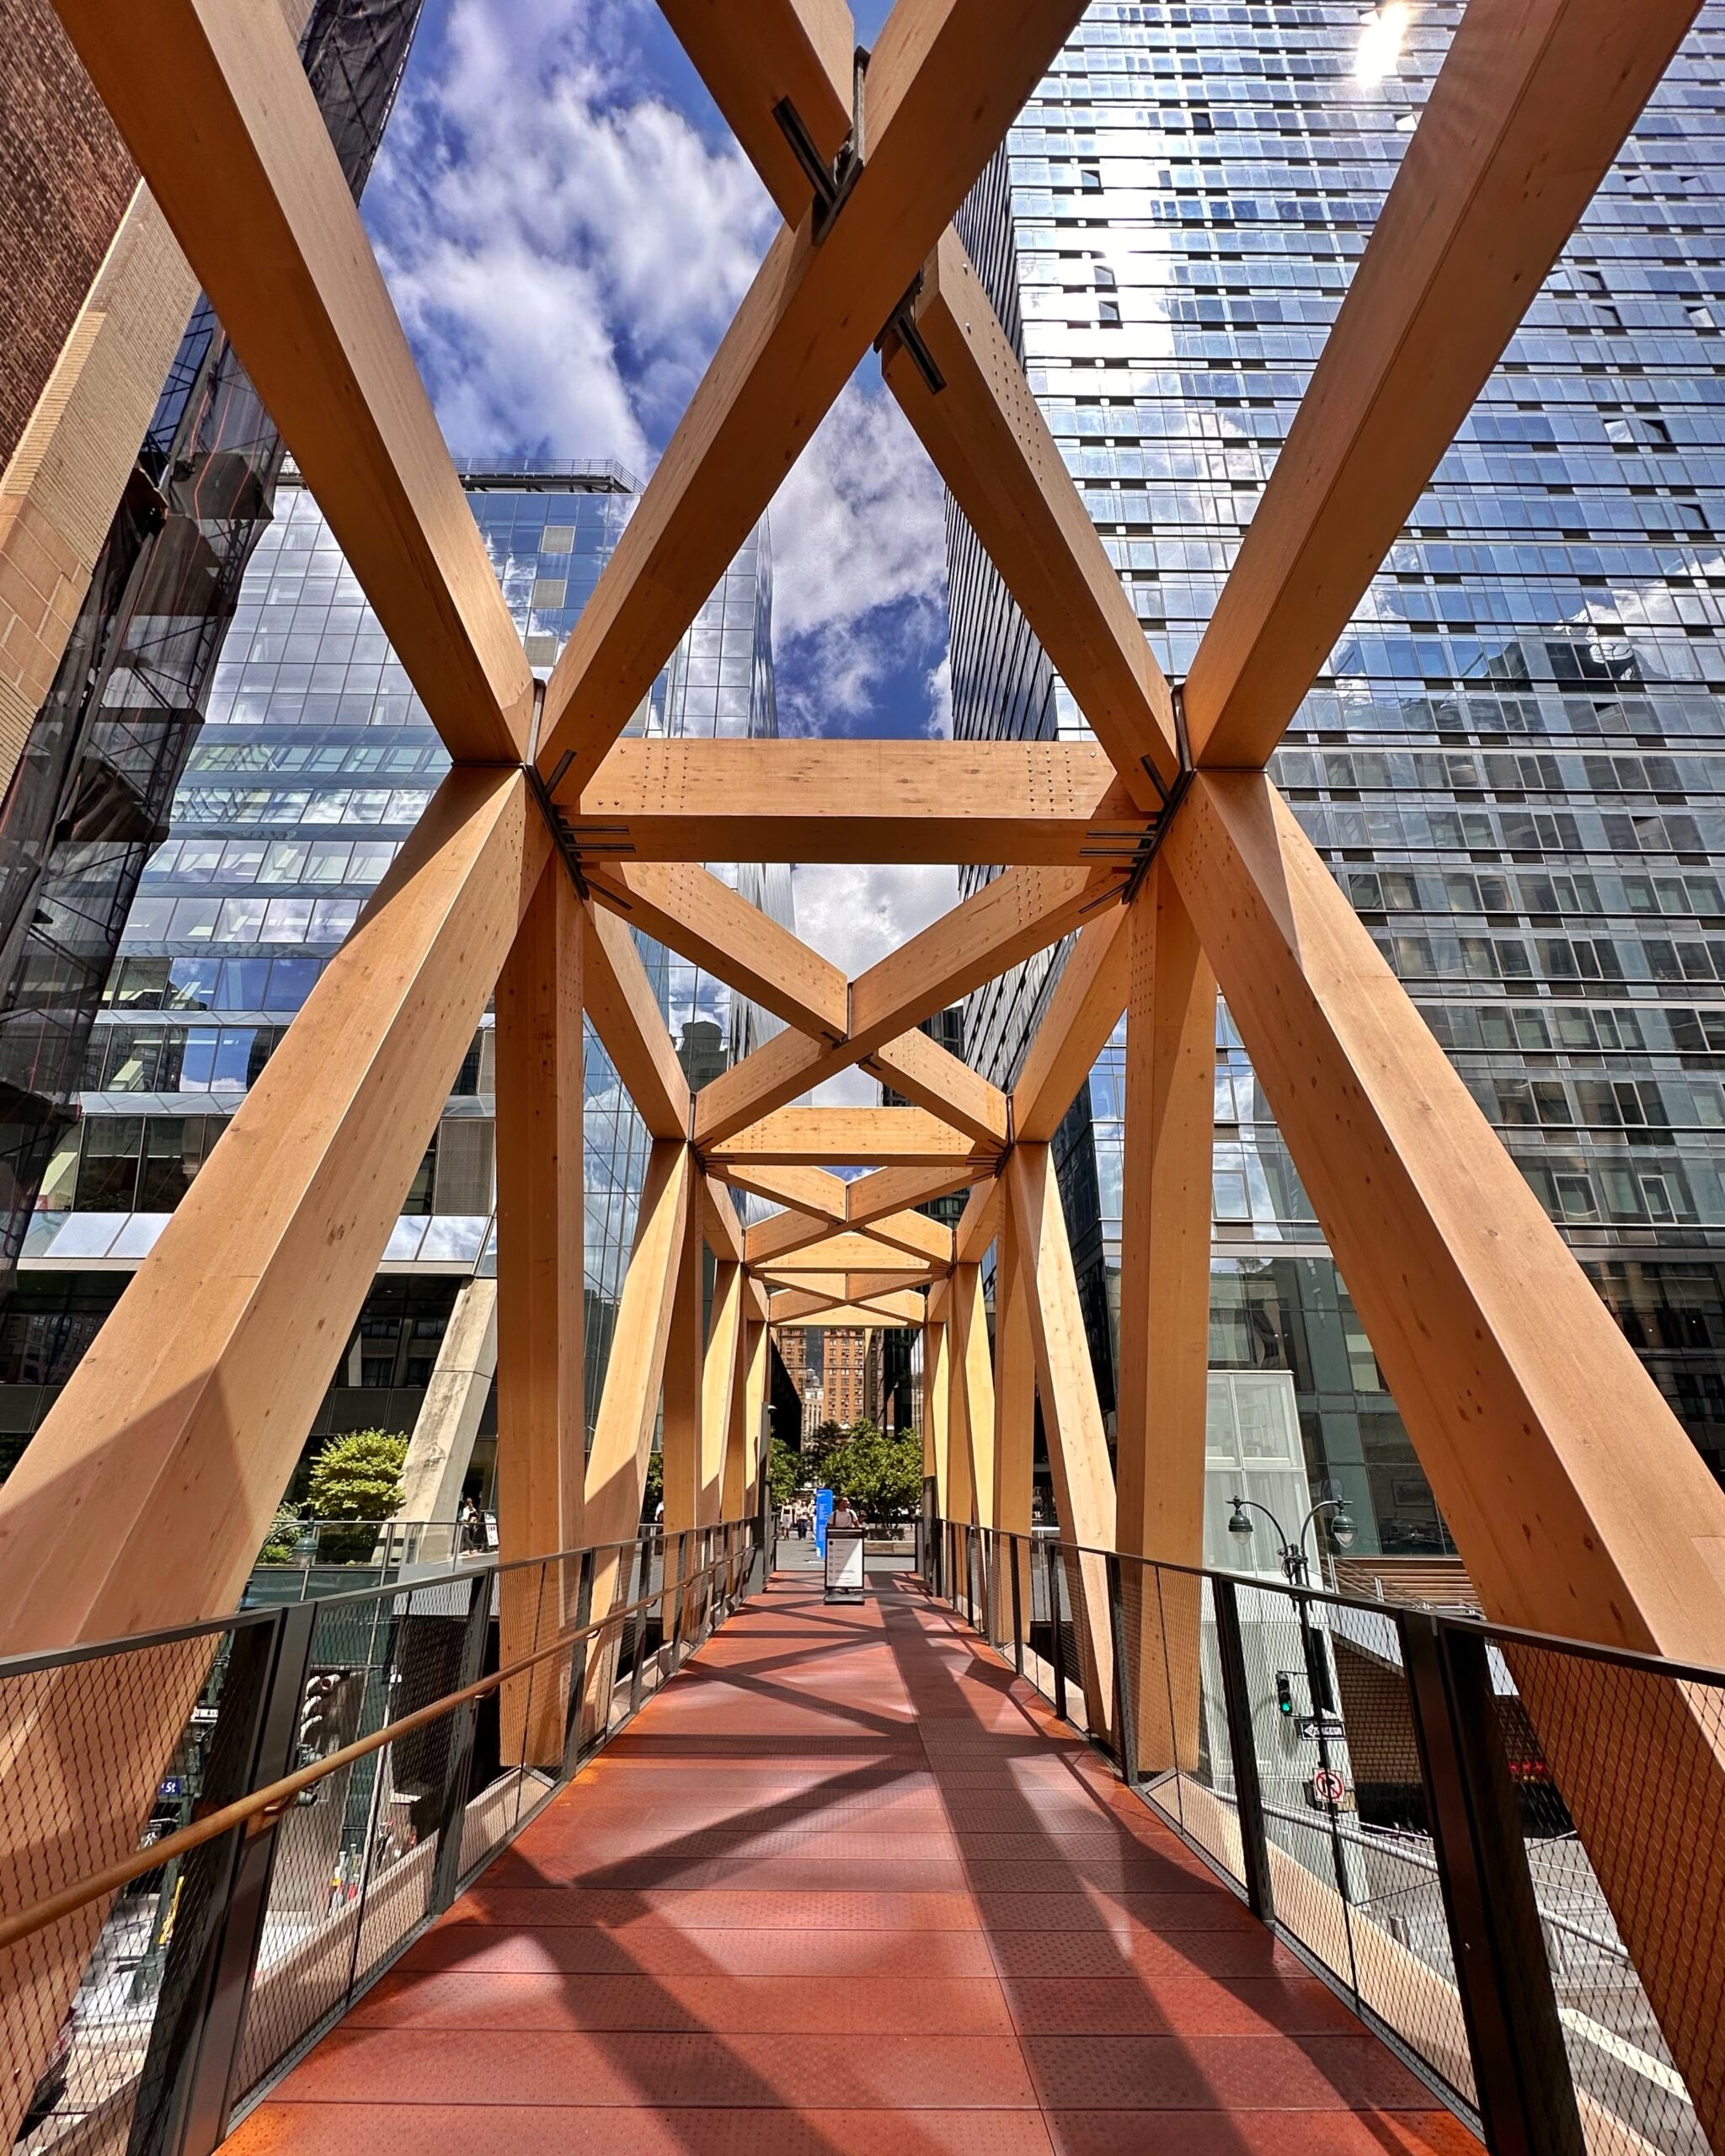
Photo by Michael Young
Average floor area per permit filing by borough
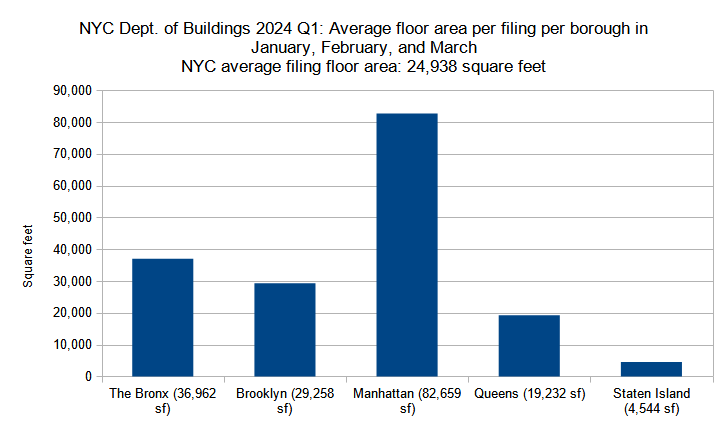
Average floor area per new construction permit per borough filed in New York City in Q1 (January through March) 2024. Data source: the Department of Buildings. Data aggregation and graphics credit: Vitali Ogorodnikov
Between the fourth quarter of 2023 and the first quarter of 2024, the floor area of the average new building filing nearly doubled from 15,206 to 24,938 square feet. Four out of five boroughs saw increases, with only The Bronx registering a 12-percent drop in average floor area per filing. The rest of the boroughs saw varying degrees of growth, from a modest 2-percent uptick in Manhattan (which still displays the largest average filing size) to a 50-percent rise in Queens (though the borough also maintains the second-smallest average filing size).
Below is the quarterly comparison for the boroughs:
- The Bronx: 12-percent decrease (41,864 to 36,962 square feet)
- Brooklyn: 20-percent increase (24,420 to 29,258 SF)
- Manhattan: 2-percent increase (81,324 to 82,659 SF)
- Queens: 50-percent increase (12,800 to 19,232 SF)
- Staten Island: 5-percent increase (4,338 to 4,544 SF)
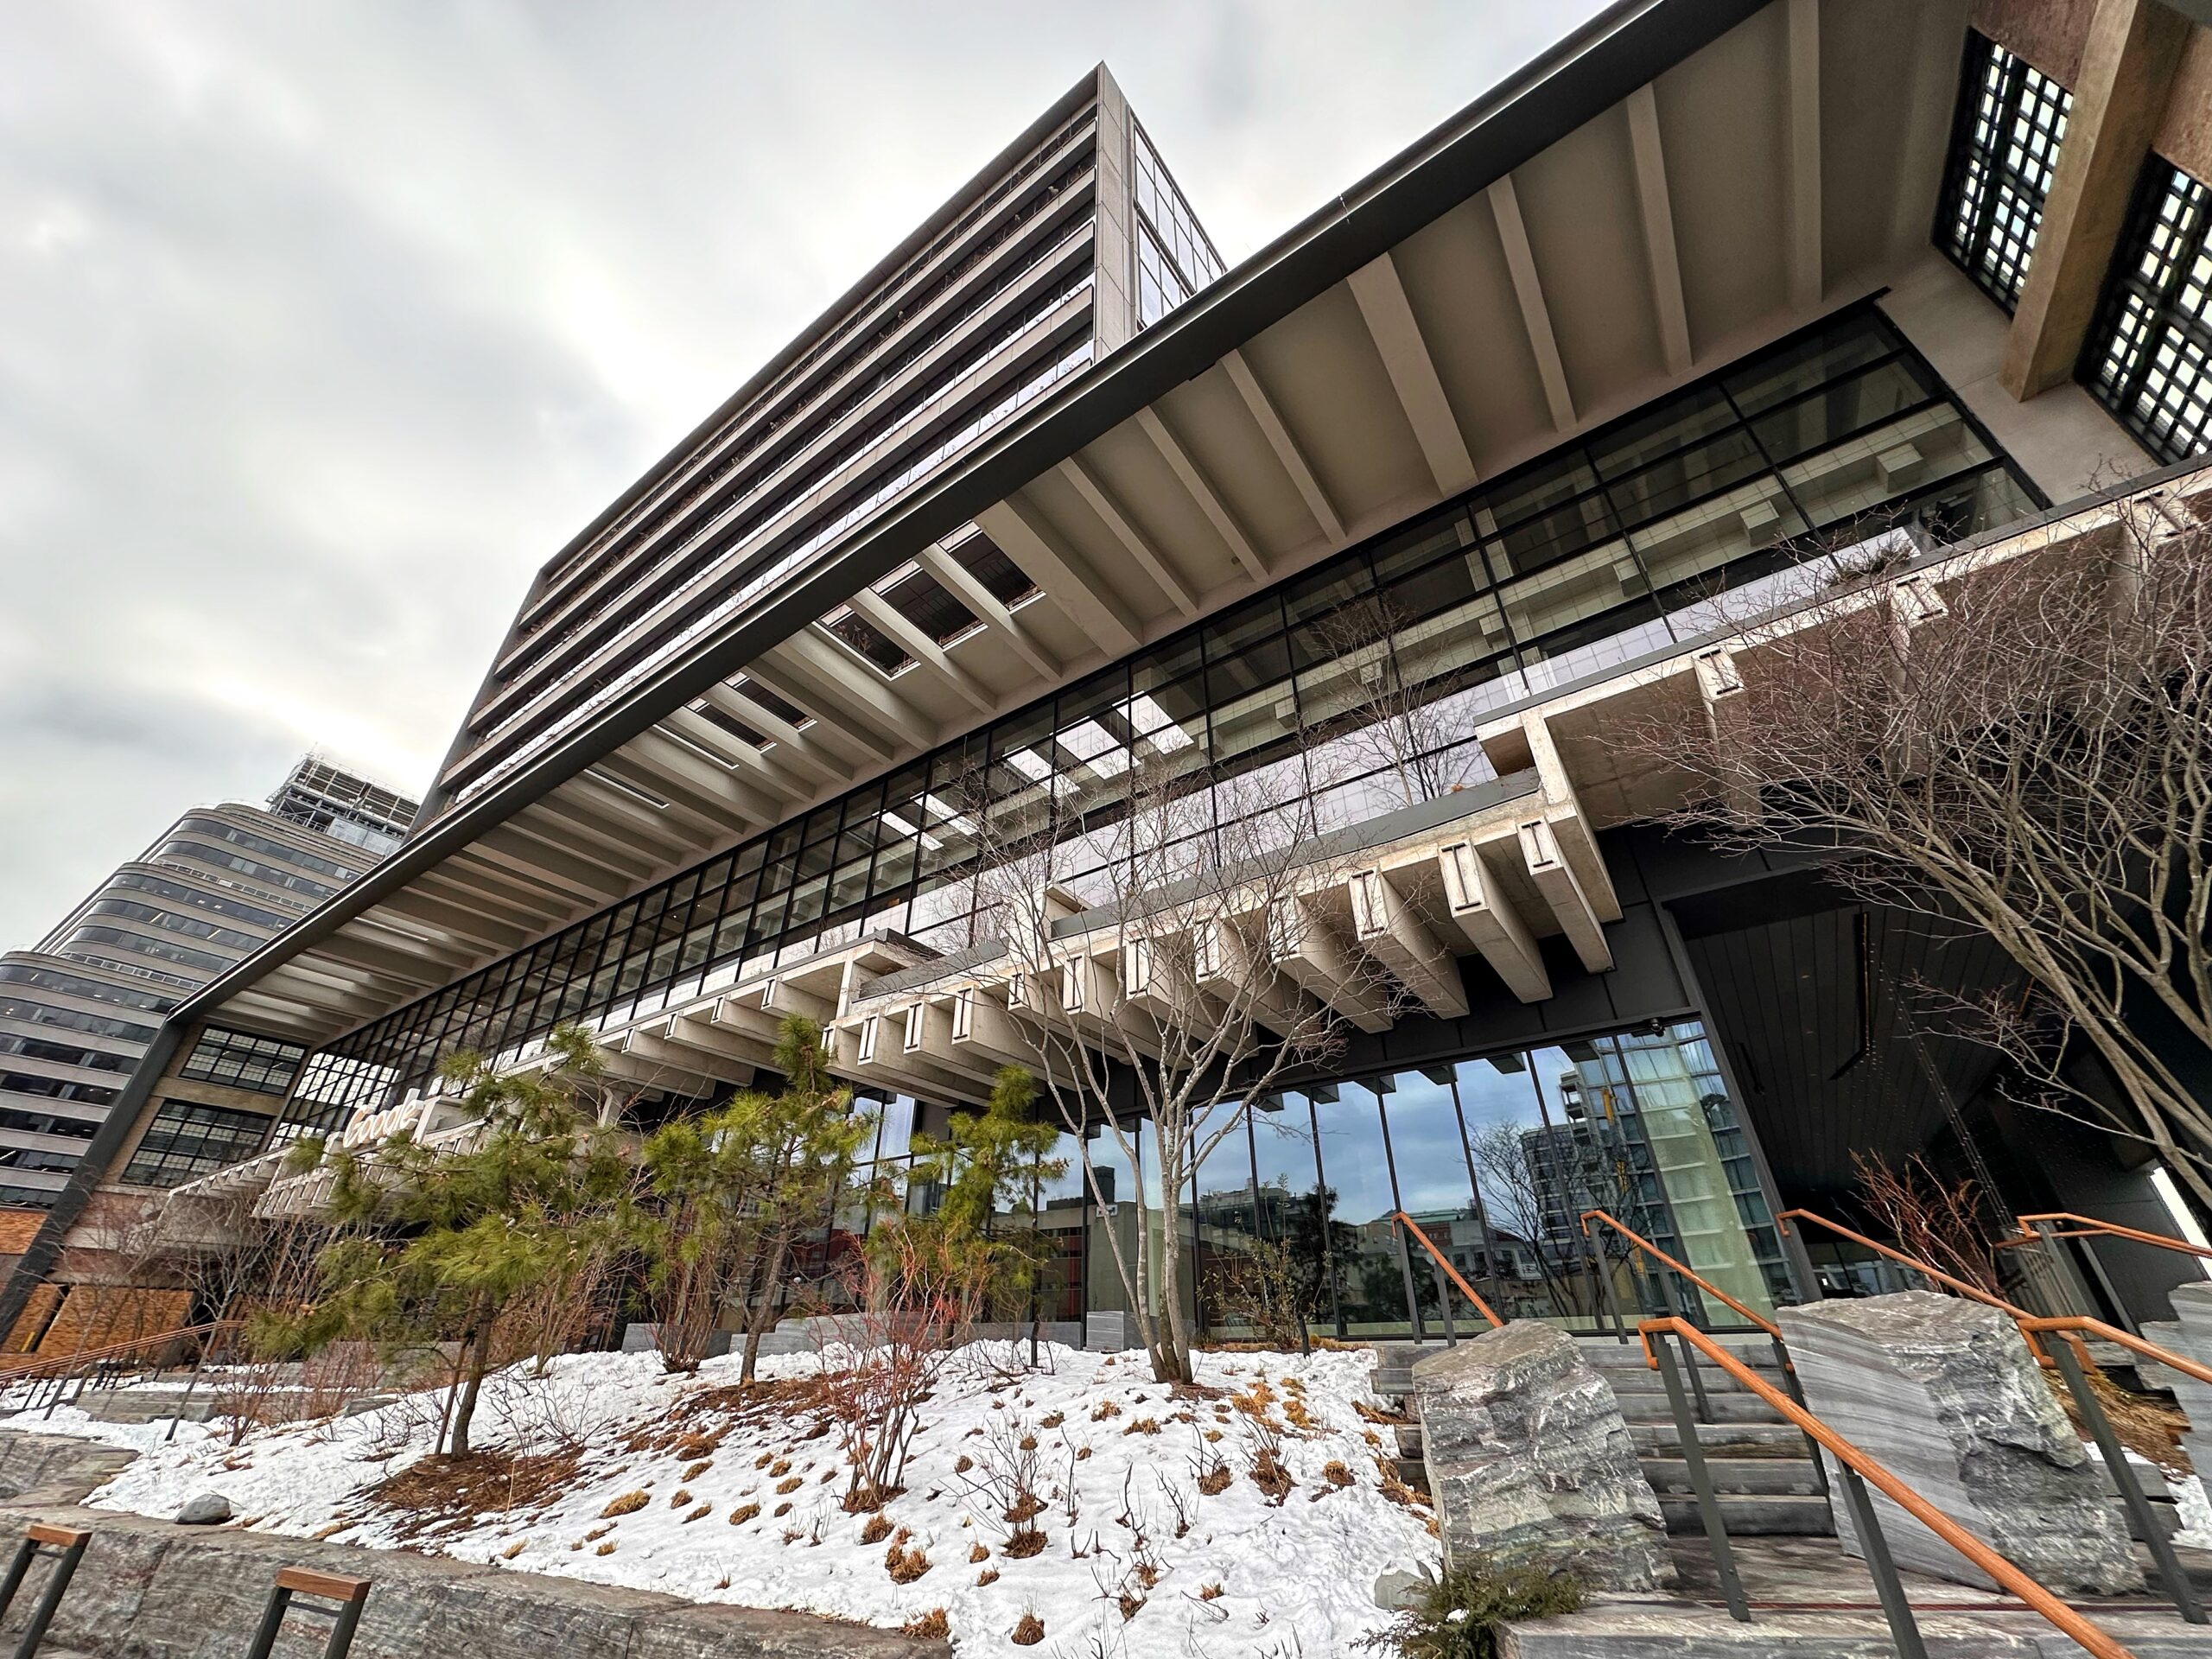
Photo by Michael Young
The record-setting numbers for the first quarter of 2024 paint a bright picture of the city’s burgeoning construction industry. However, the filed-for building permit volume is still not even close to resolving the city’s dire housing crisis, where a severe shortage of available housing is driving rents and living costs to record levels, exacerbating homelessness, and hurting New Yorkers of all income levels.
As indicated by the numbers in this report, New York City has a construction industry that is willing to produce new housing at ever-increasing levels. With the most extensive public transit system in the nation and ample development-ready land and underbuilt properties, the city may easily accommodate at least hundreds of thousands of new housing units without placing undue burdens on the existing infrastructure (although, of course, improvements in both physical and social infrastructure must be made concurrently).
As such, the largest obstacles to producing new housing are largely political and bureaucratic in nature. A number of wide-ranging initiatives to expand housing creation opportunities are currently underway both at the city at state levels, yet these are undercut at every level by a minor yet influential opposition, driven at times either by vested interests, a misunderstanding of urban economics or the laws of supply and demand, or just reactionary reflexes and a general fear of change.
In order to alleviate a severe housing crisis that directly impacts millions of New Yorkers, we urge city and state agencies alike to continue to reform outdated zoning restrictions by easing floor-to-area ratio (FAR) caps throughout the city, encouraging dense development within vicinity of mass transit, incentivizing developers to convert aging office buildings into much-needed residential space, and increasing investment into infrastructure such as mass transit, schools, and parks.
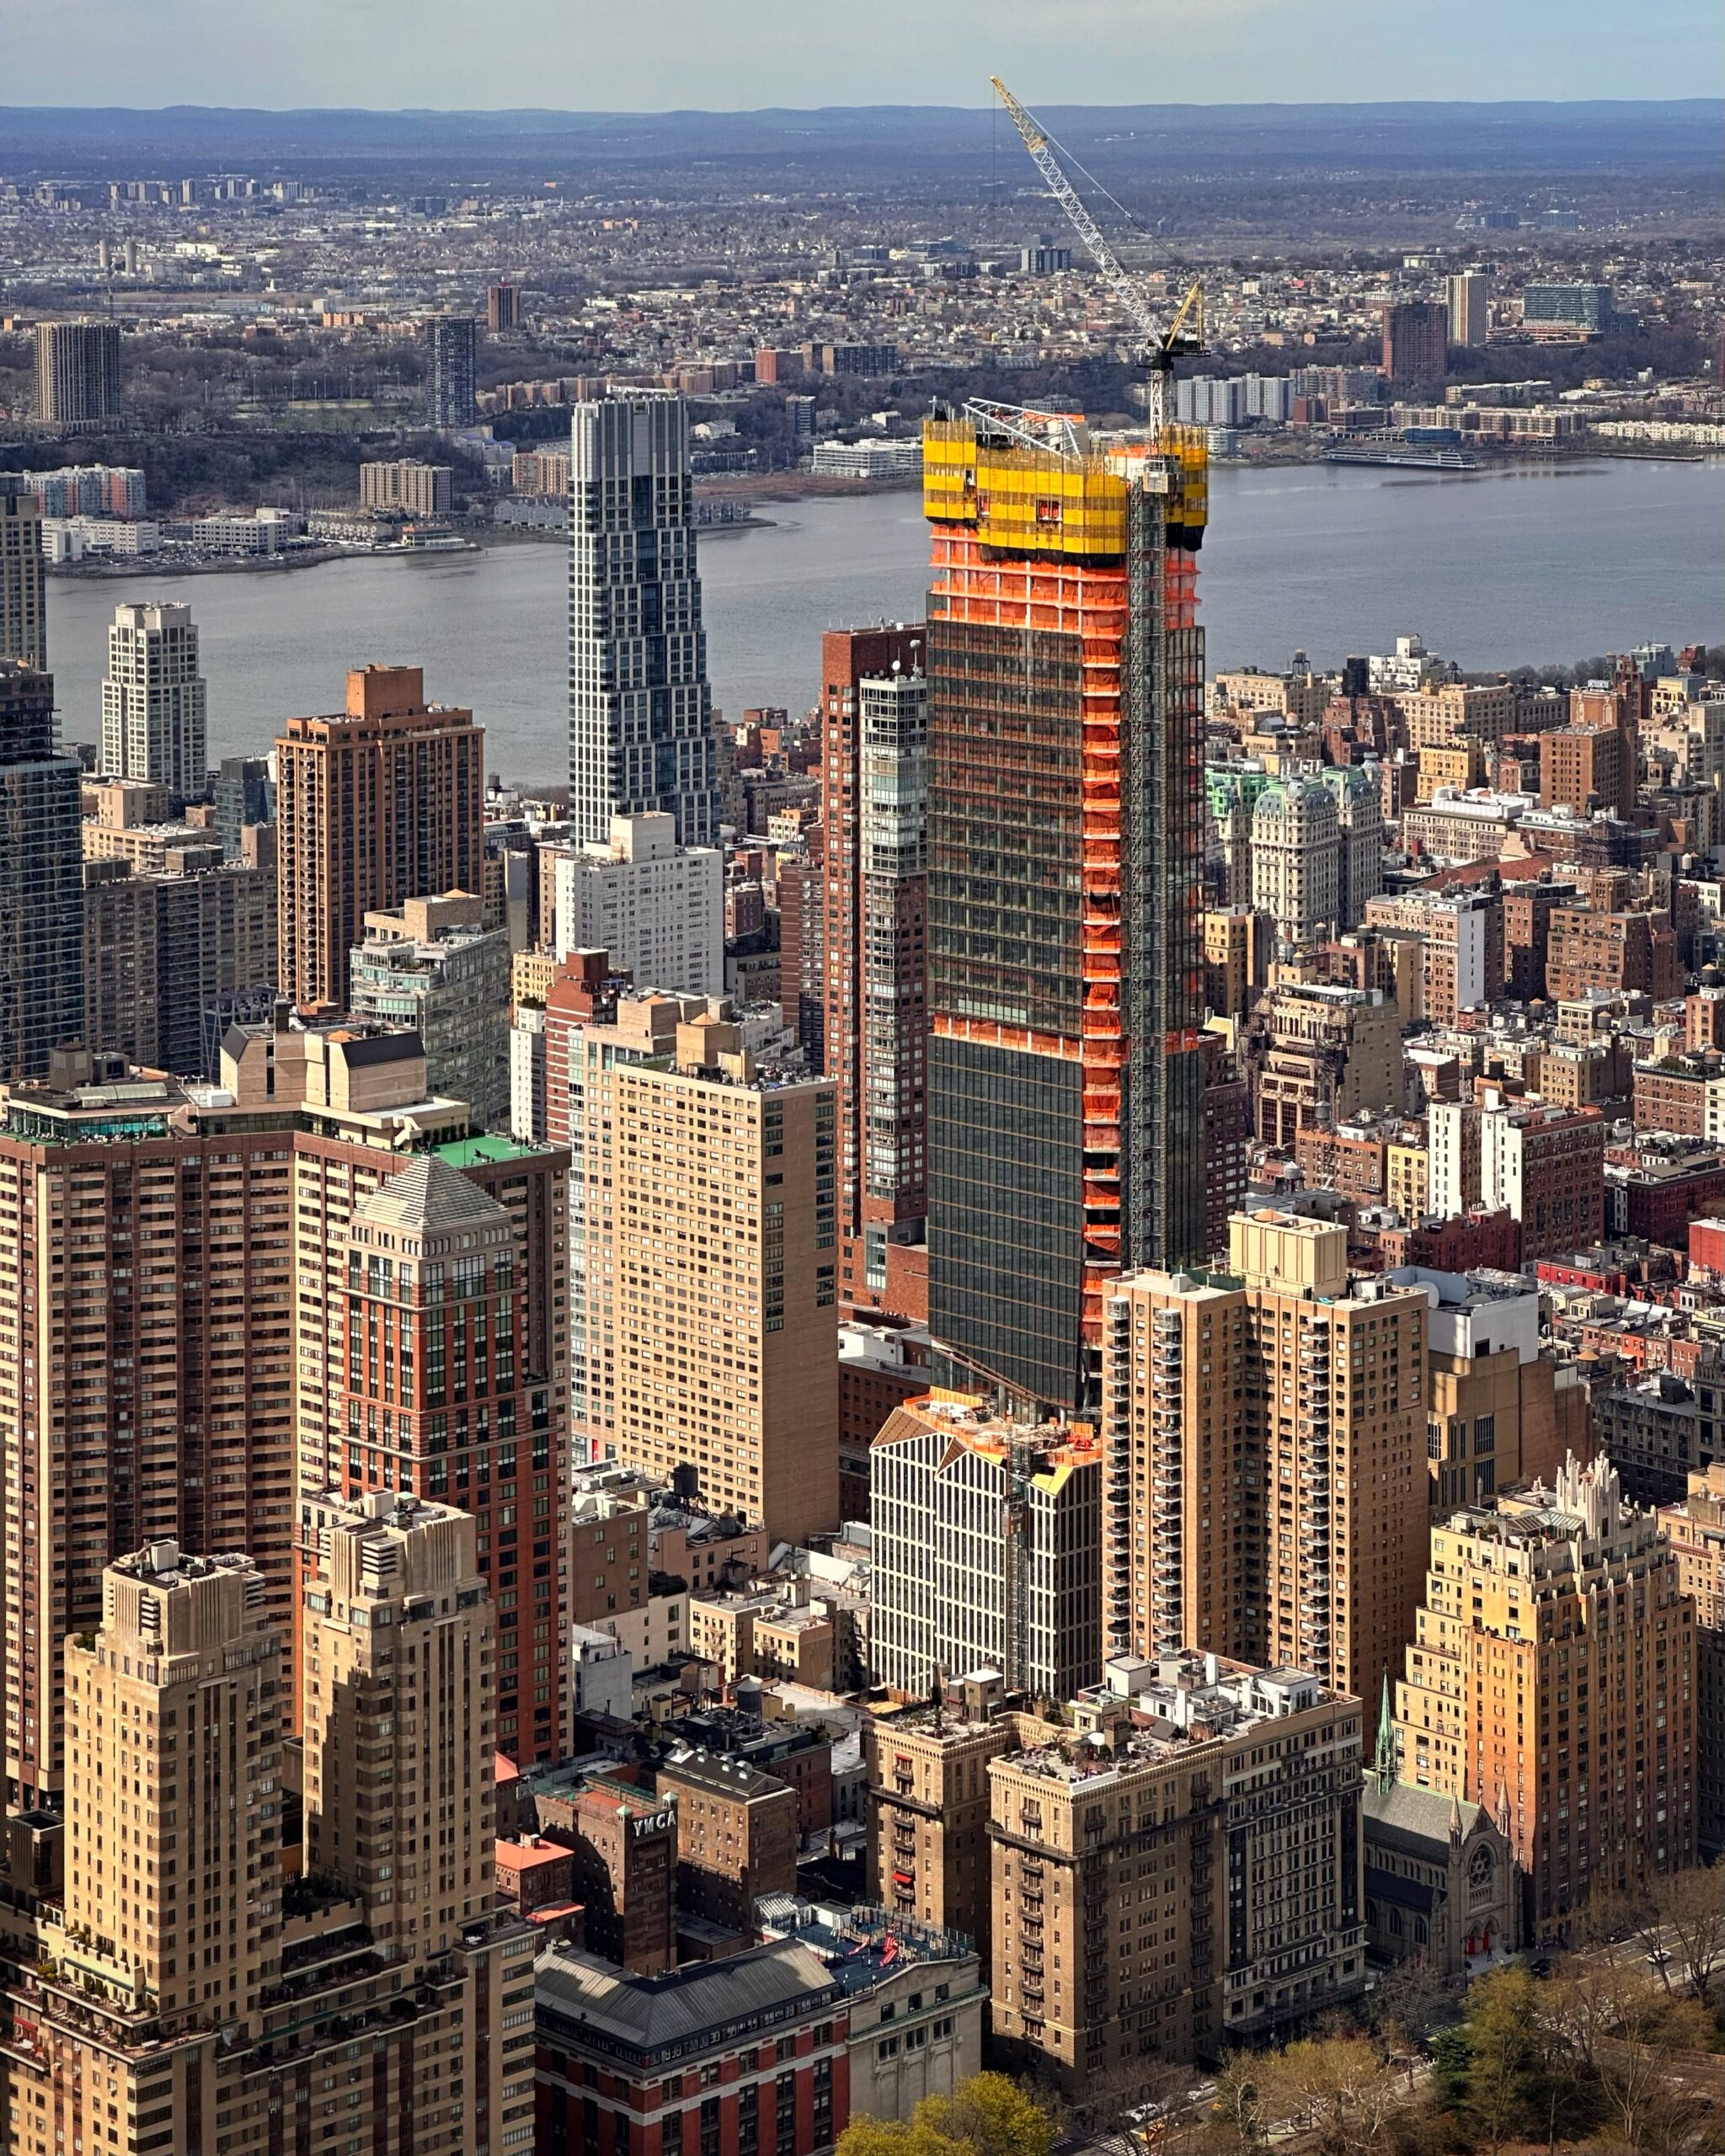
Photo by Michael Young
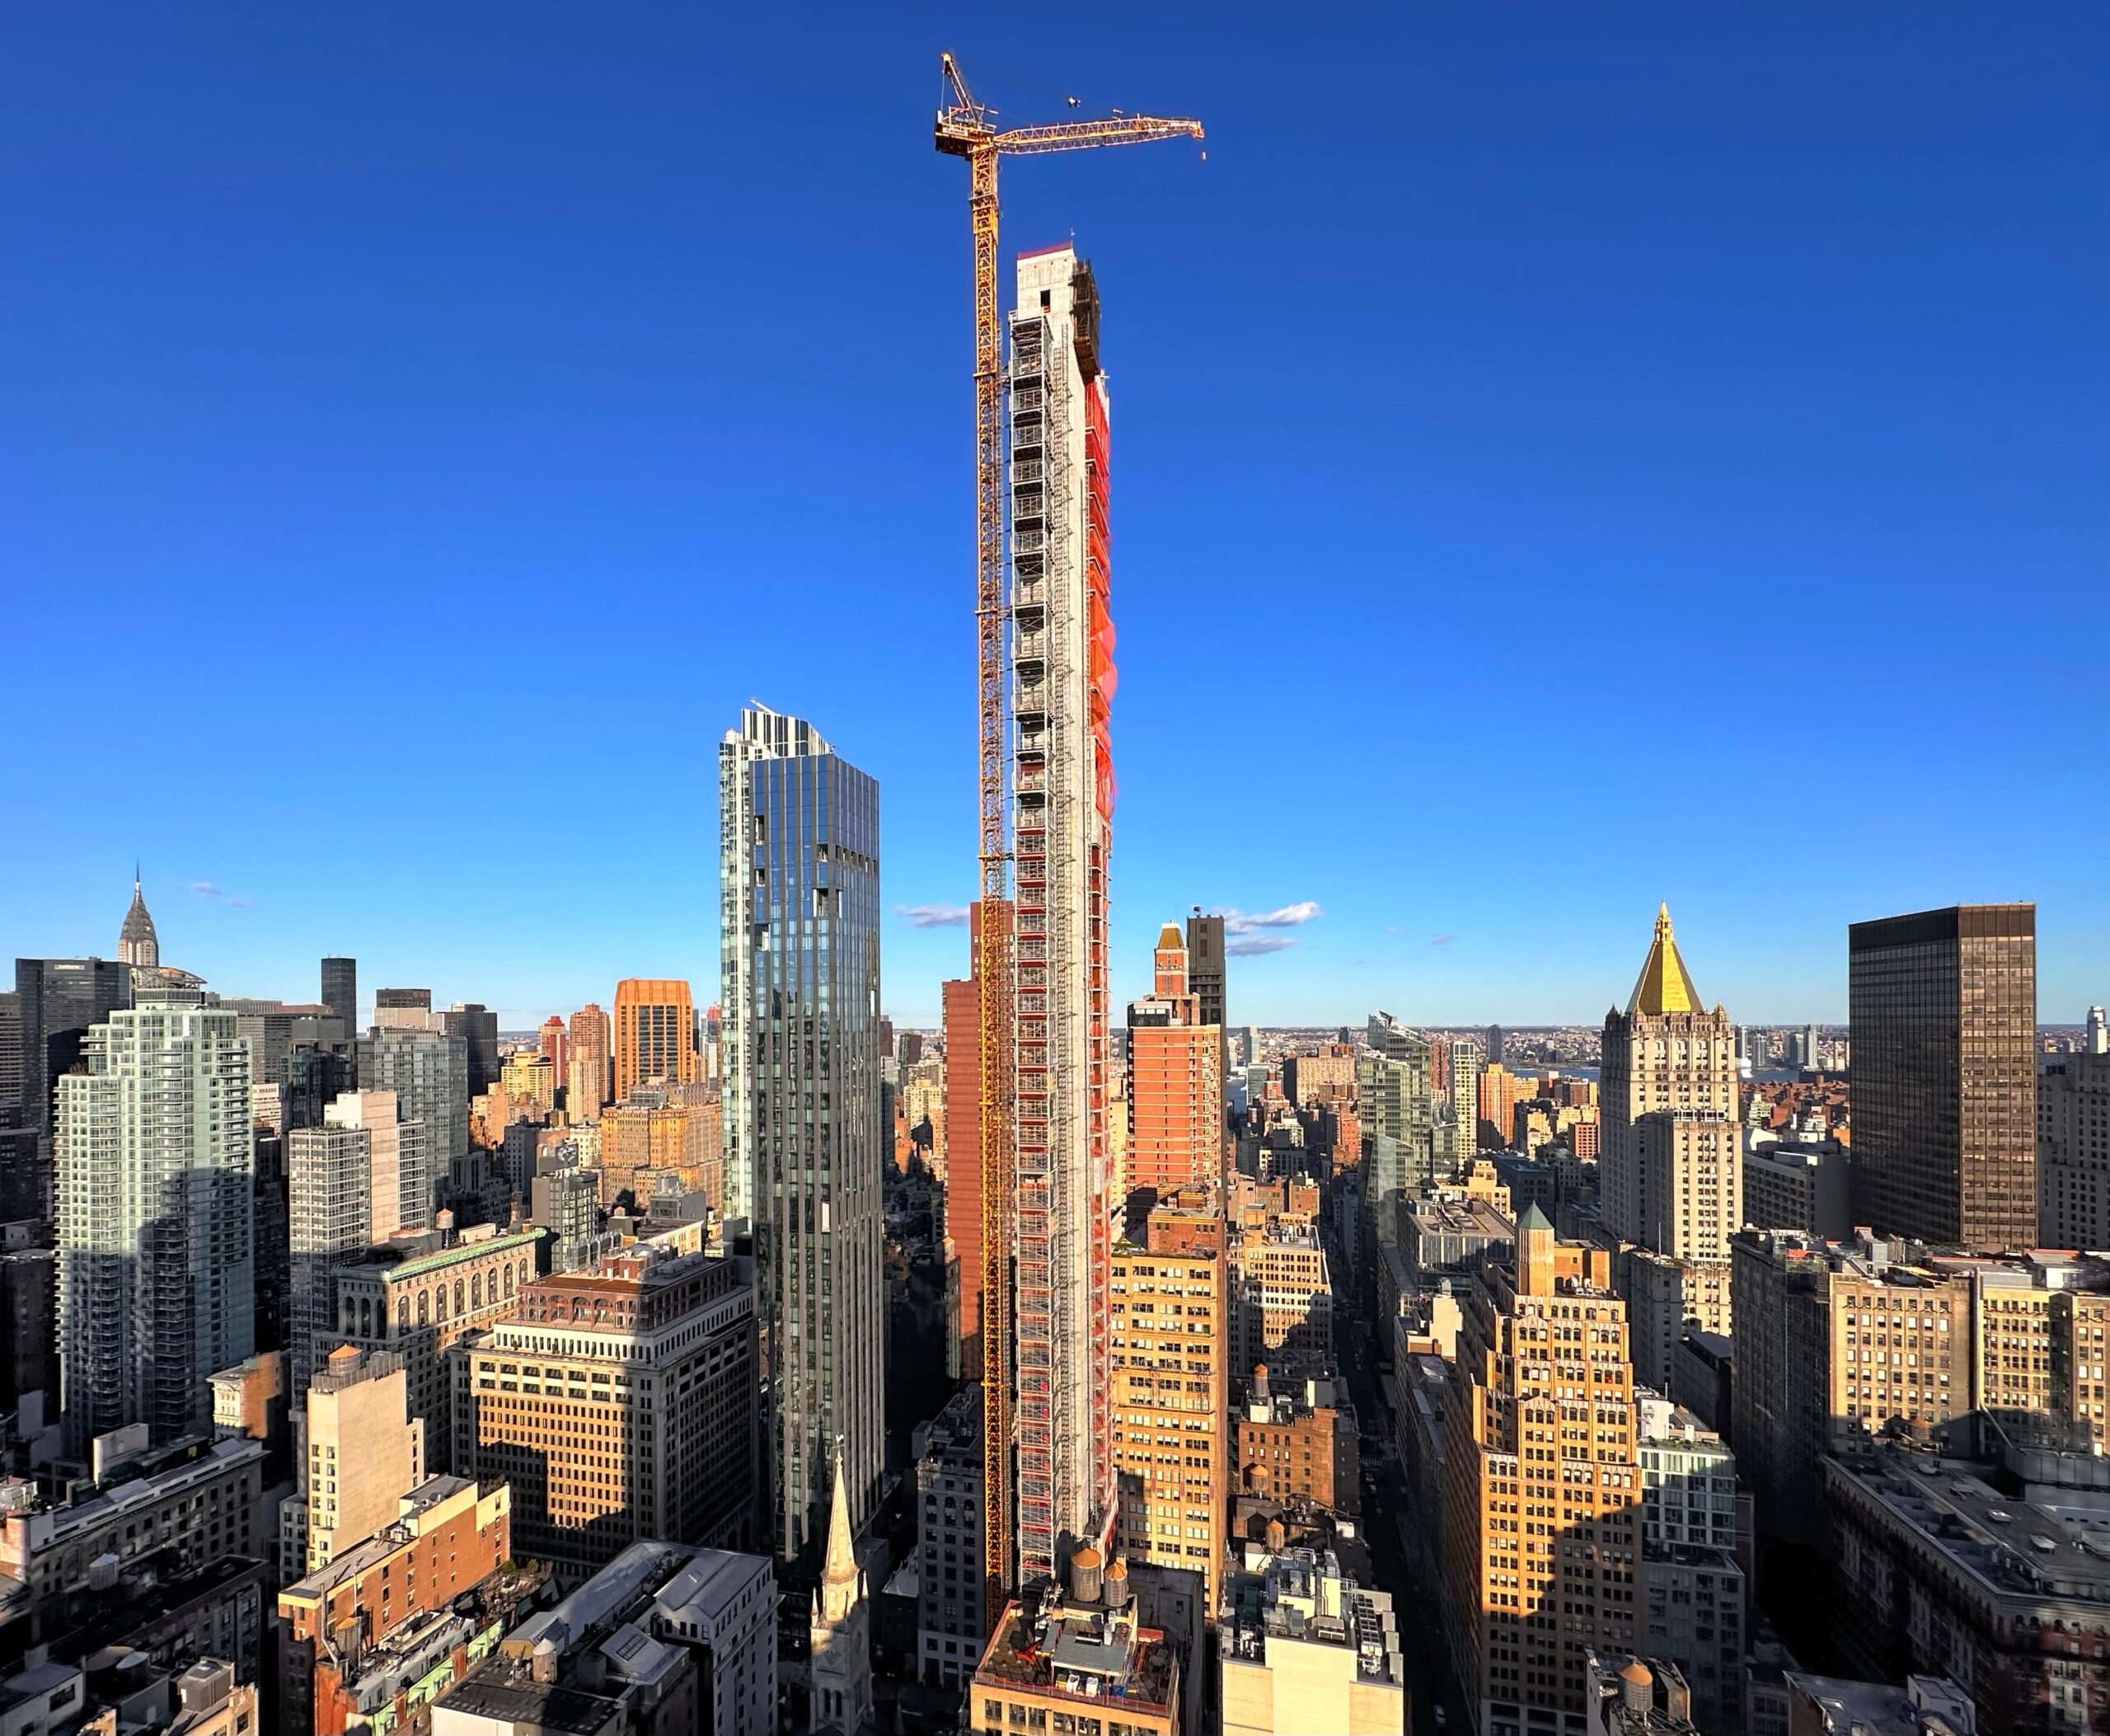
Photo by Michael Young
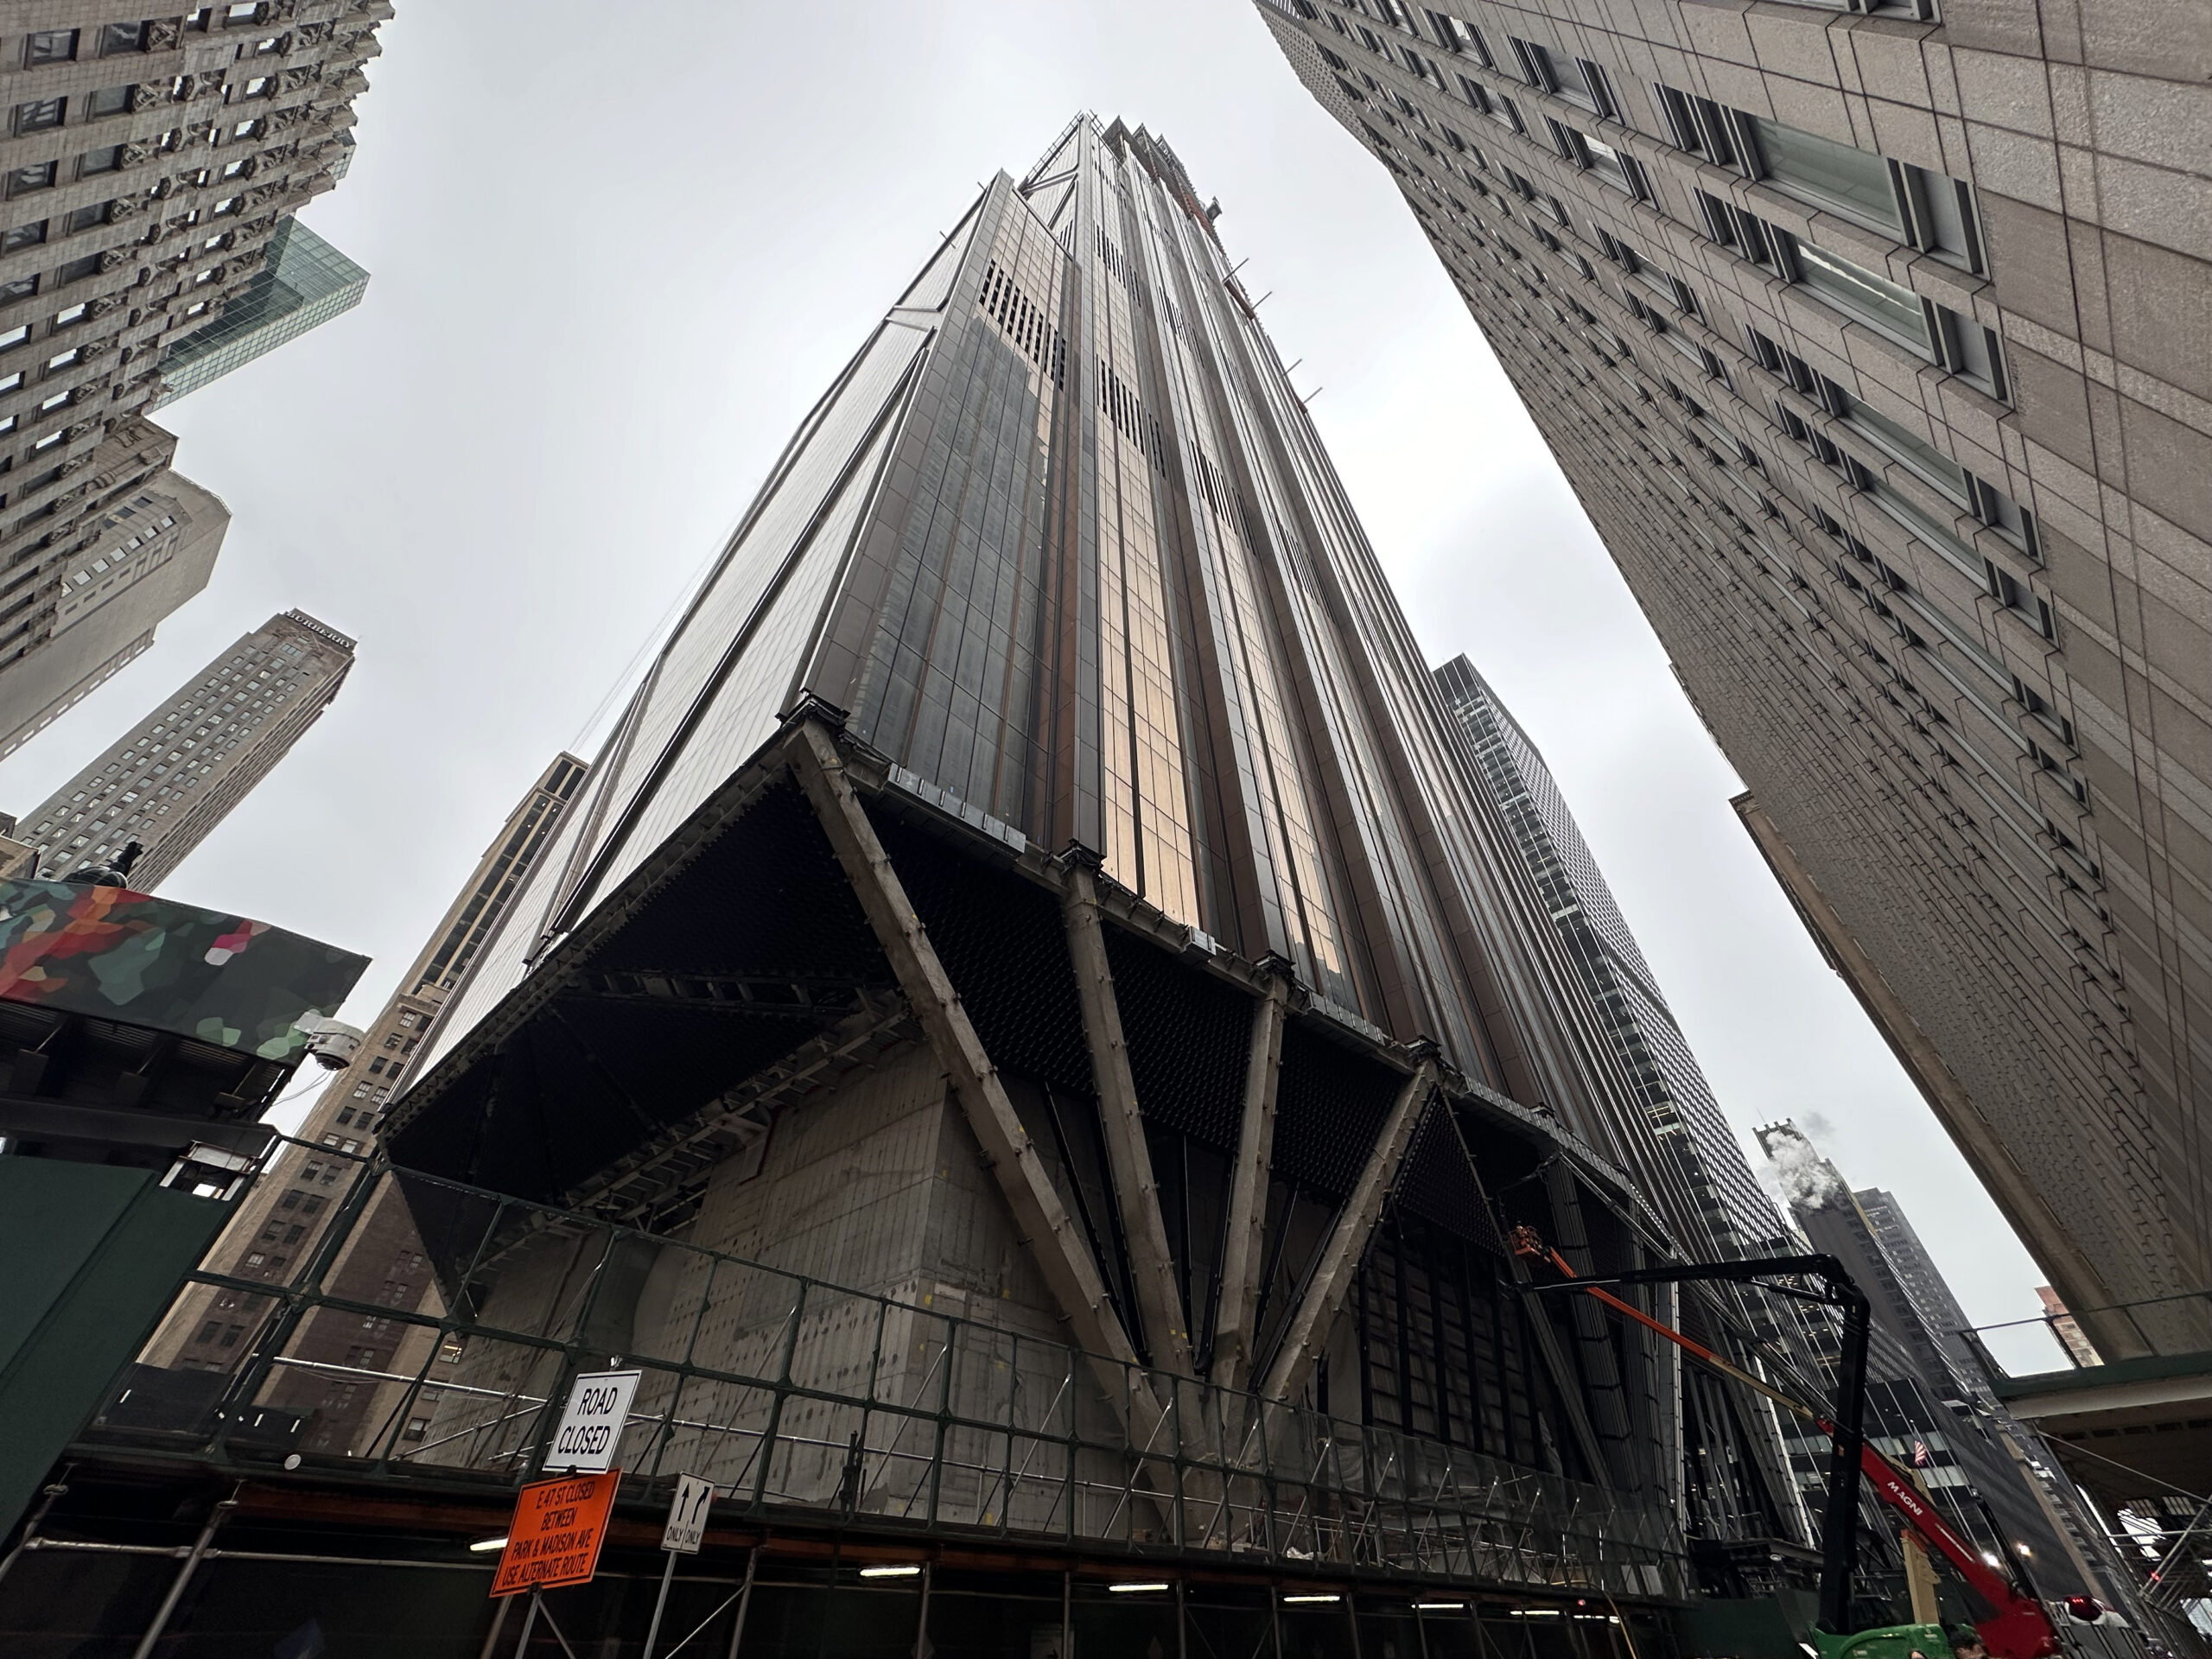
Photo by Michael Young
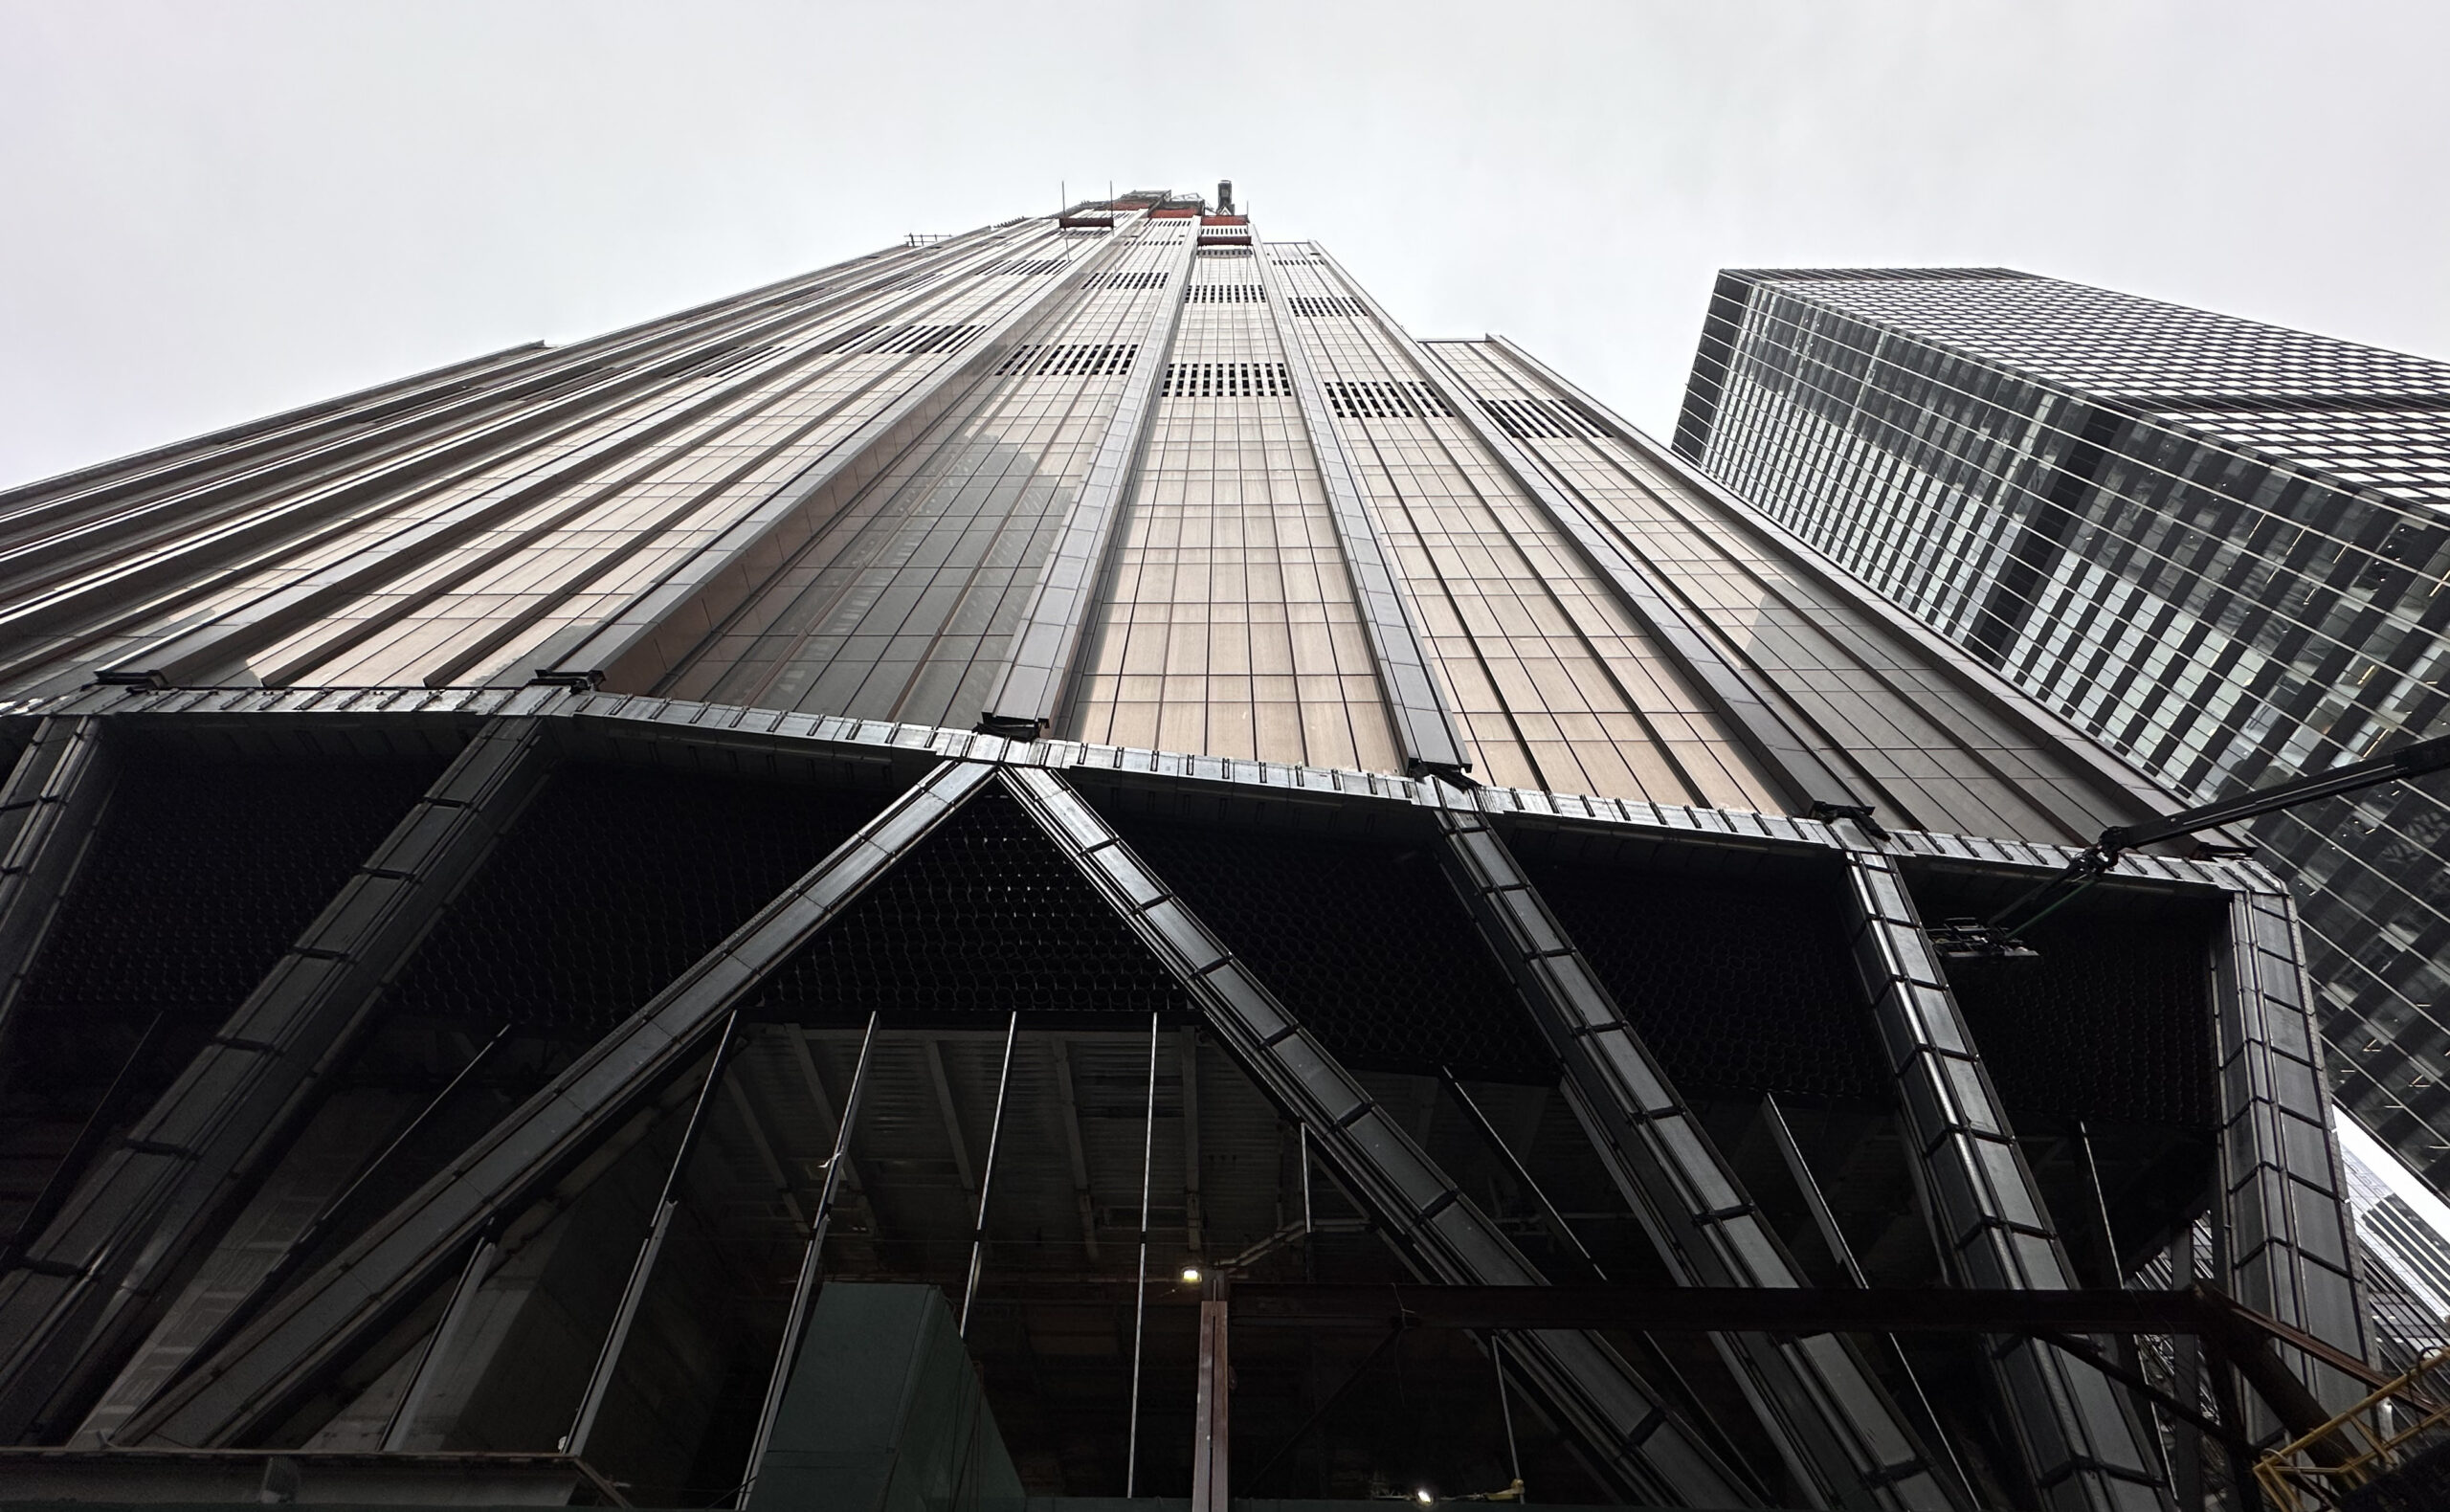
Photo by Michael Young
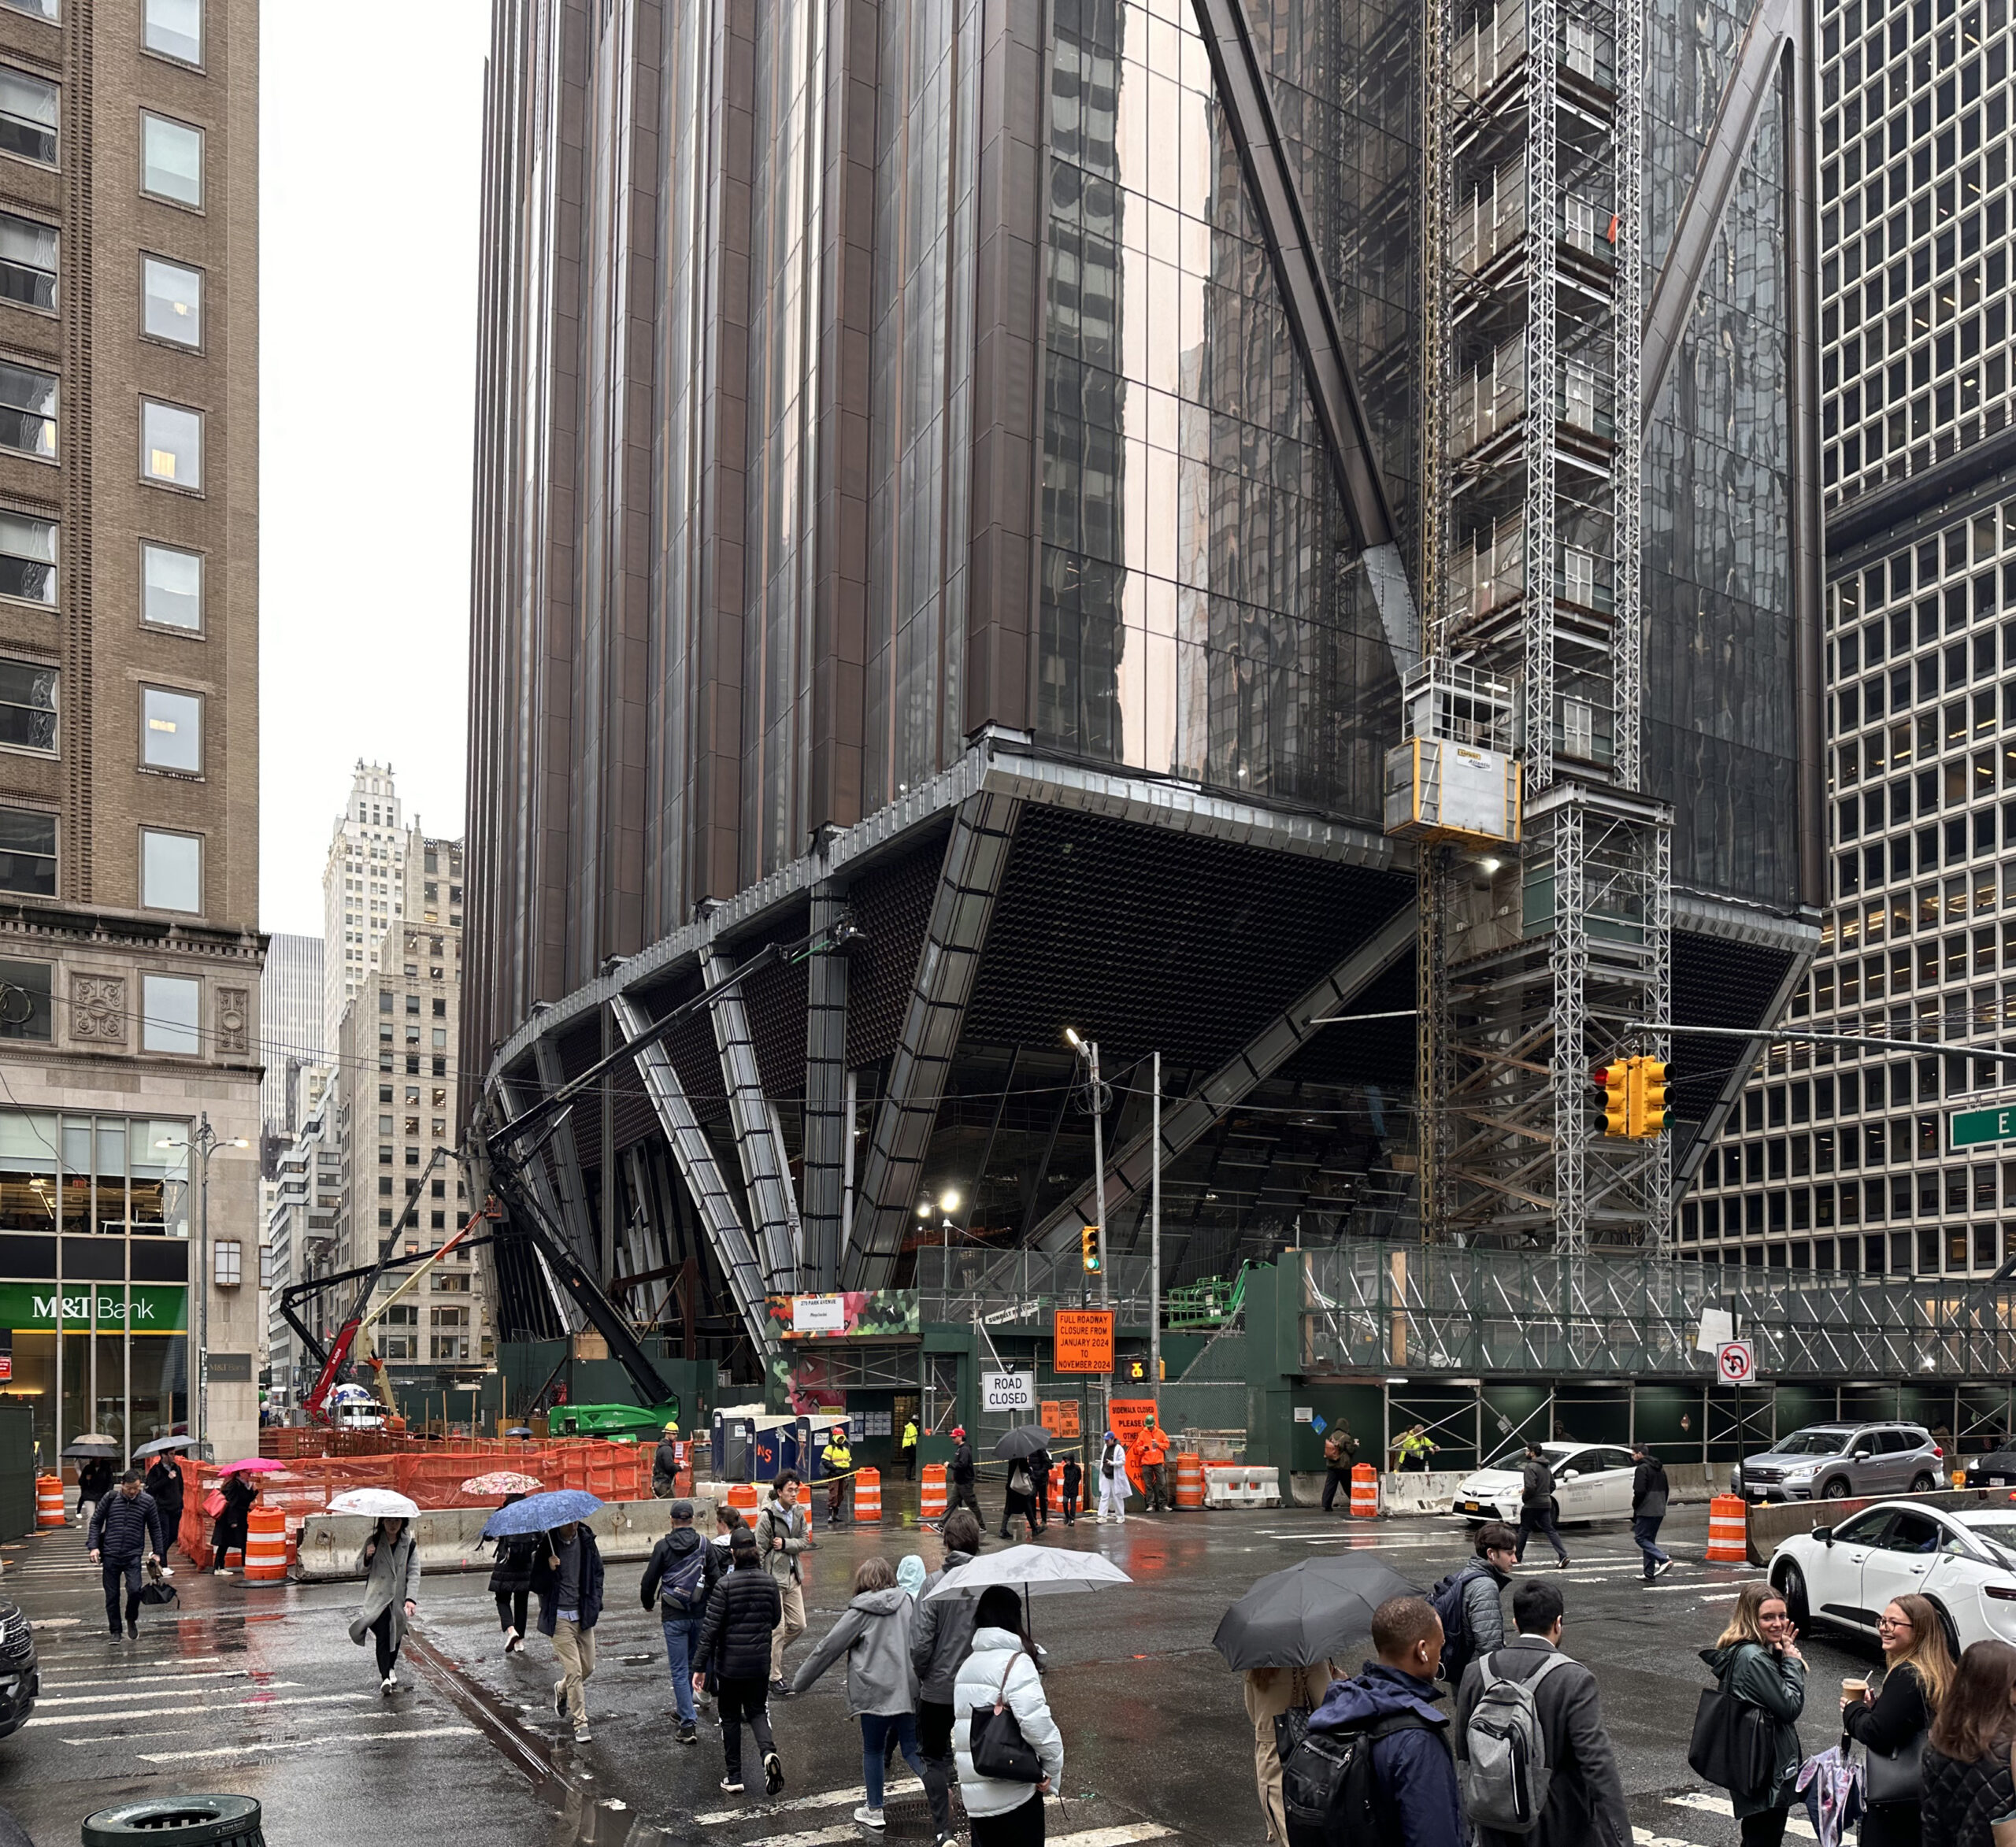
Photo by Michael Young
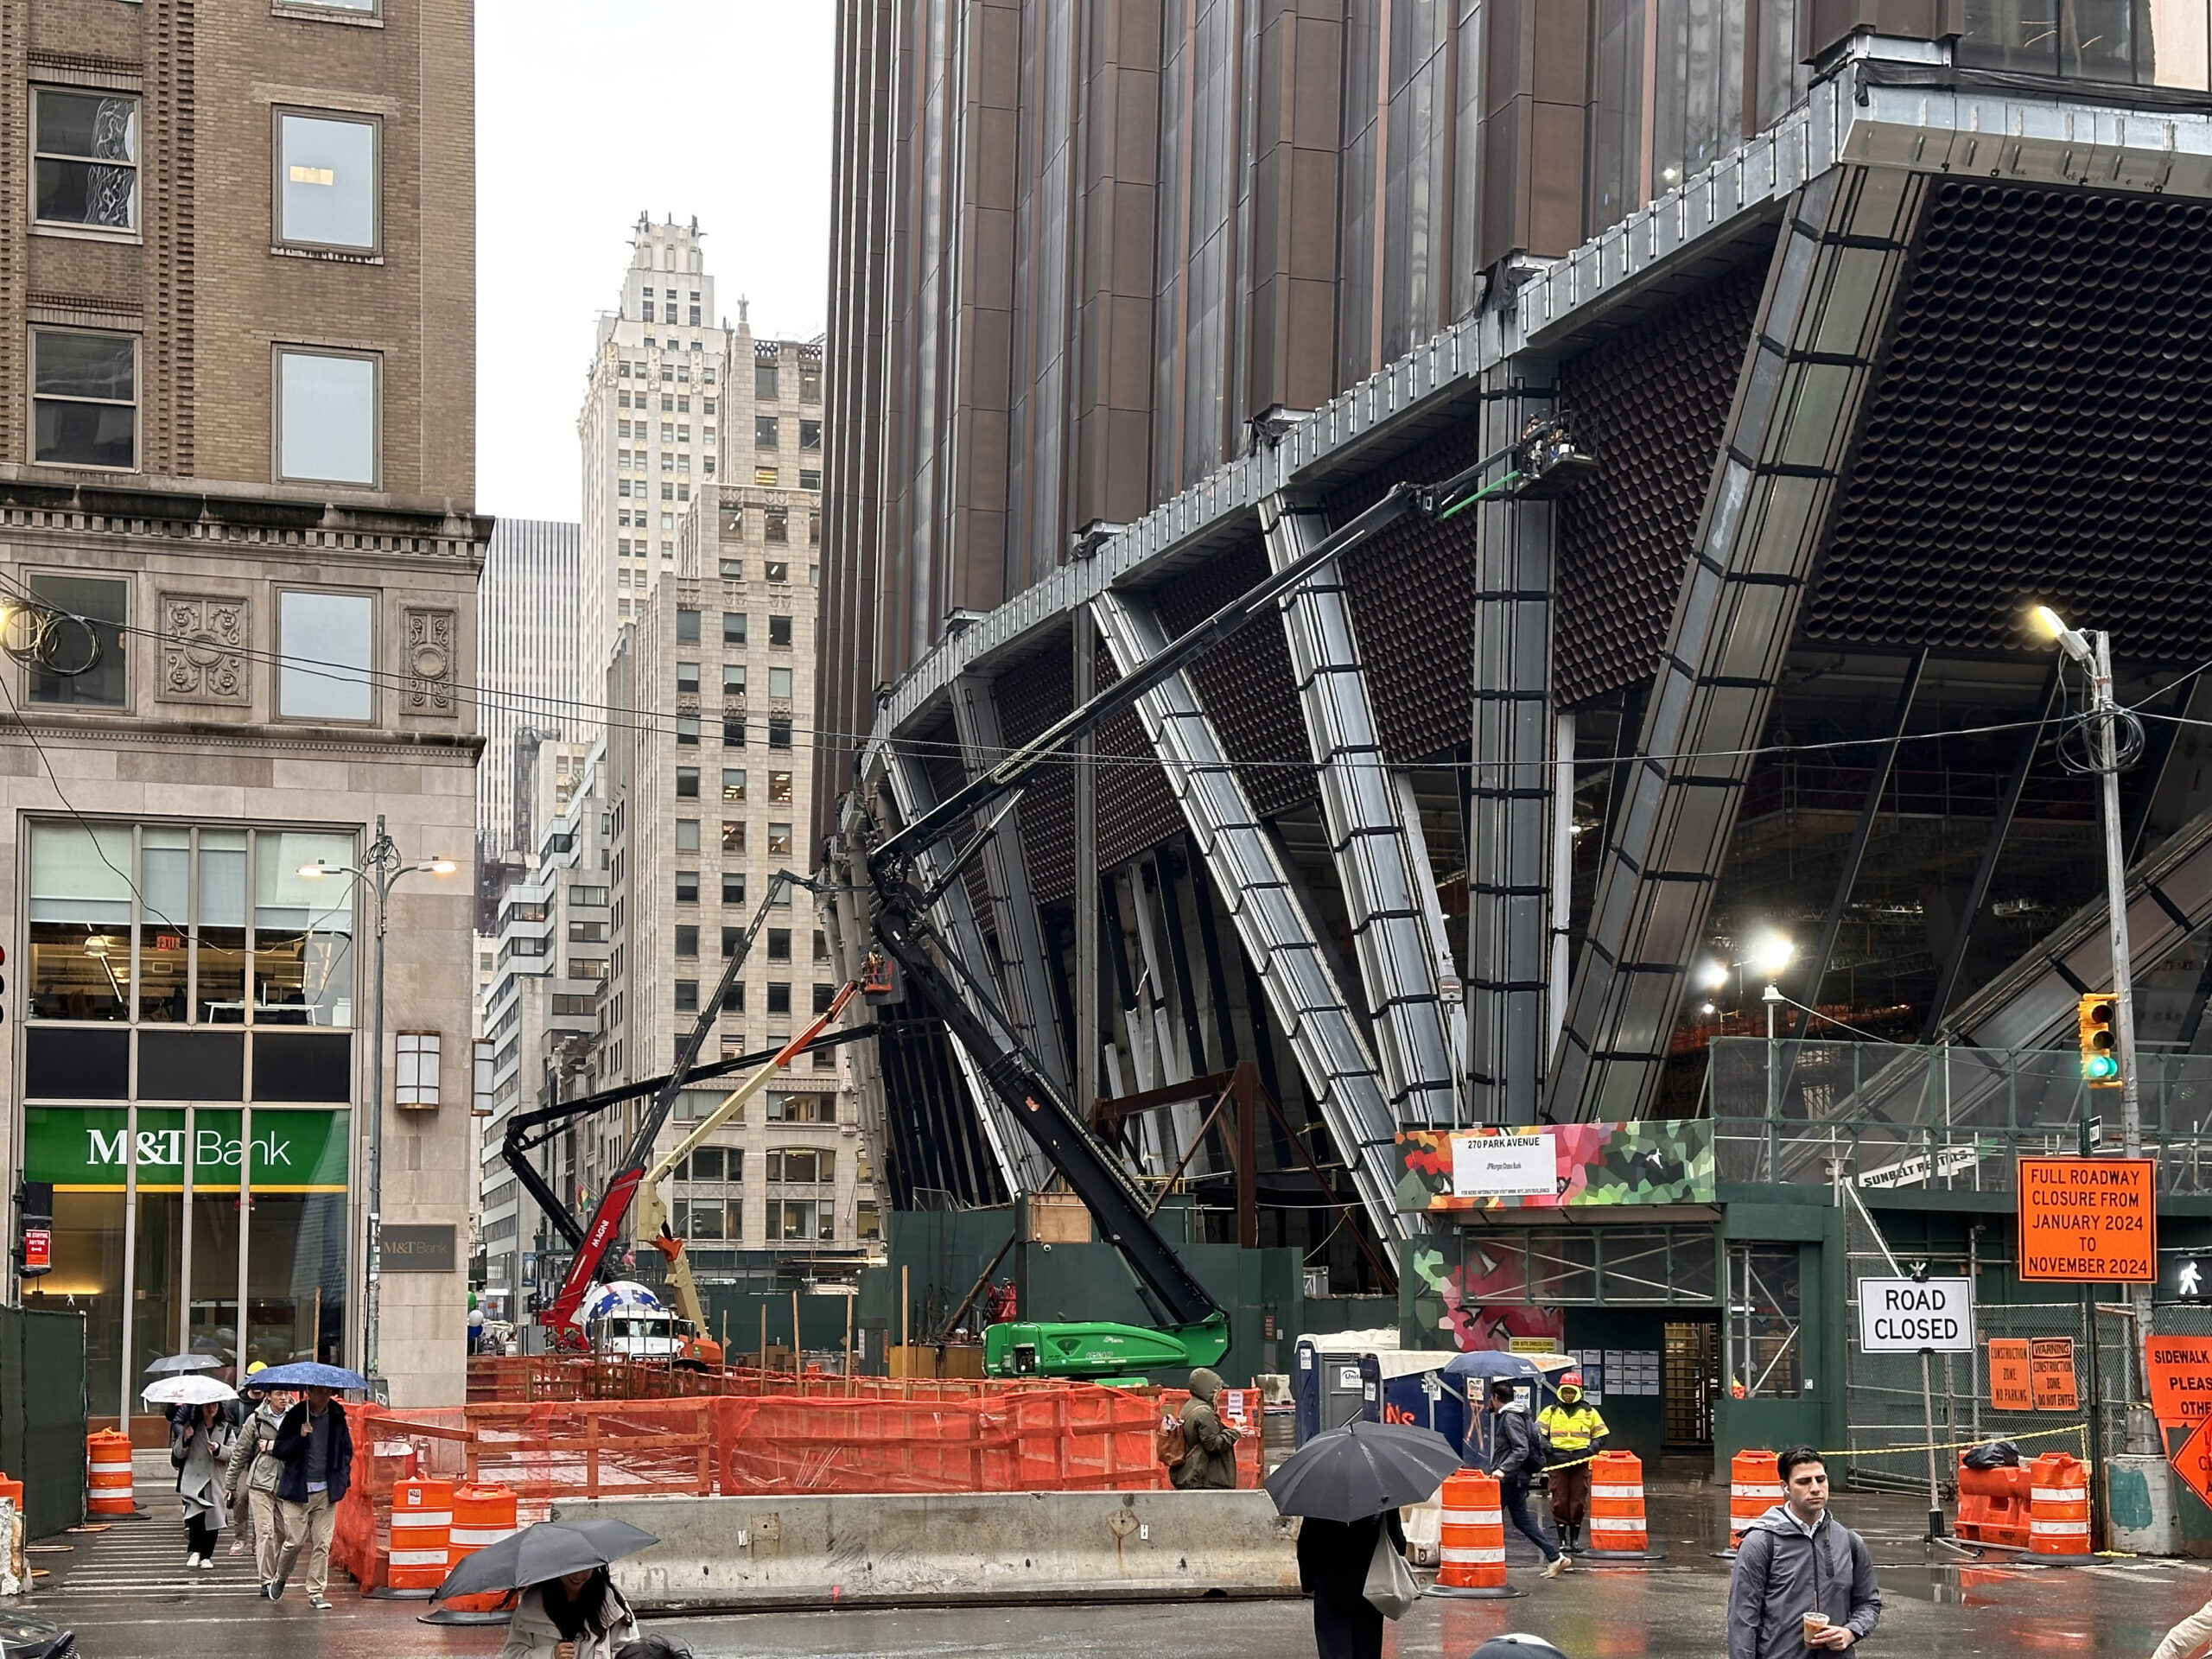
Photo by Michael Young
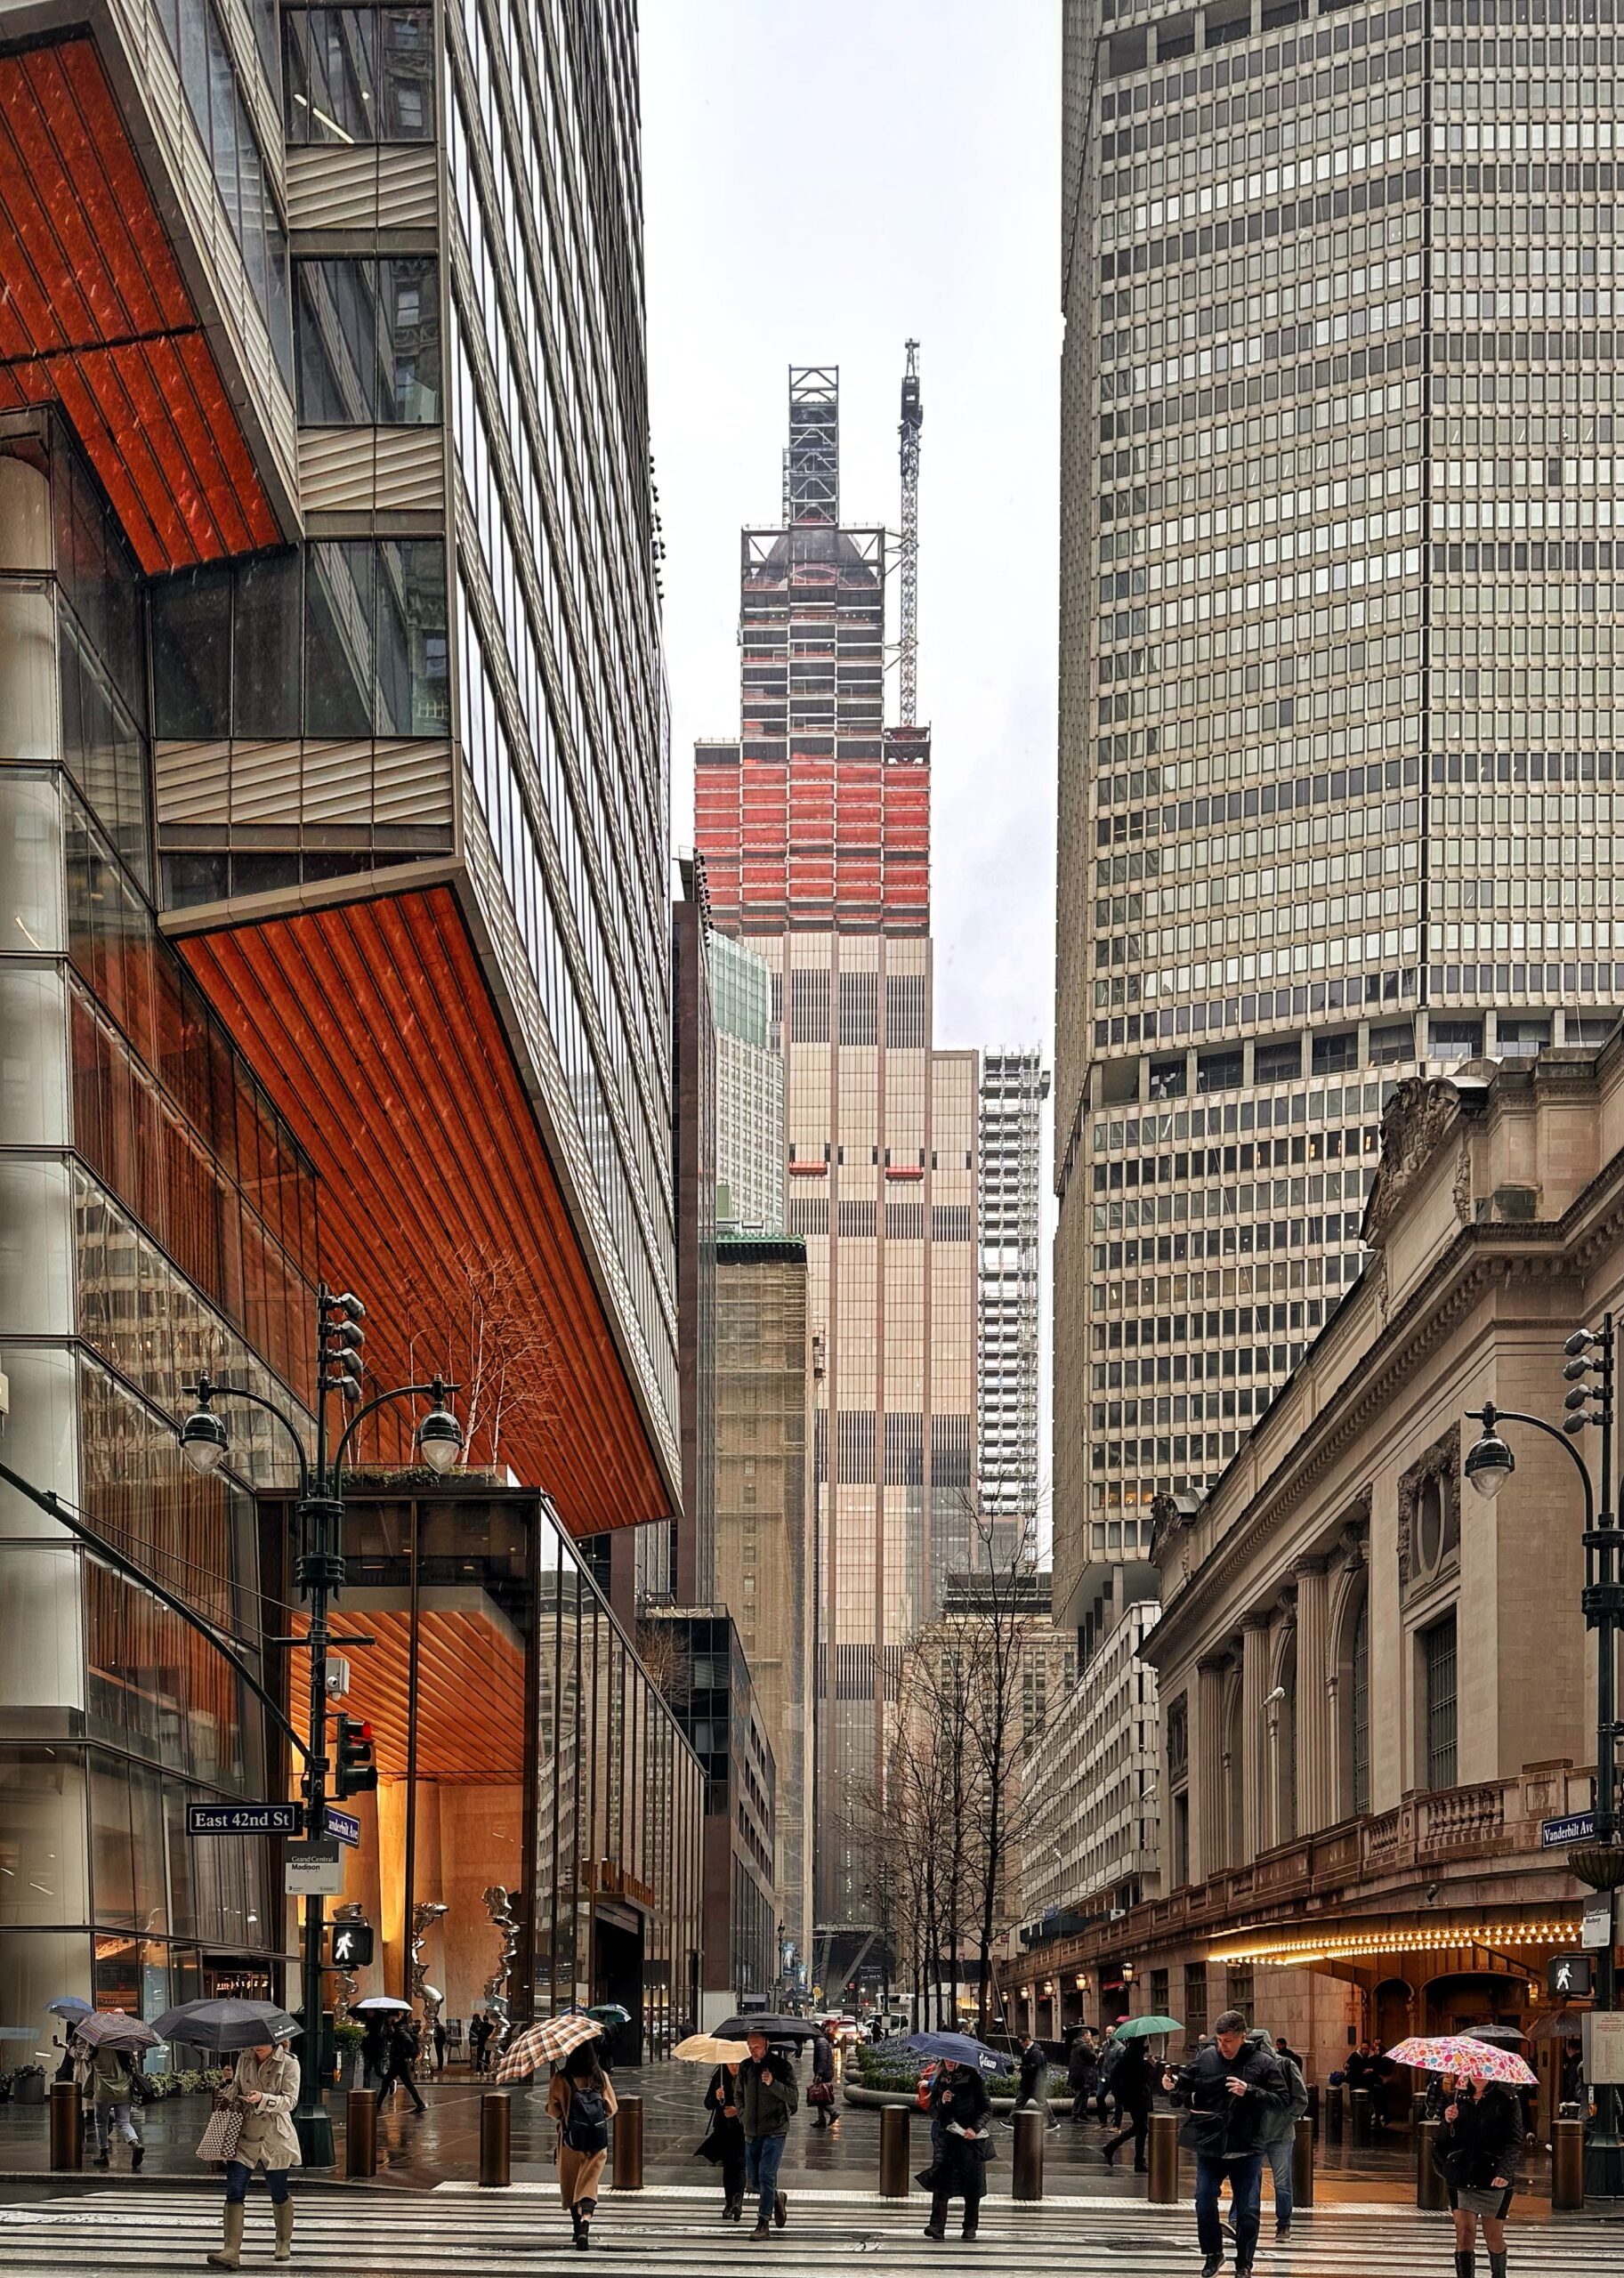
Photo by Michael Young
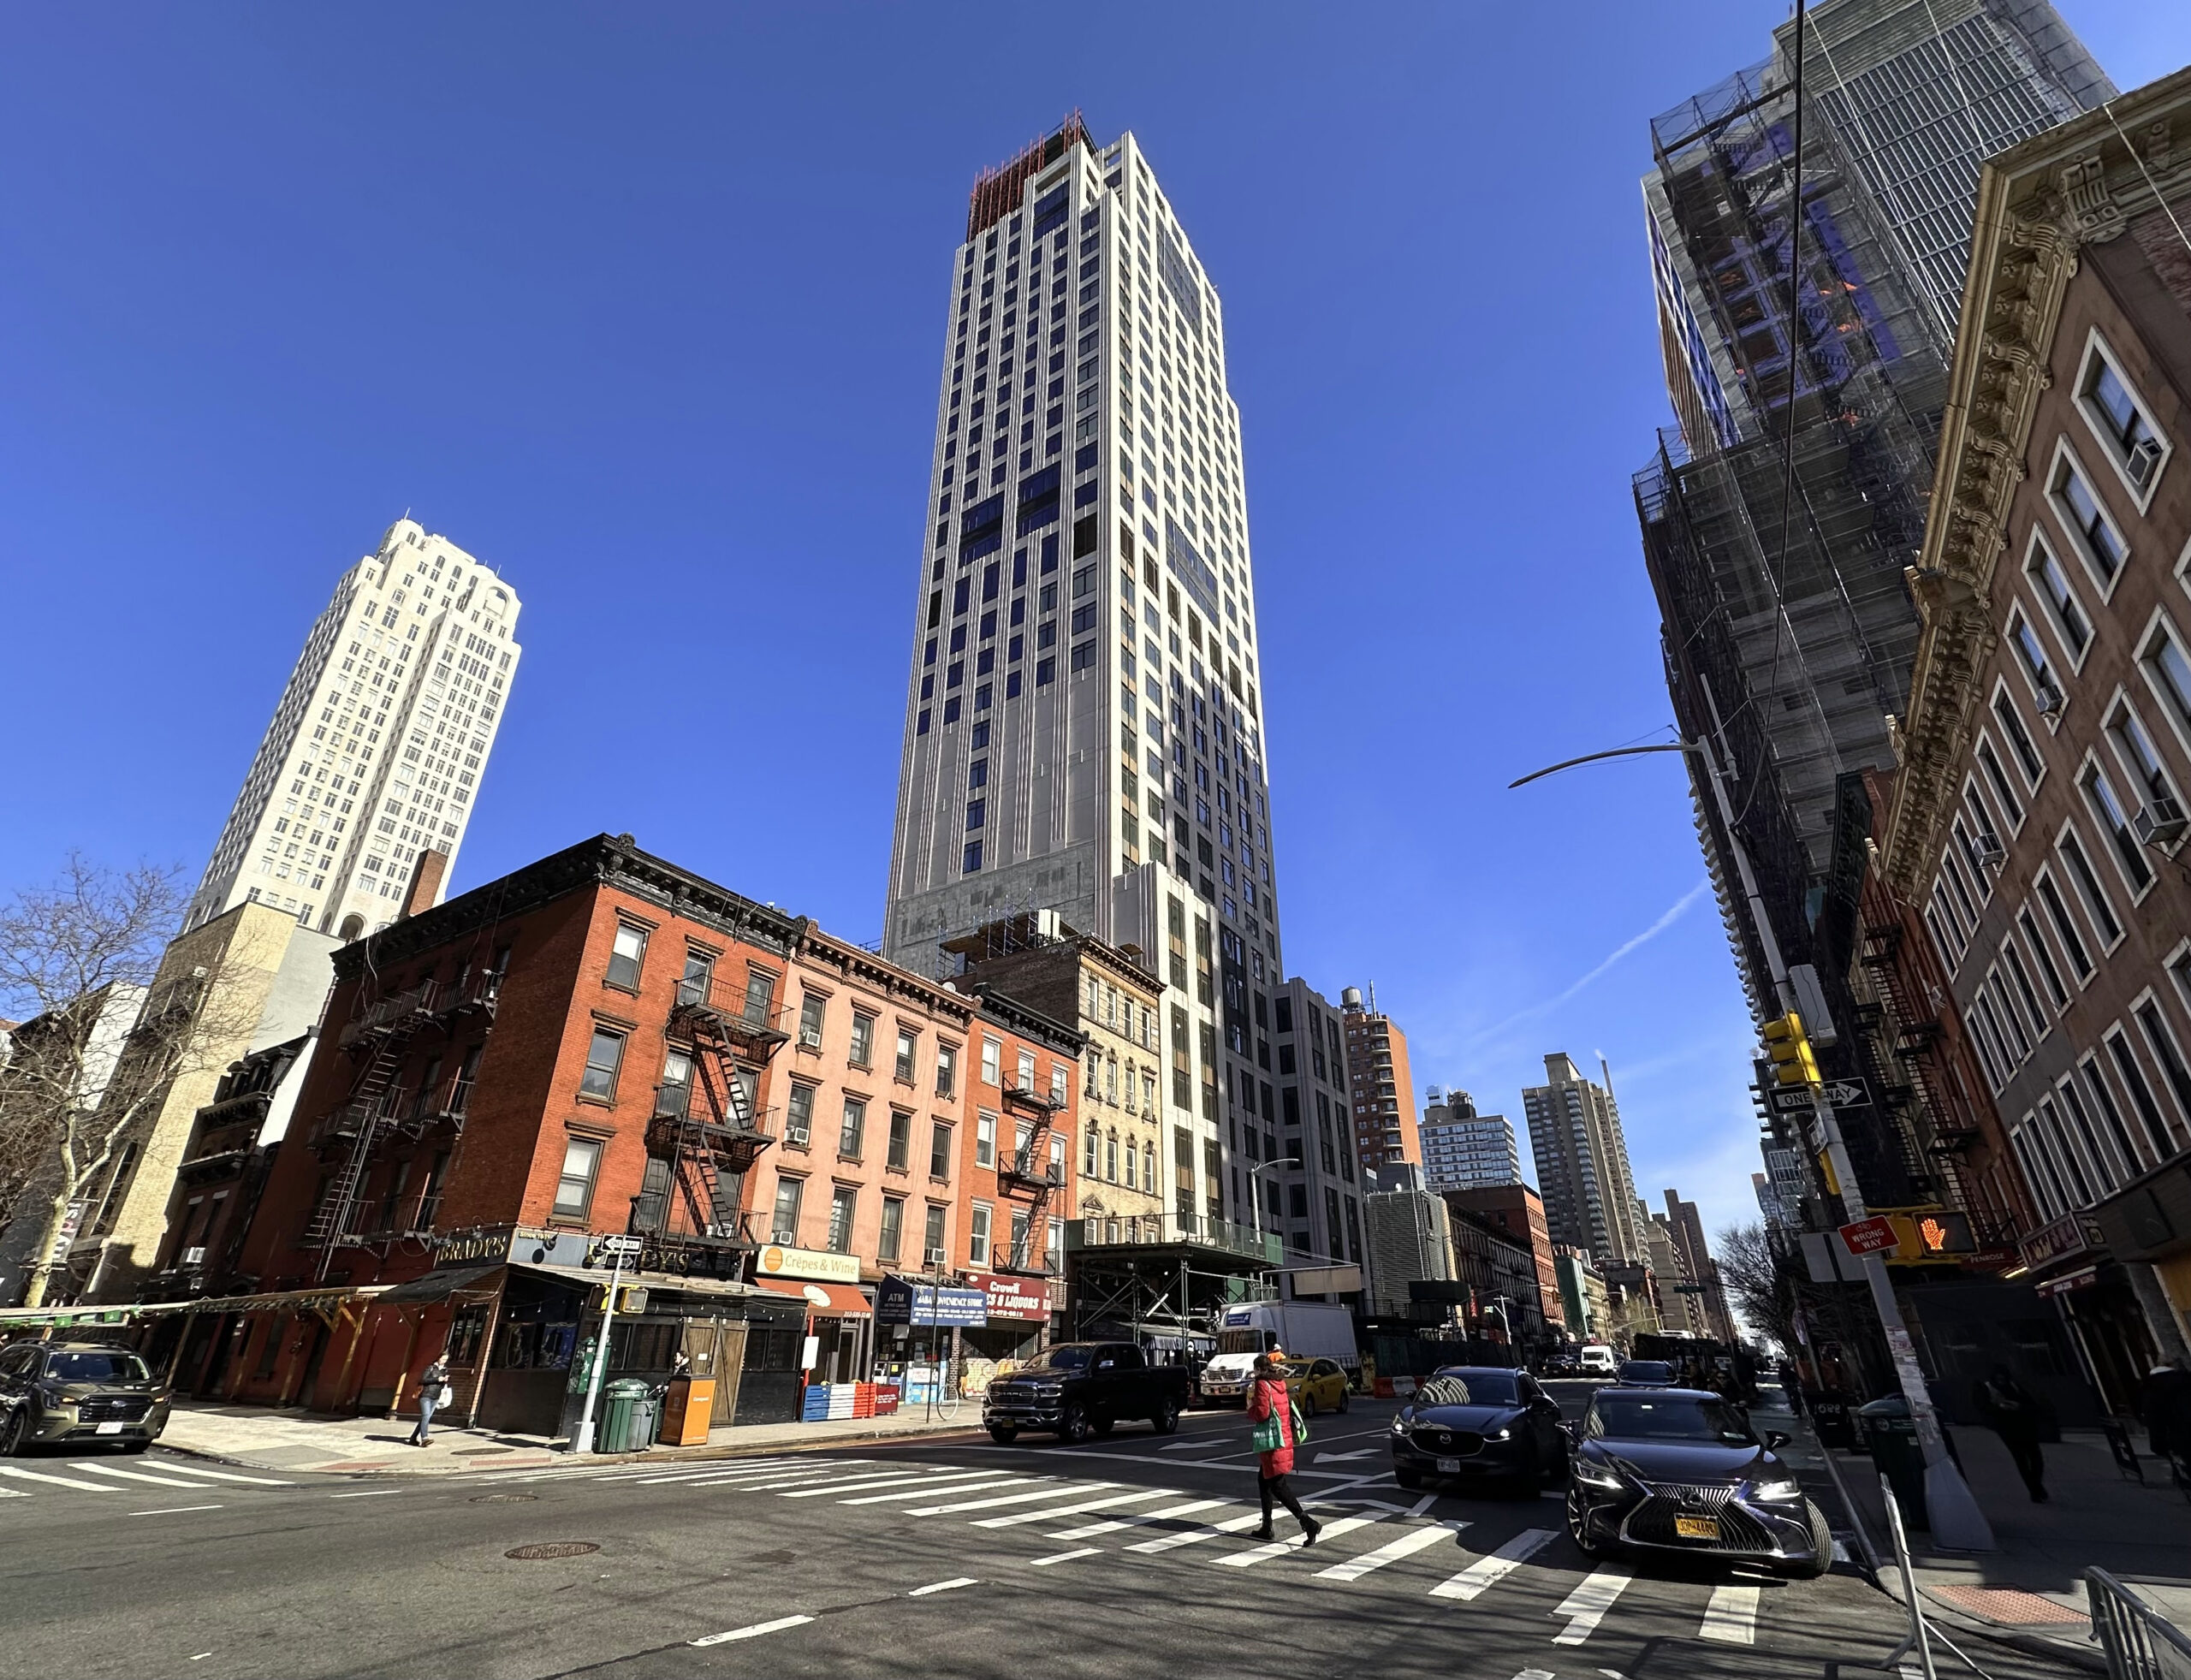
Photo by Michael Young
Photo by Michael Young
Photo by Michael Young
Photo by Michael Young
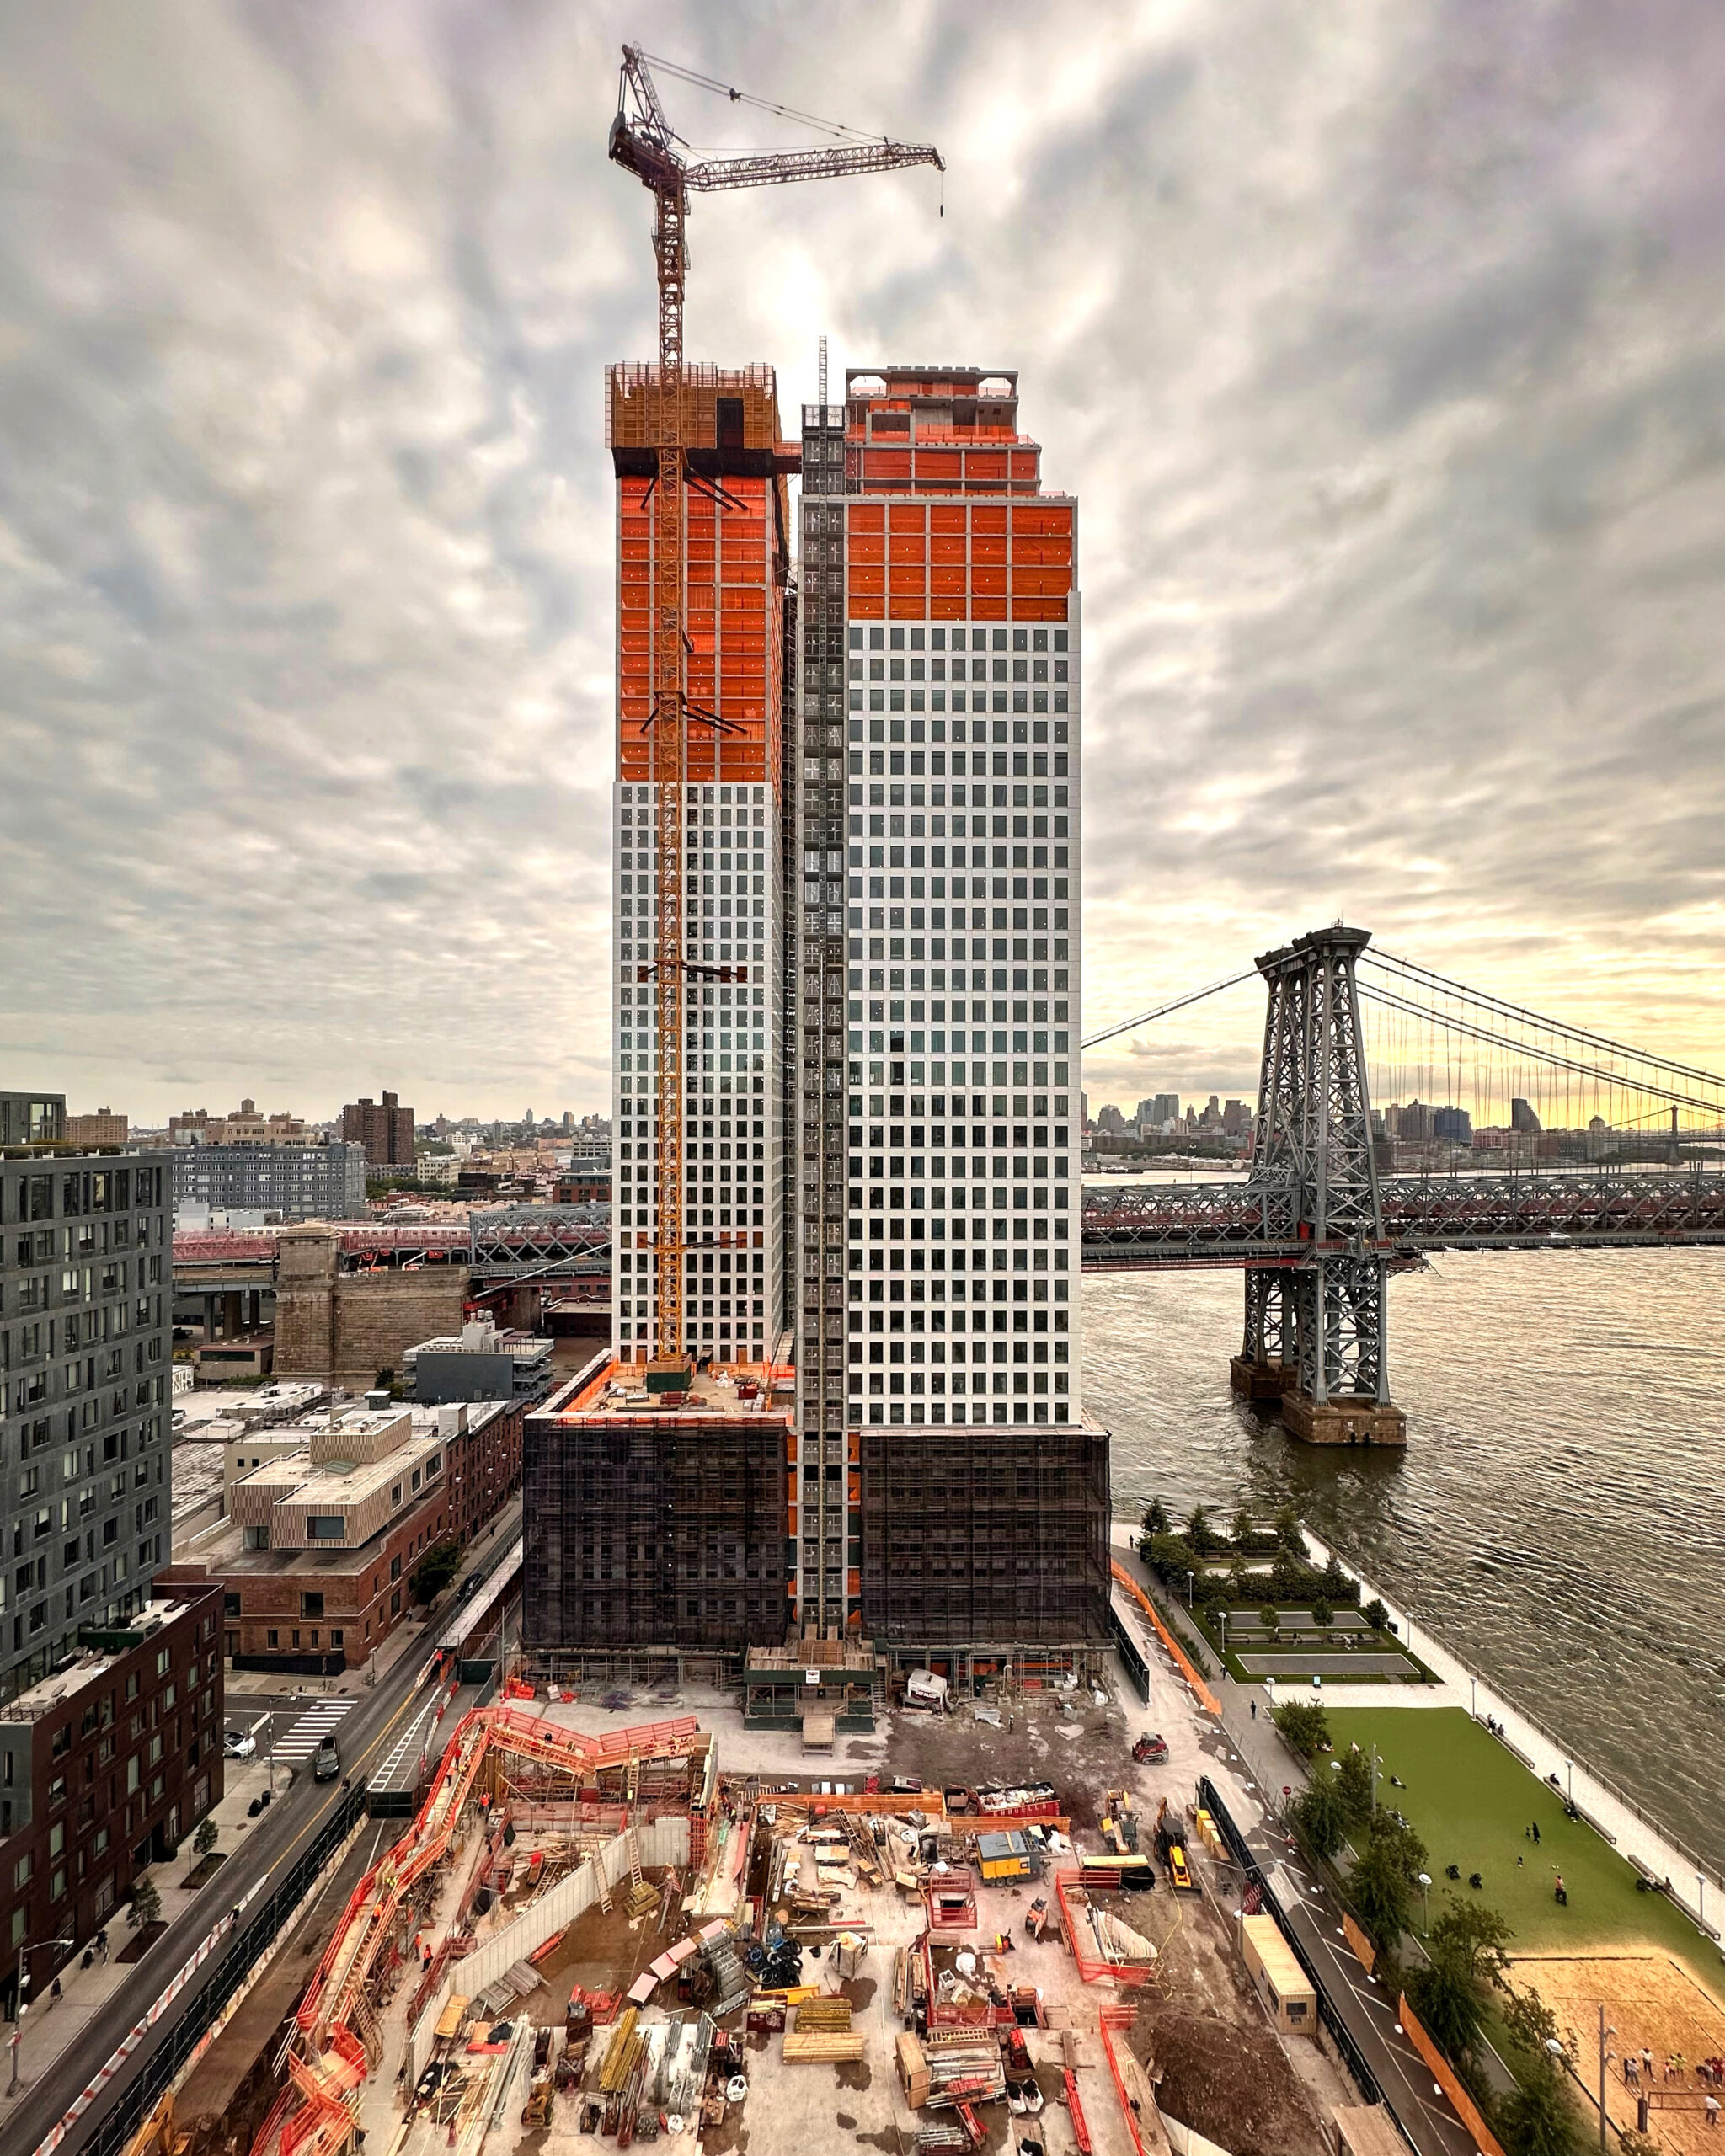
Photo by Michael Young
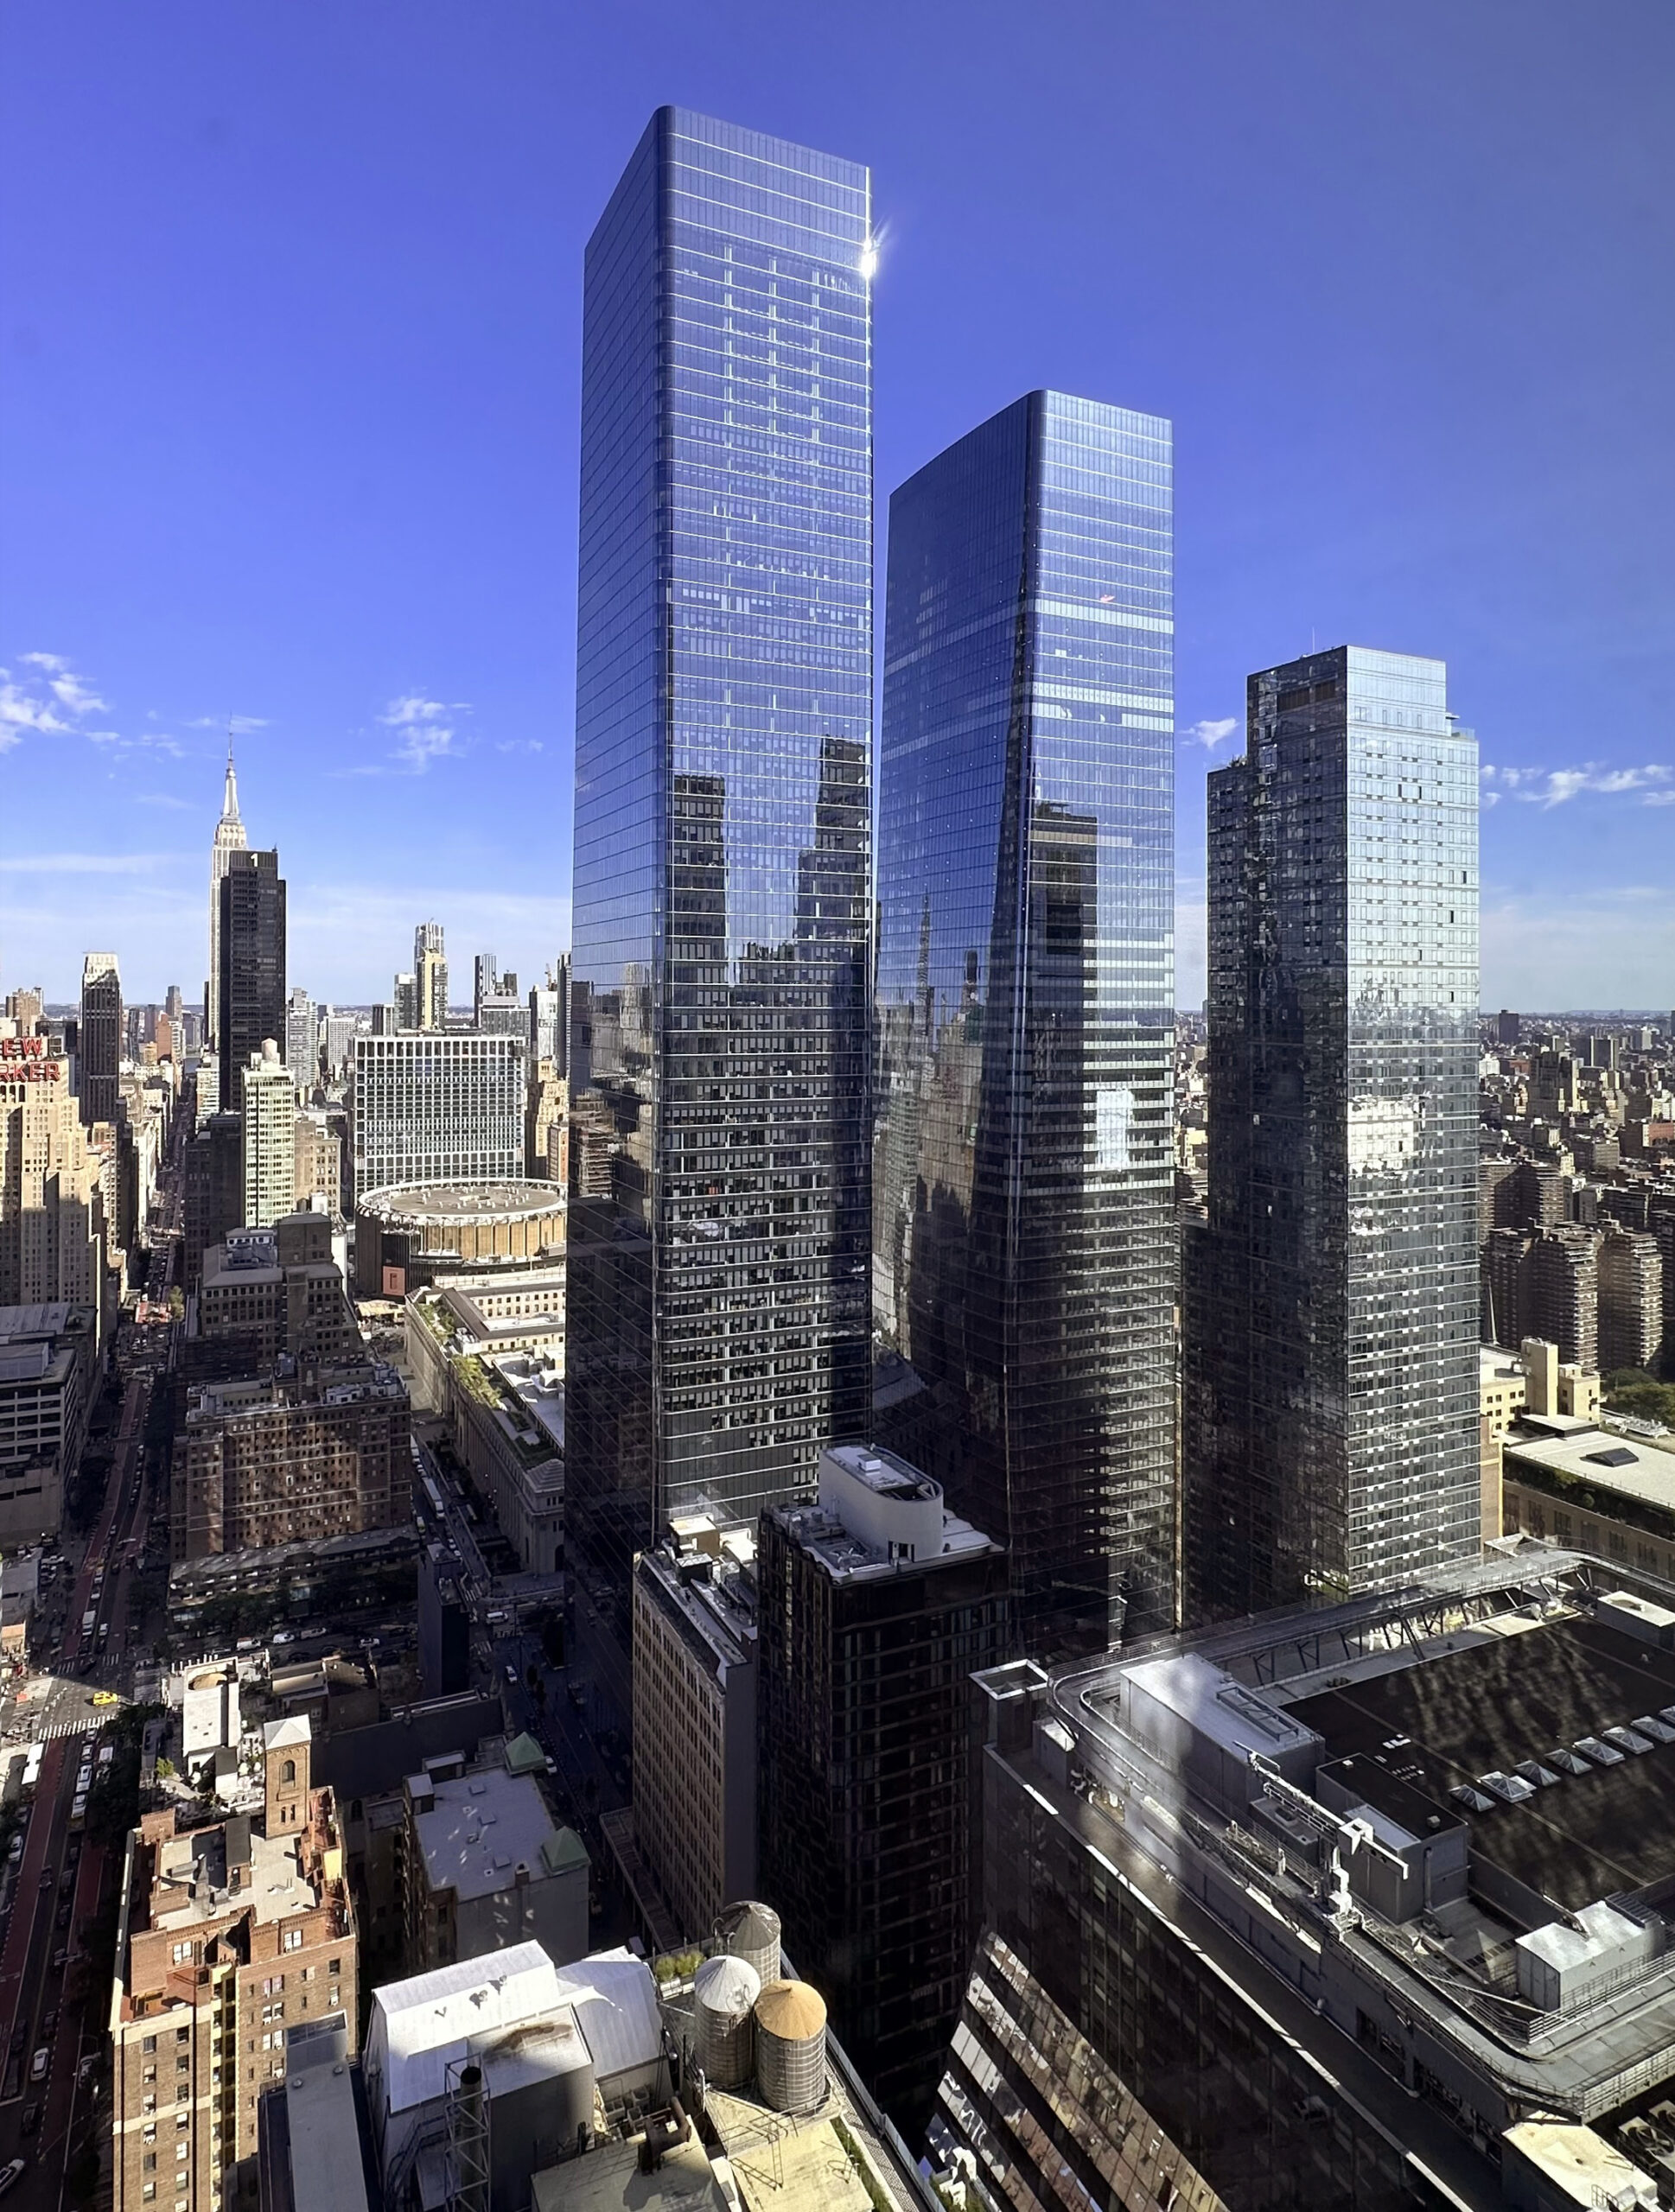
Photo by Michael Young

Photo by Michael Young
Subscribe to YIMBY’s daily e-mail
![]()
Follow YIMBYgram for real-time photo updates
Like YIMBY on Facebook
Follow YIMBY’s Twitter for the latest in YIMBYnews
New York is in a building boom!
I want to know about 430 main street. Roosevelt Island, New York, NY. Is there any condo there for sale?
we were hoping as we suggested in the last quarterly report that you would identify the buildings.
A building boom and yet too little middle and affordable housing? Make it make sense. Well, one thing is there’s a glut of high end luxury housing, including many of the tall but mostly empty and low unit buildings featured here. Volume is not always correlated with height (Tip: check average unit ceiling height per unit).
Manhattan is the most expensive metro city in the US – why should we create affordable housing here paid by tax payers? Build it somewhere else
We should because it’s the right thing to do, not that you know anything about that. Build it everywhere, including Manhattan.
Beautiful photos but very weak analysis. You completely missed the whole point because you grouped residential with hotel. Of all these record breaking permits, they are ENTIRELY residential. Since the passing of the special permit, hotel construction is actually at record lows, basically at 0 projects.