
After significant delays caused by the DOB’s abrupt shift to “Build Now” which temporarily left the Five Boroughs without a functional Department of Buildings Website in March of 2021, YIMBY’s 2022 construction report is in, and the results are positively encouraging. The annual report tracks and analyzes permits filed for new buildings in New York City over the course of the year 2021. The data shows that in 2021, builders throughout the city filed permits for 2,017 structures, ranging from single-car garages to towering skyscrapers. The figure represents a 14-percent increase compared to the 2020 total of 1,774 permits. The 2021 filings will boost the city’s built stock by 53,344,472 million square feet and yield a combined total of 45,019 residential and hotel units. The full report is available with a subscription to YIMBY’s Building Wire service.
Number of permit filings by borough
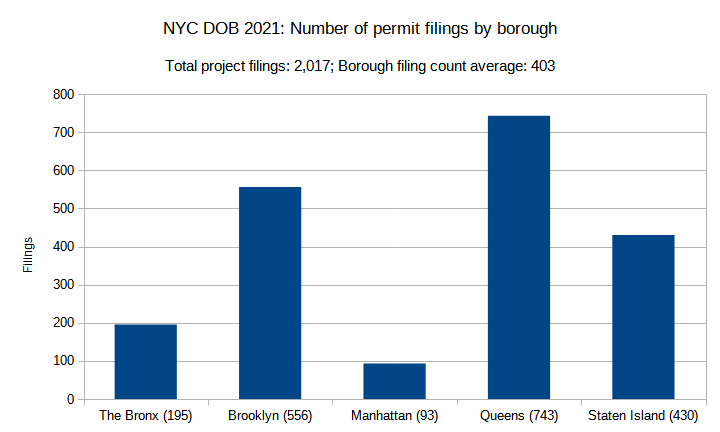
NYC DOB 2021: Number of permit filings by borough. Credit: Vitali Ogorodnikov
In 2021, the general breakdown of permit filings has remained very consistent with 2020 figures. Queens leads the pack with 783 permits, which account for over a third (37 percent) of the city’s total. Brooklyn comes next with 556 permits, which make up just over a quarter (28 percent) of the total. Staten Island is next with 430 permits, making up just over one-fifth (21 percent) of the total and scoring slightly above the city’s 403-filing borough average. The Bronx comes in fourth with 195 filings, representing ten percent of the total. Manhattan, which is defined by fewer yet generally larger projects, again came in last with 93 permit filings, which accounts for just under five percent of the city’s total.
Compared to 2020, the number of permit filings has increased by 13 percent, from 1,772 to 2,017. Counts for The Bronx and Staten Island both dipped slightly, by 17 and one filings, respectively. Manhattan’s count has increased by seven filings since last year. Brooklyn’s figure rose by 58, a nearly 12-percent increase.
Queens emerged as the biggest winner both in terms of raw numbers and percentage increase, with a permit count growing by 191 filings, or 35 percent, since the previous year. This stratospheric growth may in part be attributed to the enormous latent development potential in the World’s Borough, as compared to densely built-out Manhattan, Brooklyn, and The Bronx, and the sprawling yet transit-underserved Staten Island.
In the future, we hope to see Queens’ transit capacity boosted further by the proposed Interboro Line and LaGuardia Air Train, as well as possible restoration of passenger train service along the Lower Montauk and Rockaway Beach lines, which would allow for further large-scale development in the city’s largest and second-most-populous borough.

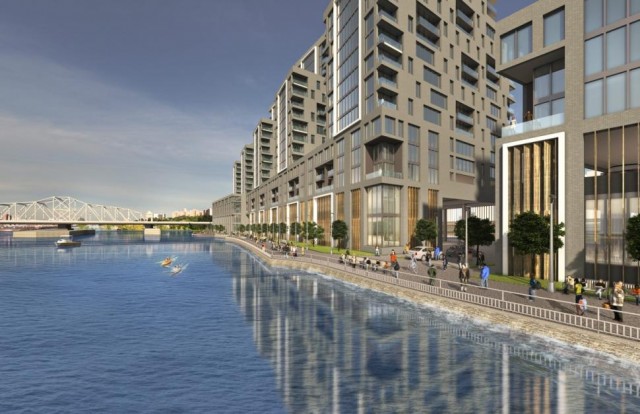
Long Island City. Photo by Michael Young
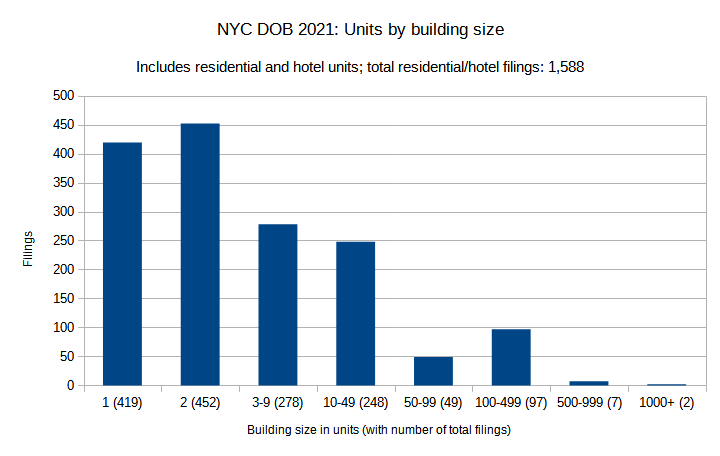
Units by building size
NYC DOB 2021: Number of permit filings per month. Credit: Vitali Ogorodnikov
Though New York City’s majestic skyline is recognized around the world, the city predominantly consists of low-rise residences and mid-sized apartment buildings, and the 2021 permit filings continue to reflect this fact. As anticipated, as buildings grow smaller in scale, the number of their filings increases nearly exponentially.
In all, the residential and hotel unit count in 2021 permit filings adds up to 45,019 units.
Please note that, due to changes in the way the Department of Buildings tallies data since around the start of 2021, the entries are no longer separated by program, hence the data above combines both residential and hotel unit counts. It should be noted, however, that residential units comprise the vast majority of the total unit count.
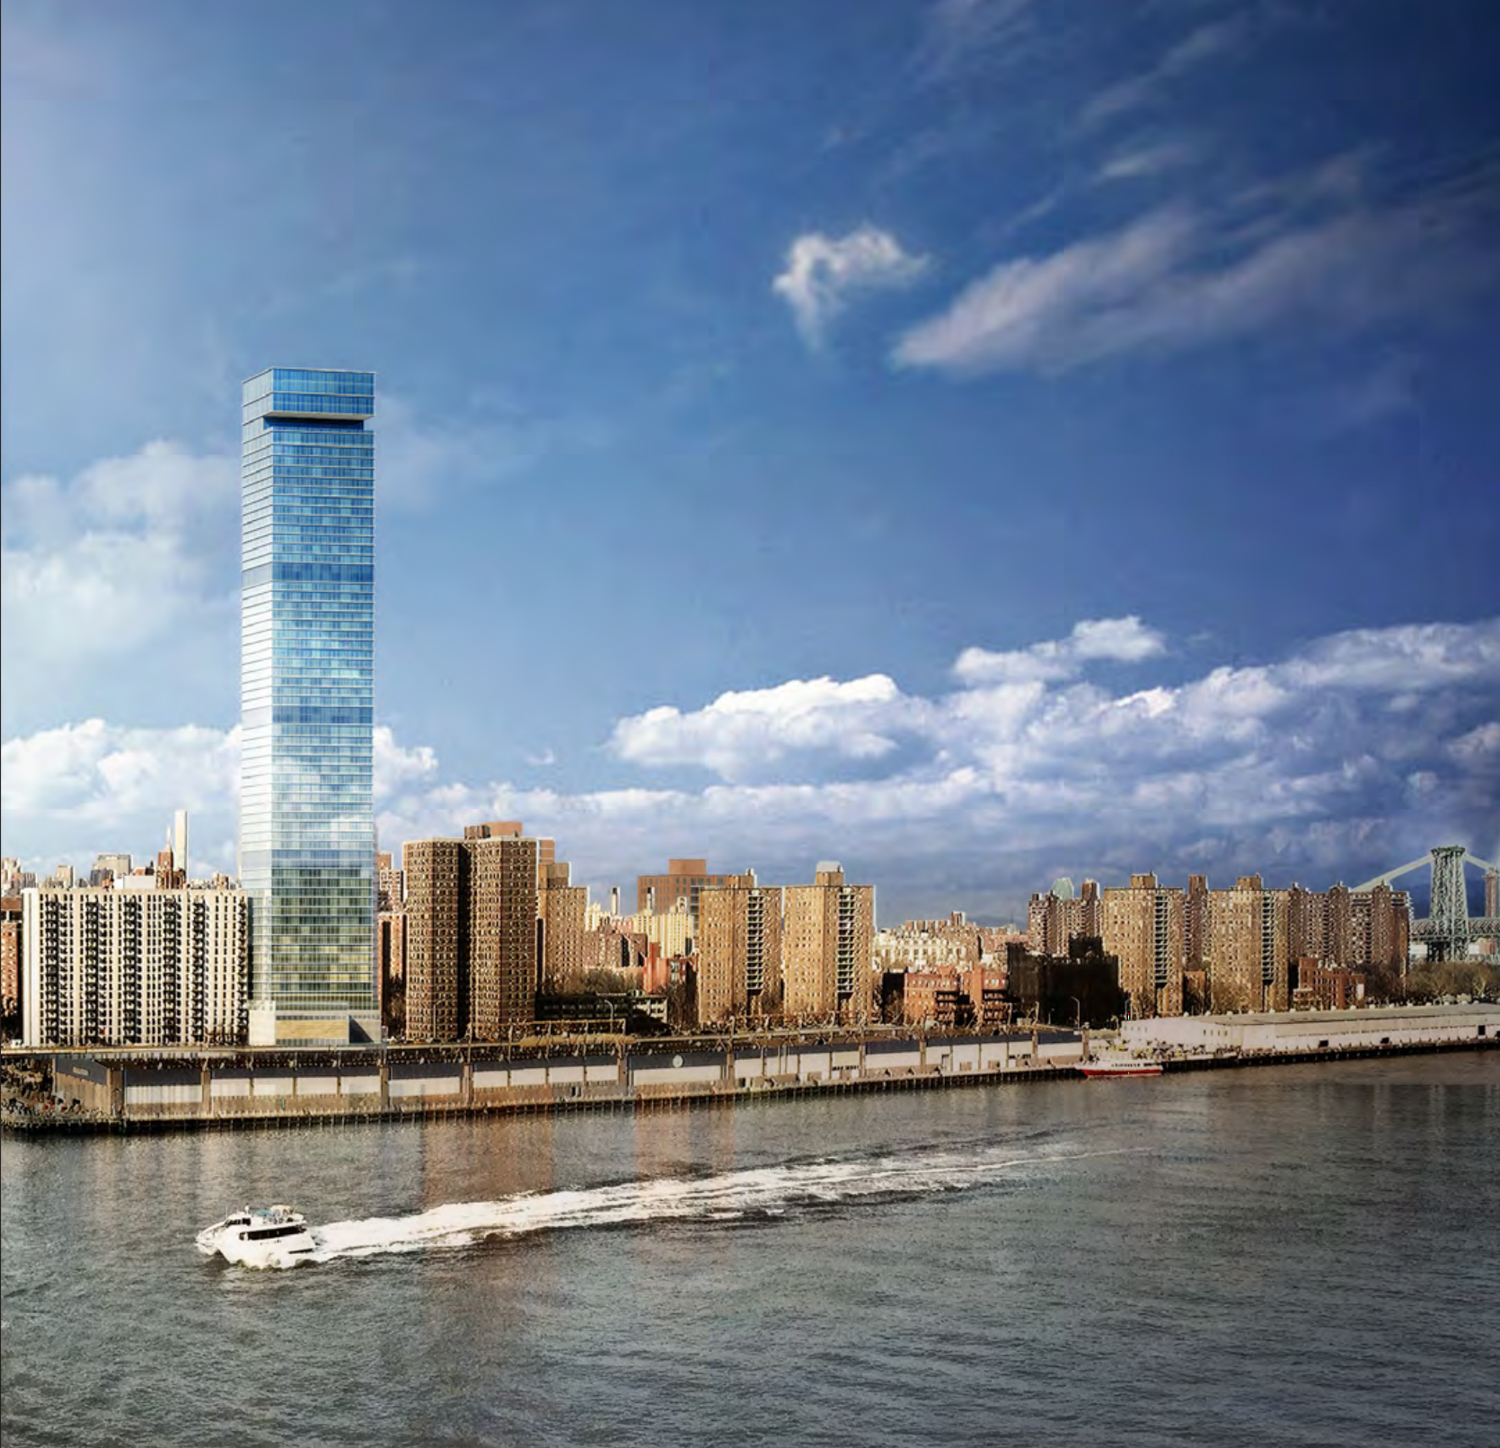
The chart may make it seem that the overwhelming majority of new residential and hotel stock will arrive in the form of single-family residences and small multi-unit buildings; in fact, the opposite is true. The two buildings with the highest unit counts (265 South Street with 1,803 units and 495 Eleventh Avenue with 1,041 units) comprise a paltry 0.01 percent of the total residential/hotel filings, yet their unit count accounts for more than 6 percent of the total 45,019 planned in 2021.
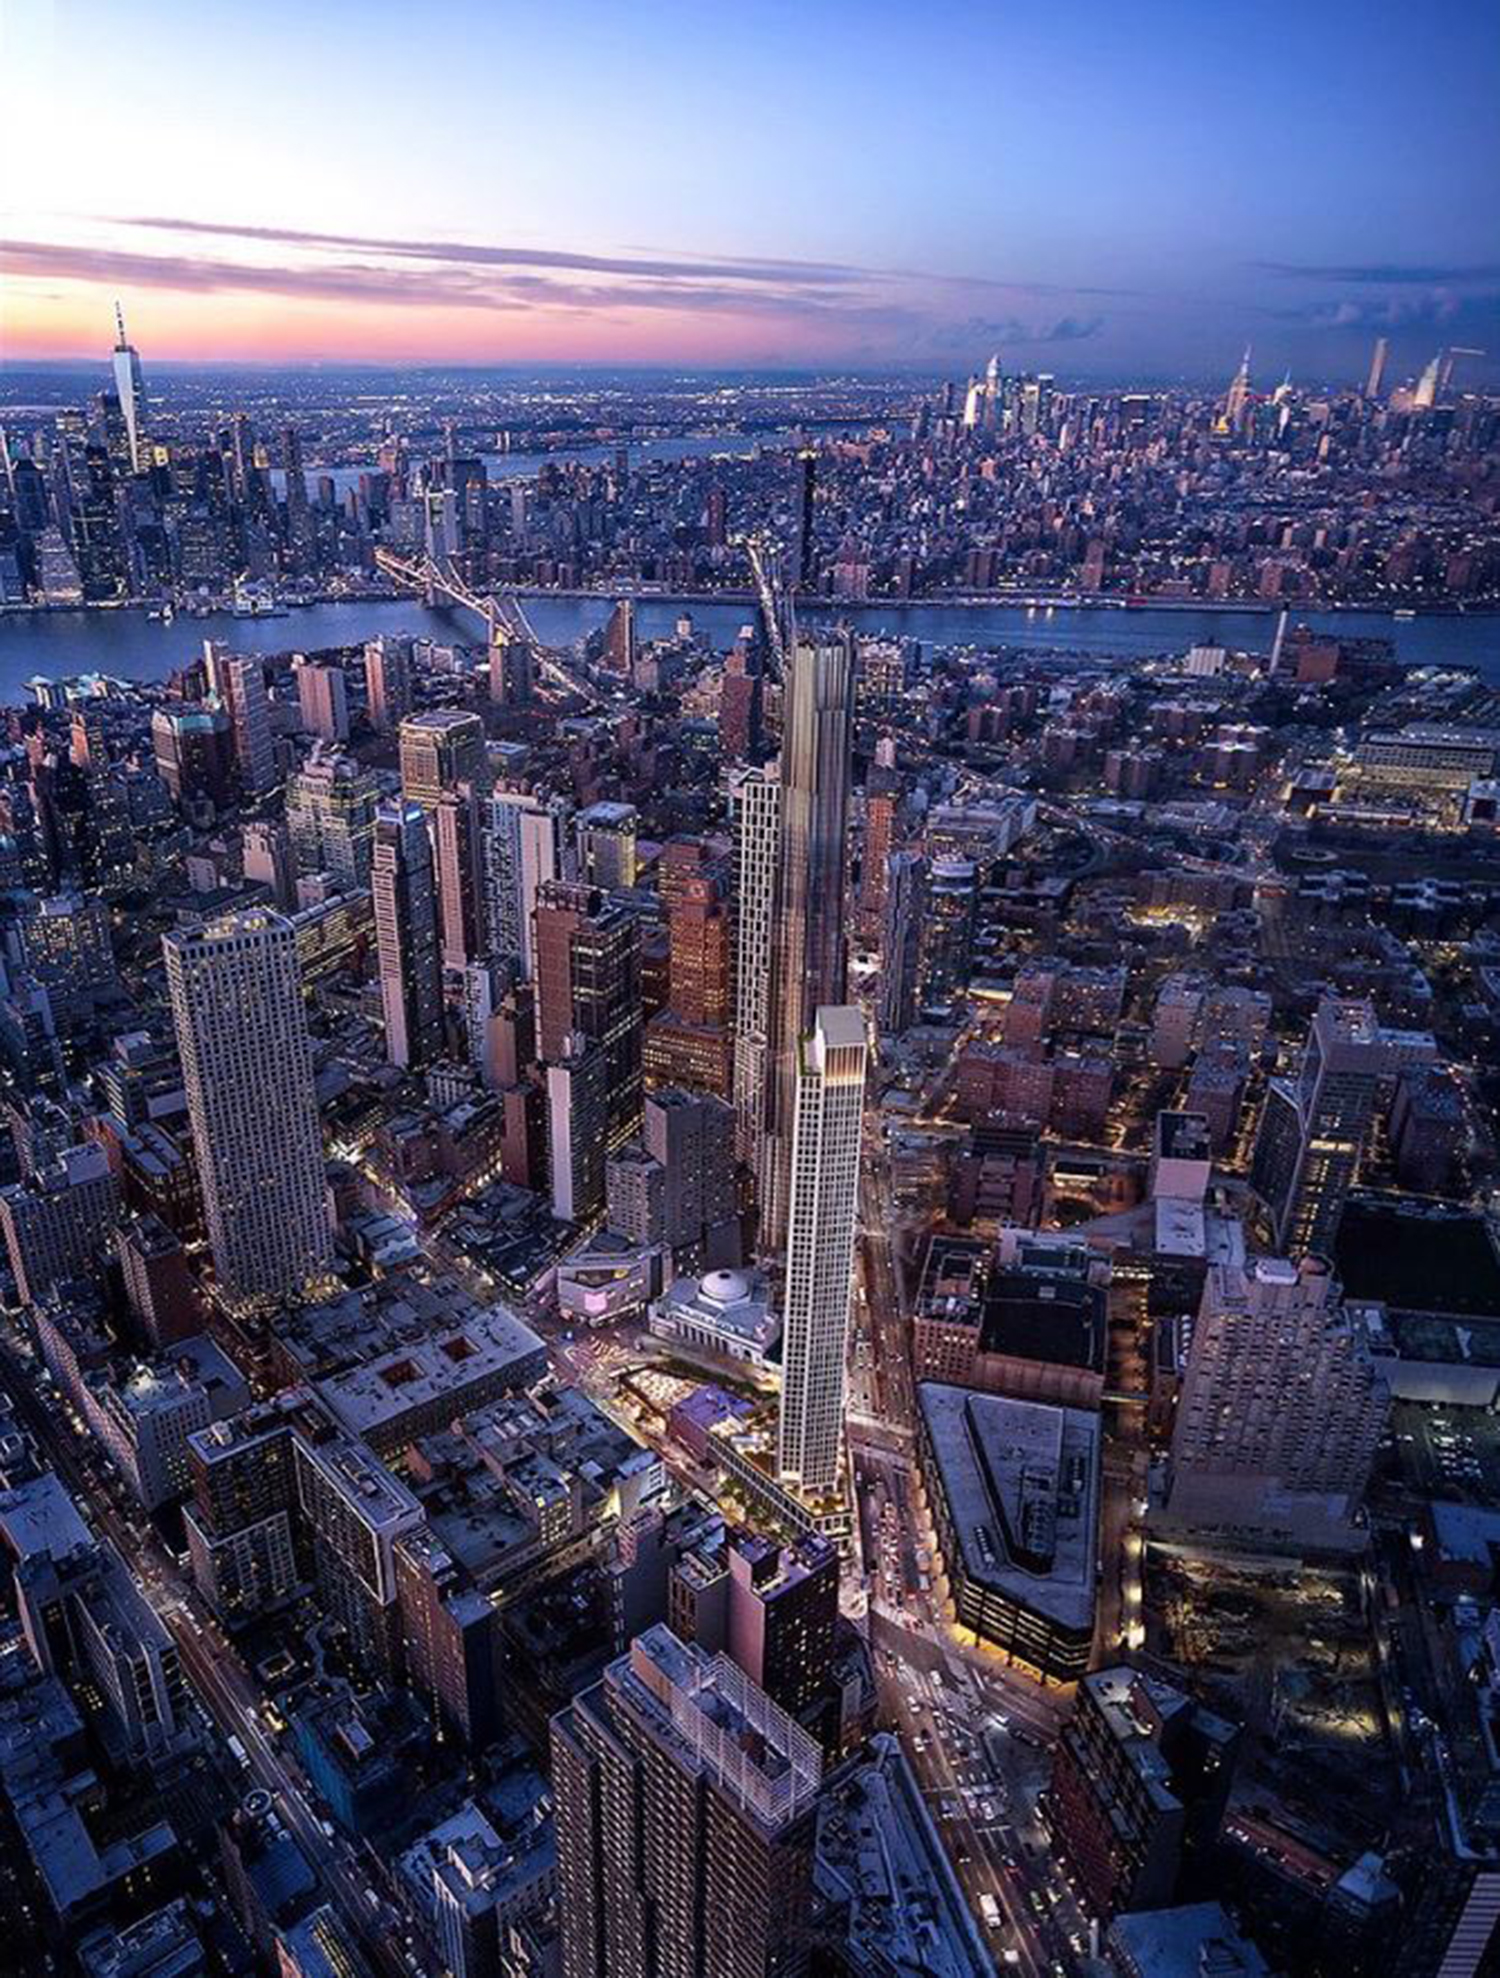
265 South Street. Image via the Lo-Down.
Likewise, 36,500 units, or more than four-fifths (81 percent) of the total, will be located in large apartment buildings and hotels with 50 and more units in each structure. If we extend the definition of a “large apartment building or hotel” to any structure with ten or more units, then the category will hold 42,118 units, or 94 percent of the new unit stock. Only 871, or just under two percent, of the total unit count will be built in single- and two-family houses throughout the city.

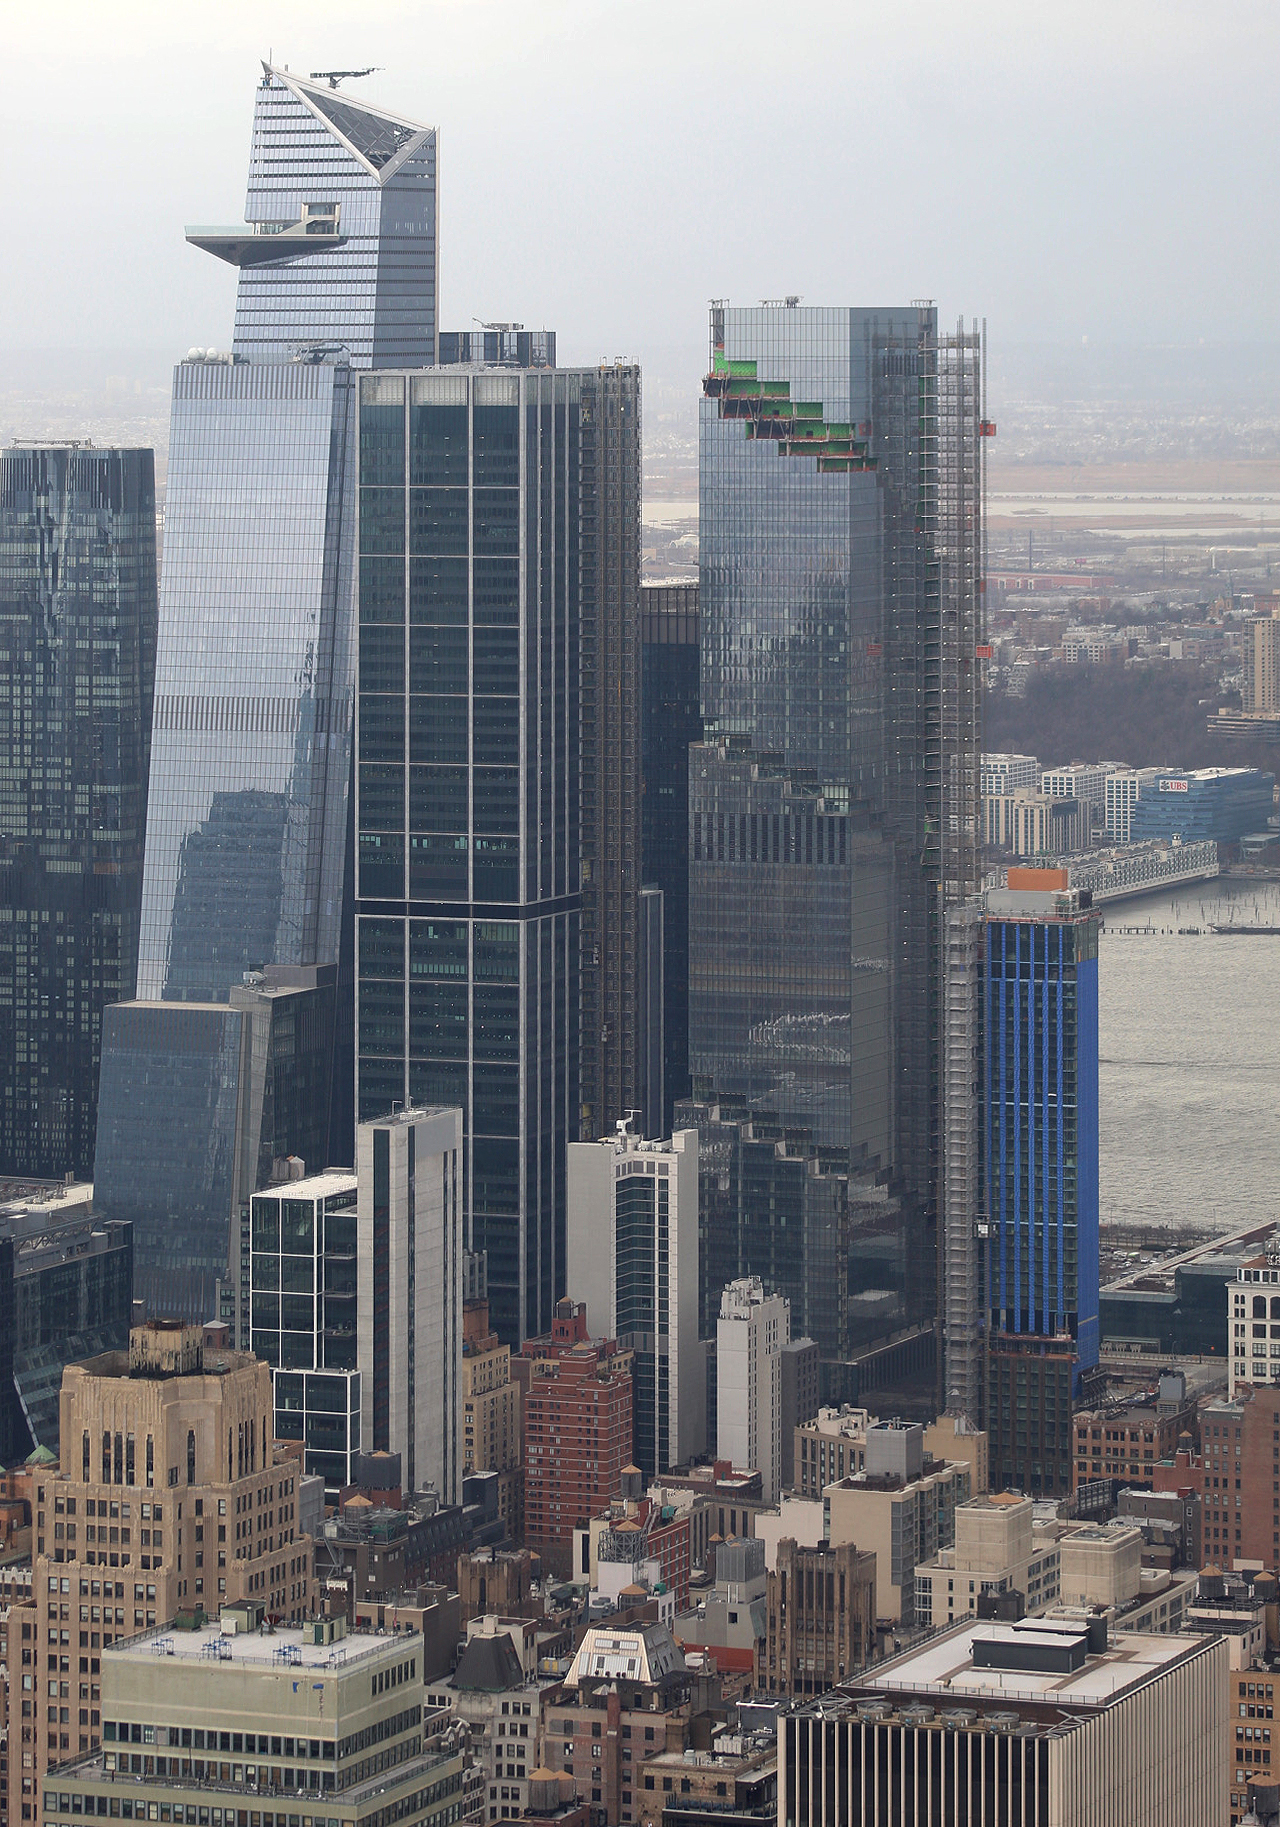
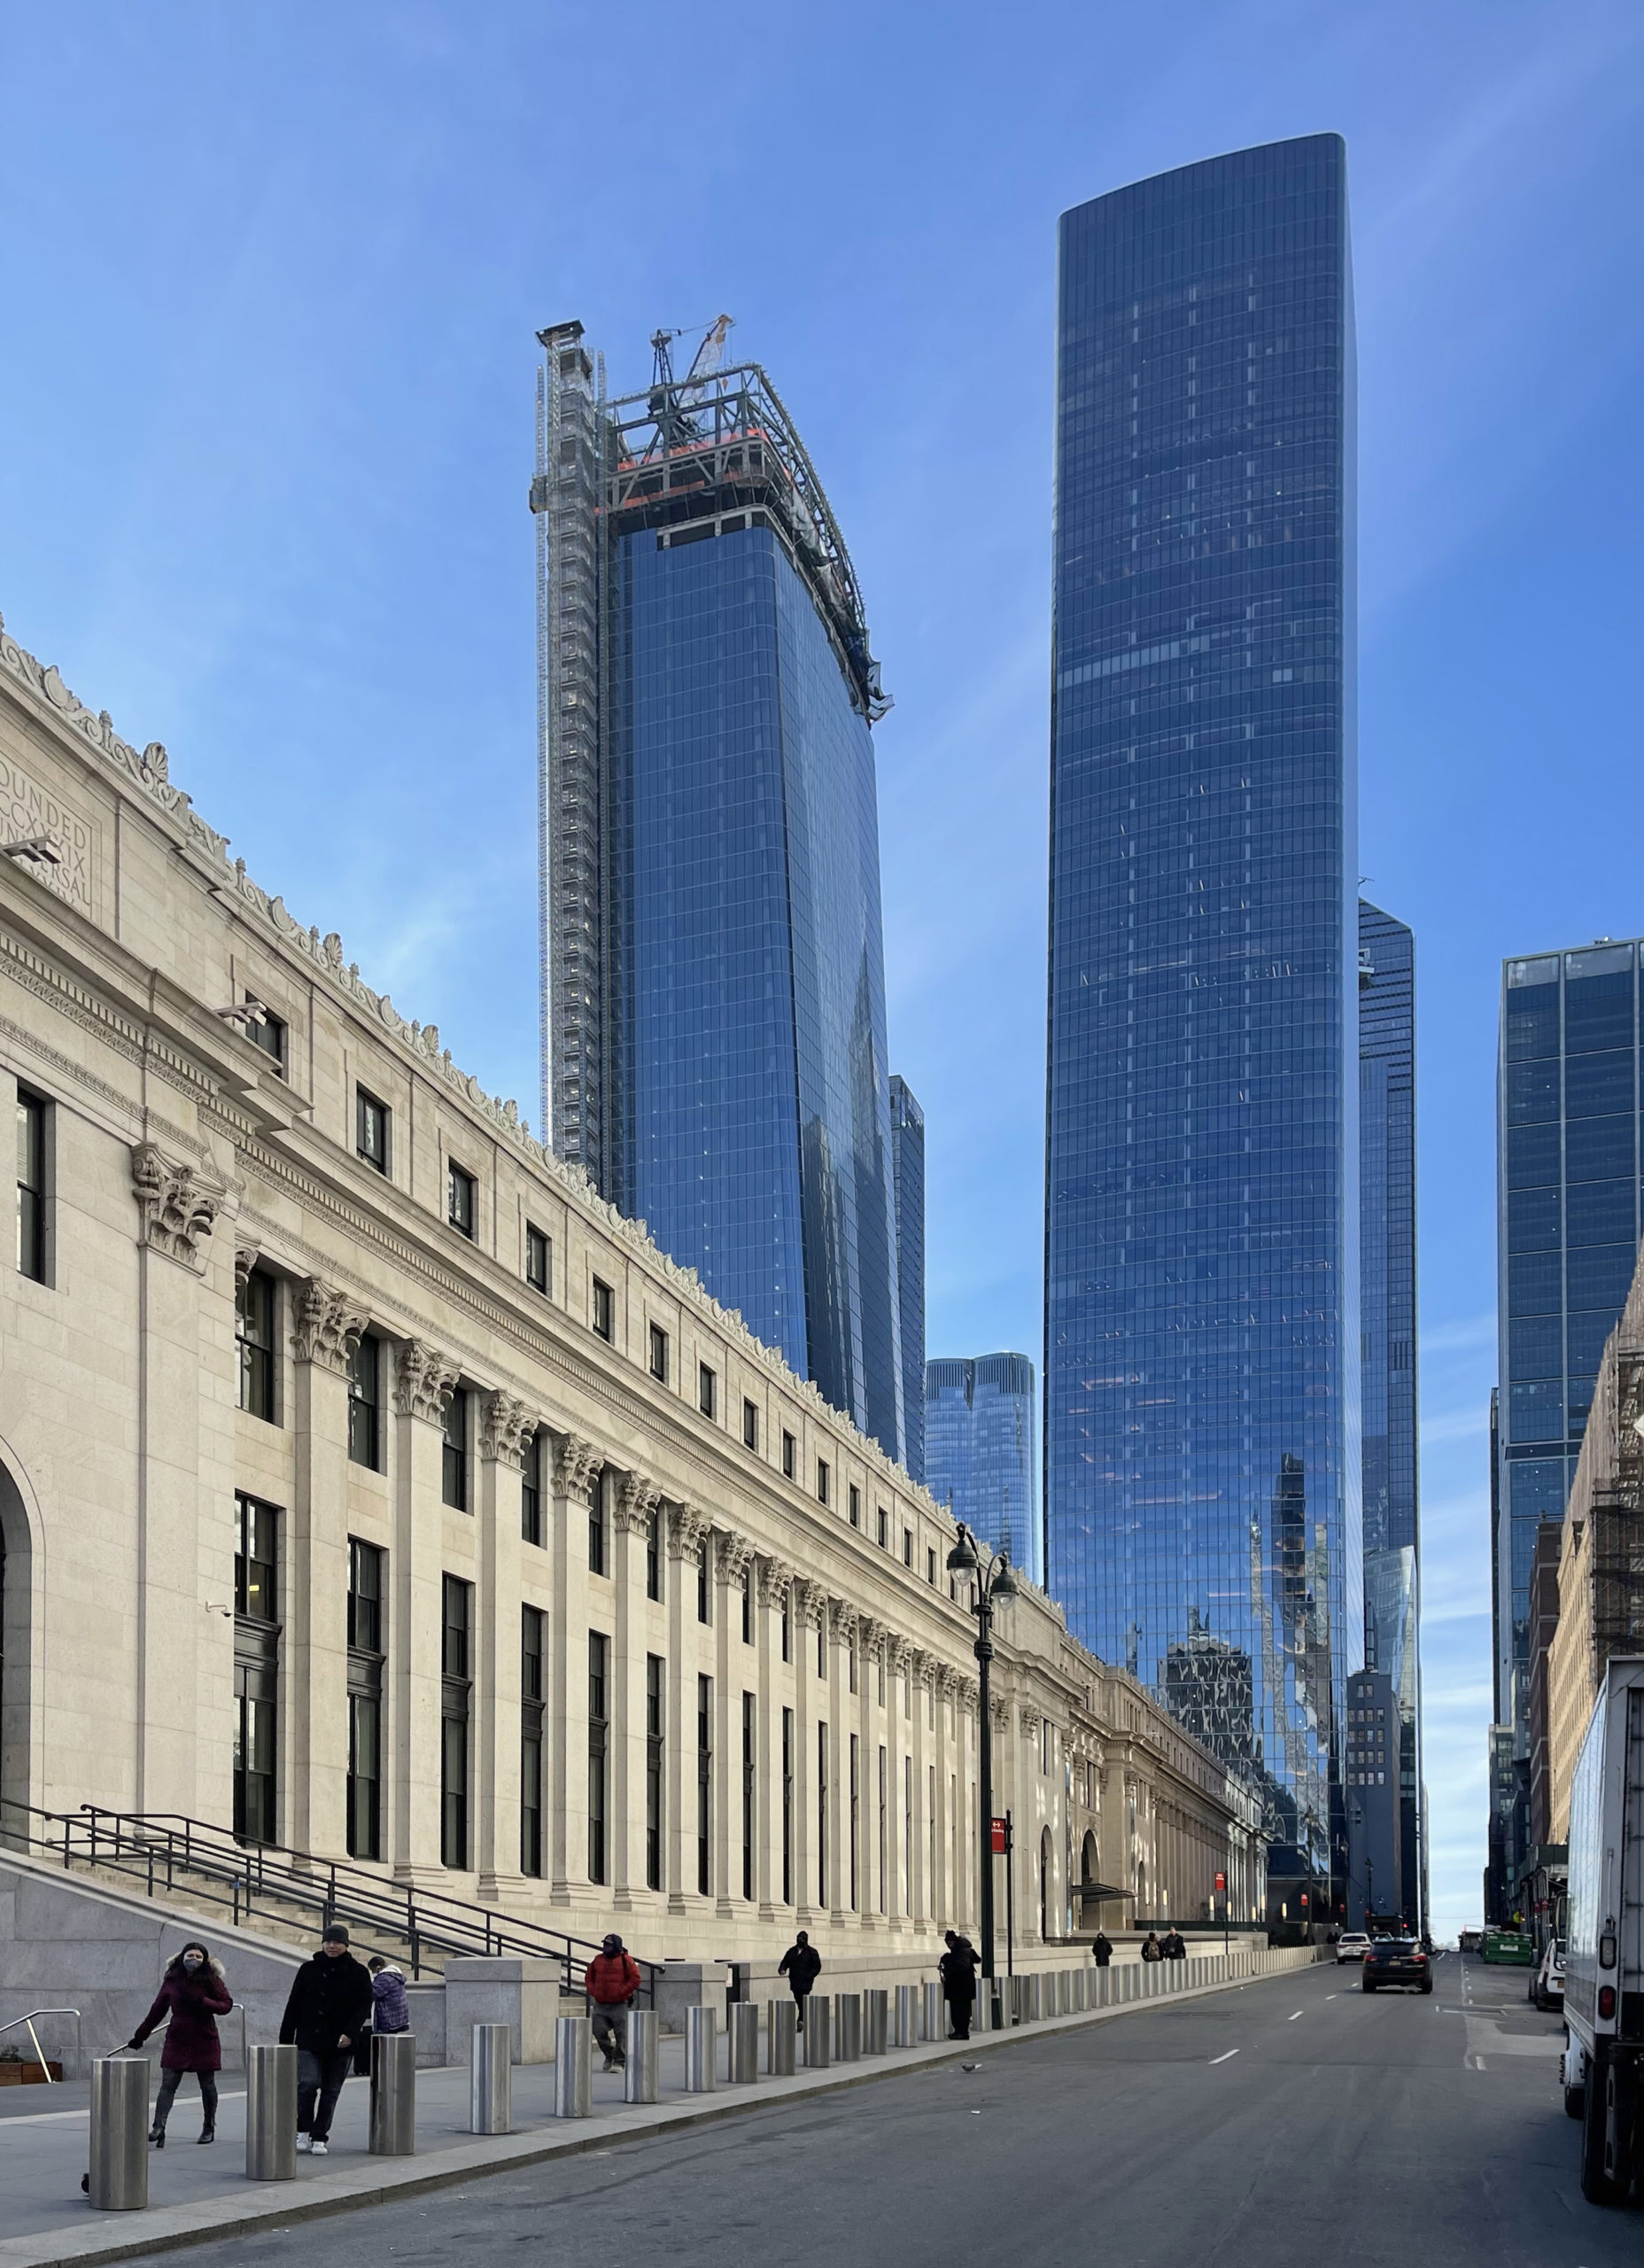
606 West 30th Street rising over Hudson Yards. Photo by Michael Young
Number of residential and hotel units per borough
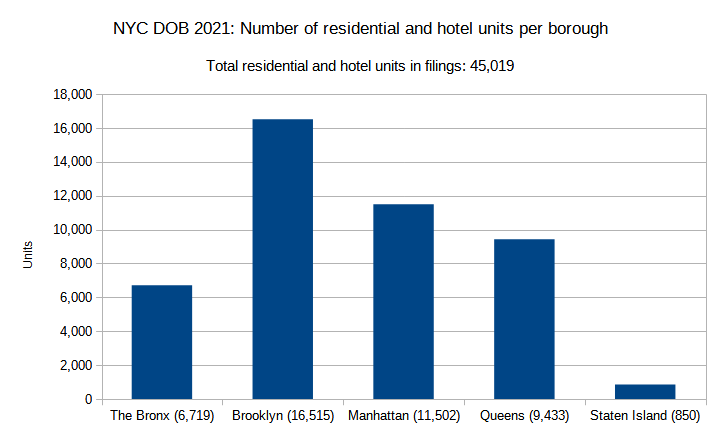
NYC DOB 2021: Number of residential and hotel units per borough. Credit: Vitali Ogorodnikov
In 2021, permits were filed for a combined total of 45,019 residential and hotel units (the figure is bundled together due to the new way that the Department of Buildings tallies data). Of these, 16,515 units, or more than one-third (37 percent), were filed in Brooklyn, which will further boost the capacity of what is already the city’s most populous borough. The overall borough share is comparable to 2020, when Brooklyn also accounted for one-third (35 percent) of the total. The borough’s largest filing is listed at 589 Fulton Street, which will house 592 residences in a 52-story skyscraper.
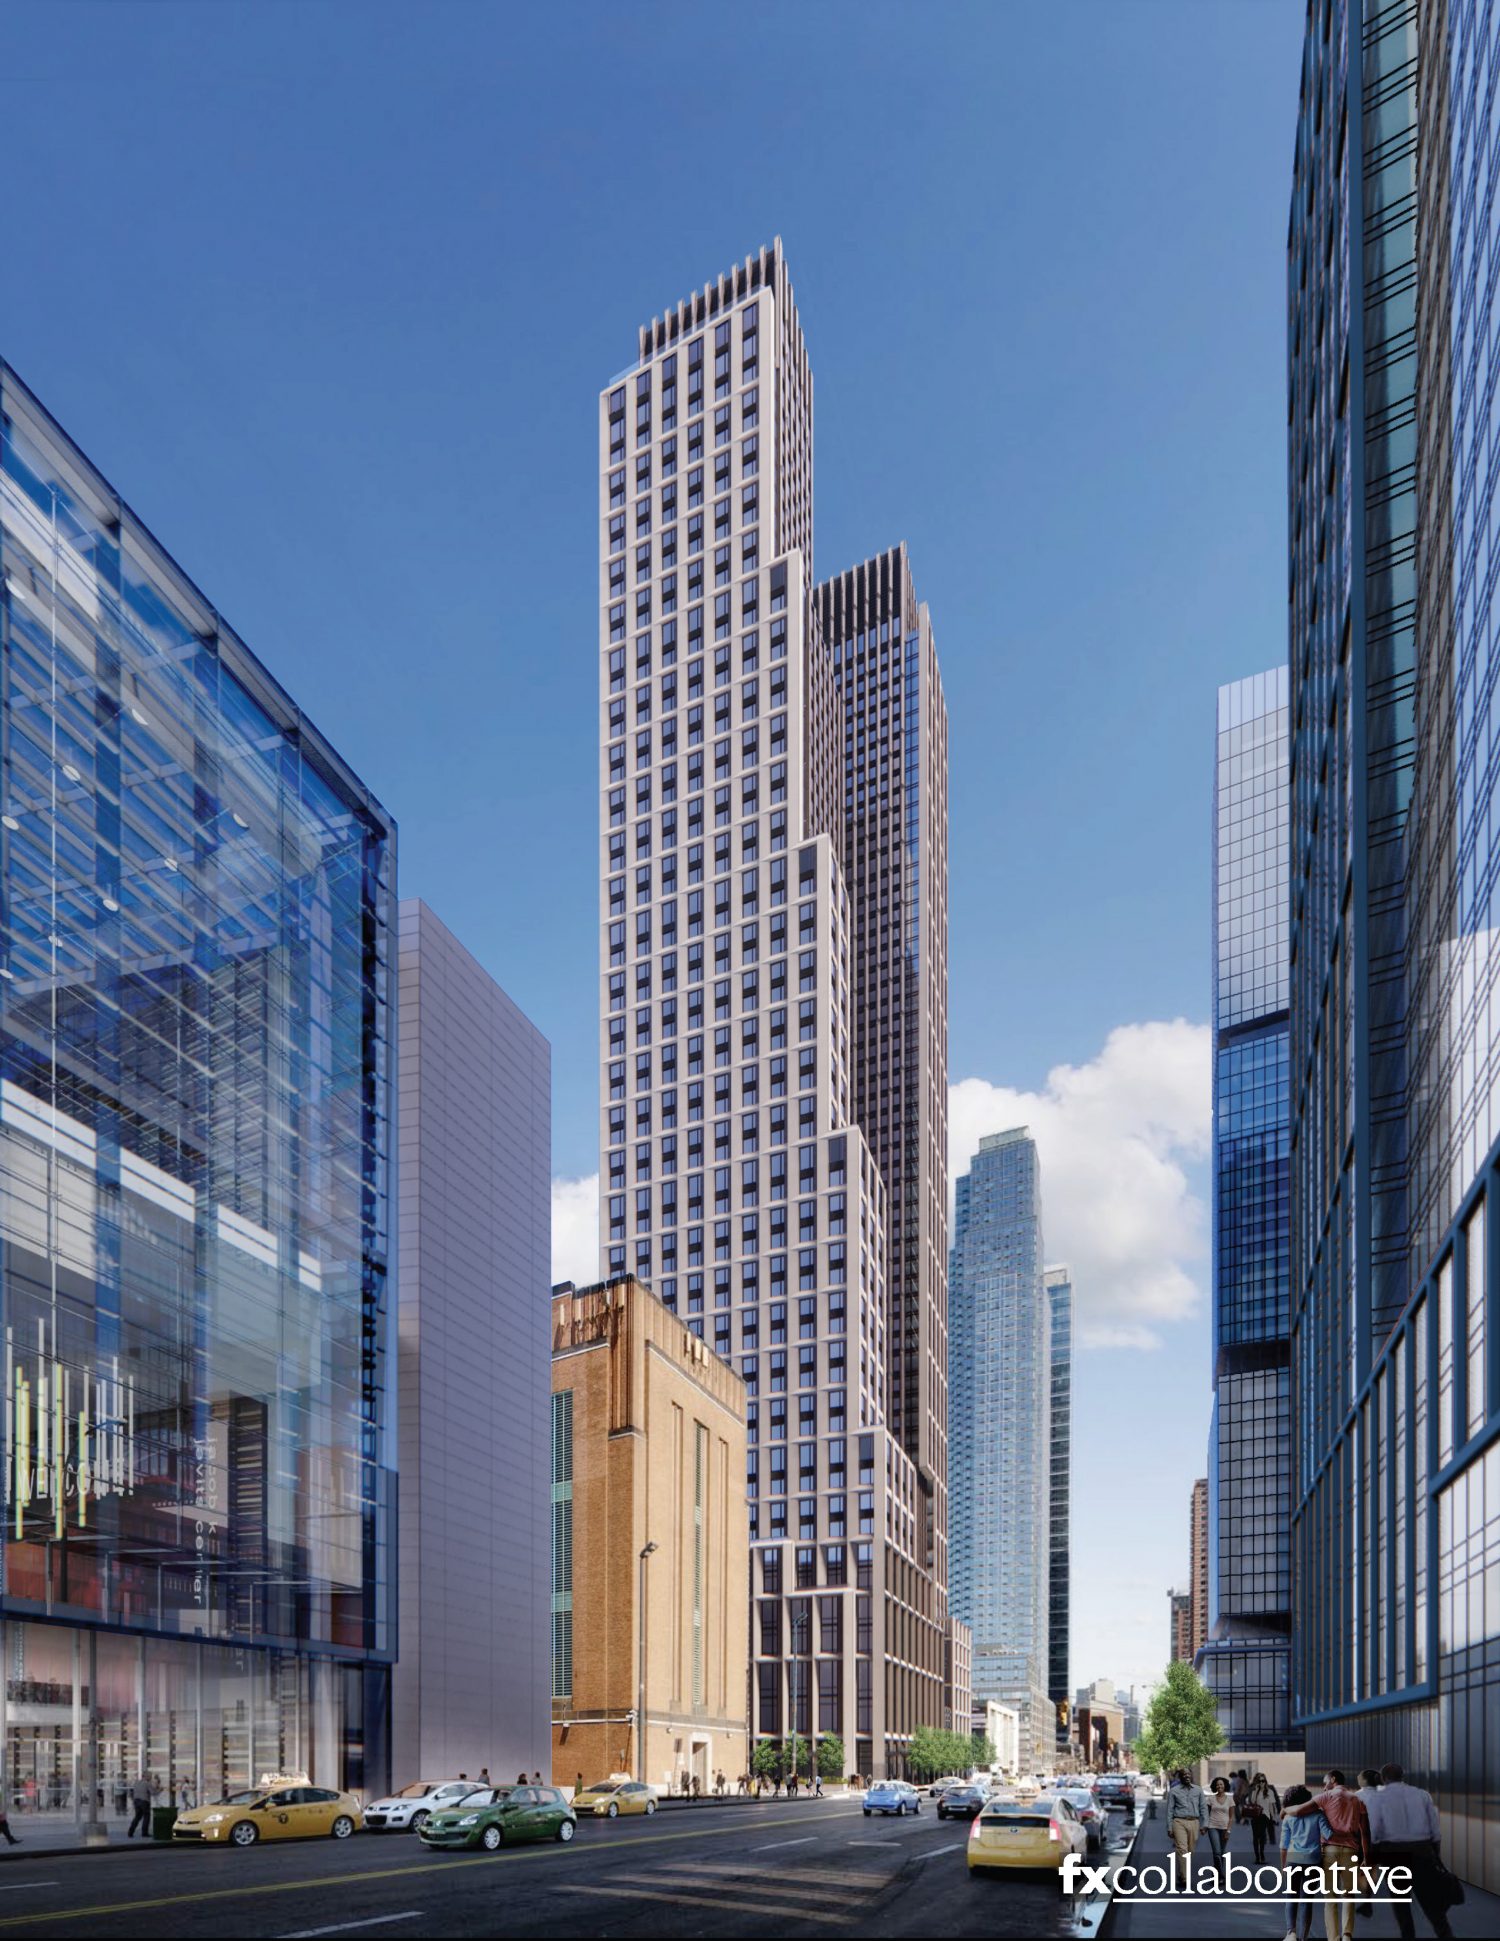
495 11th Avenue. Rendering by FXCollaborative
This time around, reversing last year’s placement, Manhattan comes in second, with 11,502 units, or just over a quarter (26 percent) of the city’s total. Though the inclusion of hotel rooms within the category is definitely making an impact, the threefold jump in Manhattan filings from last year’s 3,862 is largely attributed to a surge in residential proposals. In particular, just two developments, namely 265 South Street (73 stories, 1,803 units) and 495 Eleventh Avenue (61 stories, 1,041 units), account for one-quarter of Manhattan’s total unit filings.
Queens comes in third with 9,433 units, or just over one-fifth (21 percent), of the city’s total. The count adds 705 units to the previous year’s figure, although the increase is likely partially attributable to inclusion of hotel proposals in the count. The largest number of units (818) in the borough’s permit filings registers at 42-02 Orchard Street, which will also become the borough’s tallest at 800-plus feet and 69 stories.
The fourth place goes to The Bronx, the only borough to experience a significant unit count drop from the previous year, sliding from 8,298 down to 6,719 units. The units account for 15 percent of the city’s total, a figure that is incidentally similar to the borough’s 17-percent share of city’s total population. The largest permit filing by unit count in The Bronx is the 17-story, 602-unit structure planned at 320 West Fordham Road.
In last place comes Staten island, the least populous borough, with a total of 850 unit filings, or just under two percent of the city’s total. And although the overwhelming majority of fillings is of the low-density variety, the unit bulk supplied by apartment buildings is evident. Although only 13 out of the 300-plus residential buildings proposed in the borough will hold more than two units, four of these buildings supply 39 percent of the total units filed for in the borough. One of these, the eight-story development planned at 560 Bay Street in Stapleton, accounts for nearly a quarter (24 percent) of the borough’s total.
111 West 57th Street. Photo by Michael Young
Average unit count per filing per borough
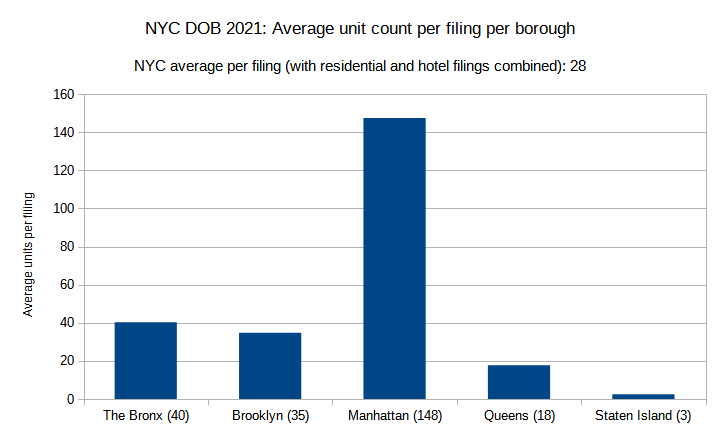
NYC DOB 2021: Average unit count per filing per borough. Credit: Vitali Ogorodnikov
In 2021, the average residential/hotel filing registered 28 units, five above the previous year’s average of 23, although the latter tallied residential filings only.
Going by previous years’ trends, as well as judging by the general urban fabric of the borough, we expected Manhattan to once again boast the highest number of units per average residential/hotel development. What came as a surprise, however, is the nearly three-fold increase of the unit count per average filing, which surged from 50 in 2020 to 148 in 2021. While inclusion of hotels, which tend to pack hundreds of rooms each, is likely a contributing factor for this increase, so is the addition of several extra-large residential developments.
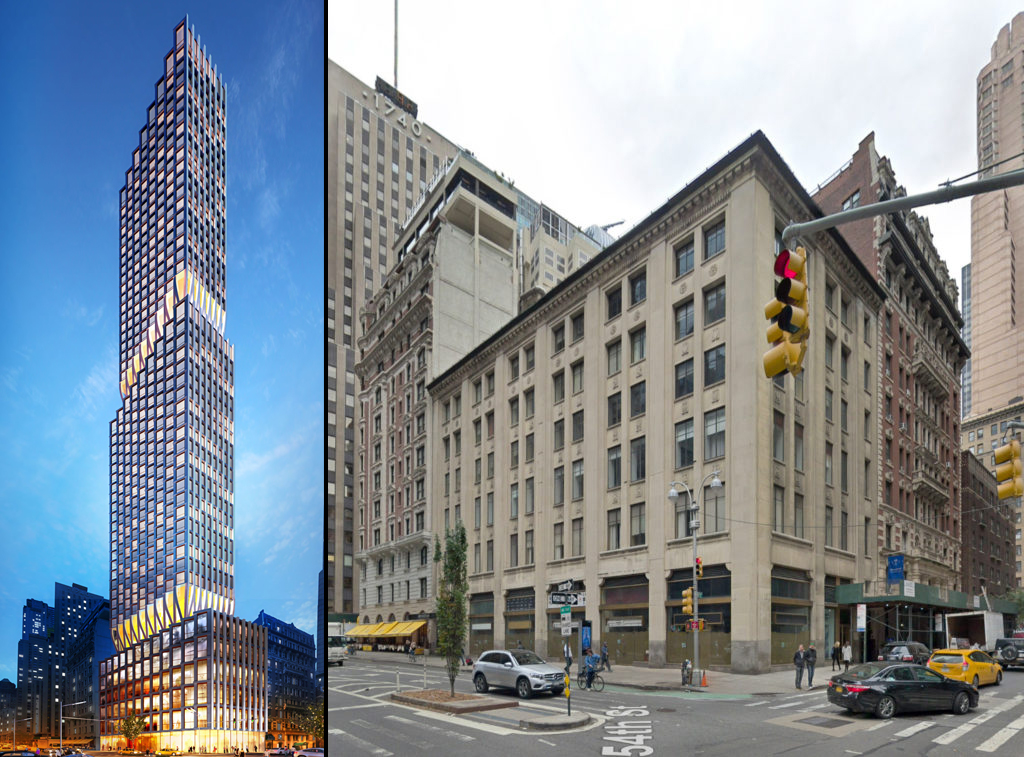
1710 Broadway, via Colliers International, design by PLP Architecture. 1710 Broadway extant at right via Google Maps
Manhattan features two project filings with 1,000-plus units, two with 500 to 1,000 units, five with 400 to 500 units, and three with 300 to 400 units. The top entries are 265 South Street (1,803 units), 495 Eleventh Avenue (1,041 units), 259 Clinton Street (706 units), 1710 Broadway (670 units), 407 West 206th Street (470 units), 1637 First Avenue (459 units), 550 Tenth Avenue (453 units), and 201 West 54th Street and 711 Seventh Avenue (400 units each).
As was the case last year, The Bronx is the runner-up, with an average of 40 units per filing. However, although the borough was nearly tied with Manhattan last year, this time around the borough’s eight-point dip and Manhattan’s three-fold surge put a distance of over 108 units between the two borough’s averages.
The five permit filings with the highest unit counts in The Bronx may be found at 320 West Fordham Road (602 units), 138 Bruckner Boulevard (447 units), 40 Bruckner Boulevard (365 units), 586 Gerard Avenue (197 units), and 3250 Westchester Avenue (187 units).
Brooklyn’s 11-point surge since last year brings its average residential/hotel filing up to 35 units, catching up to The Bronx. The borough boasts one project filing with 500-plus units, five with 400 to 500 units, and ten with 300 to 400 units.
589 Fulton Street. Designed by Beyer Binder Belle and seen on their Instagram @beyerblinderbelle
Brooklyn’s five permit filings with the highest unit counts are 589 Fulton Street (592 units), 477 Smith Street (496 units), 1 Java Street (477 units), 71 Prince Street (465 units), and 254 Euclid Avenue.
Queens, notable for its balanced spread between high- and low-density development, averages at 18 units per residential/hotel filing, dipping five points below last year’s average of 23 and ten points below the city average.
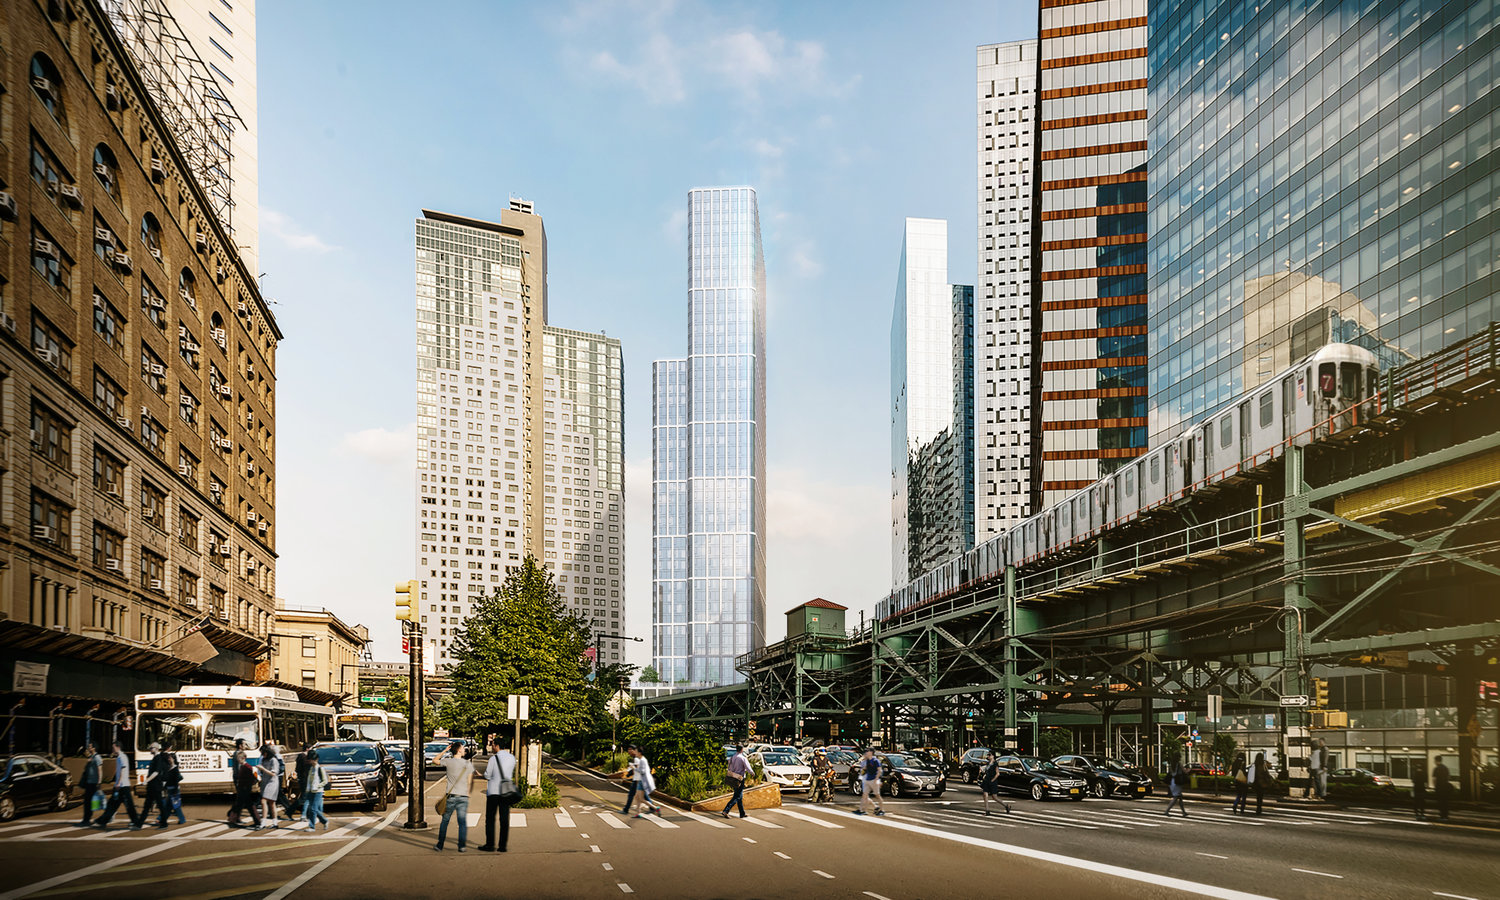
30-25 Queens Boulevard. Rendering by Modern Spaces Commercial + Investment Division
Queens registered three filings between 500 and 1,000 units: 42-02 Orchard Street (818 units), 61-10 Junction Boulevard (573 units), and 30-05 Queens Boulevard (518 units). One more, at 2-33 50th Avenue, ranked just below, at 499 units. Five registered between 300 and 400 units: 144-02 135th Avenue (369 units), 26-32 Jackson Avenue (363 units), 44-01 Northern Boulevard (354 units), 133-25 37th Avenue (352 units), and 41-34 27th Street (317 units). One more entry, at 143-16 135th Avenue, ranked just beneath the latter category, with 297 units.
Traditionally sprawling Staten Island registered only 13 filings with three or more residential or hotel units. The top-ranking filings are 560 Bay Street (201 units), 160 Richmond Terrace (77 units), 197 Canal Street (27 units), 1239 Forest Hill Road (24 units), and 430 St. Marks Place, 23 and 31 Cunard Avenue, and 1028 Van Duzer Street (eight units each).
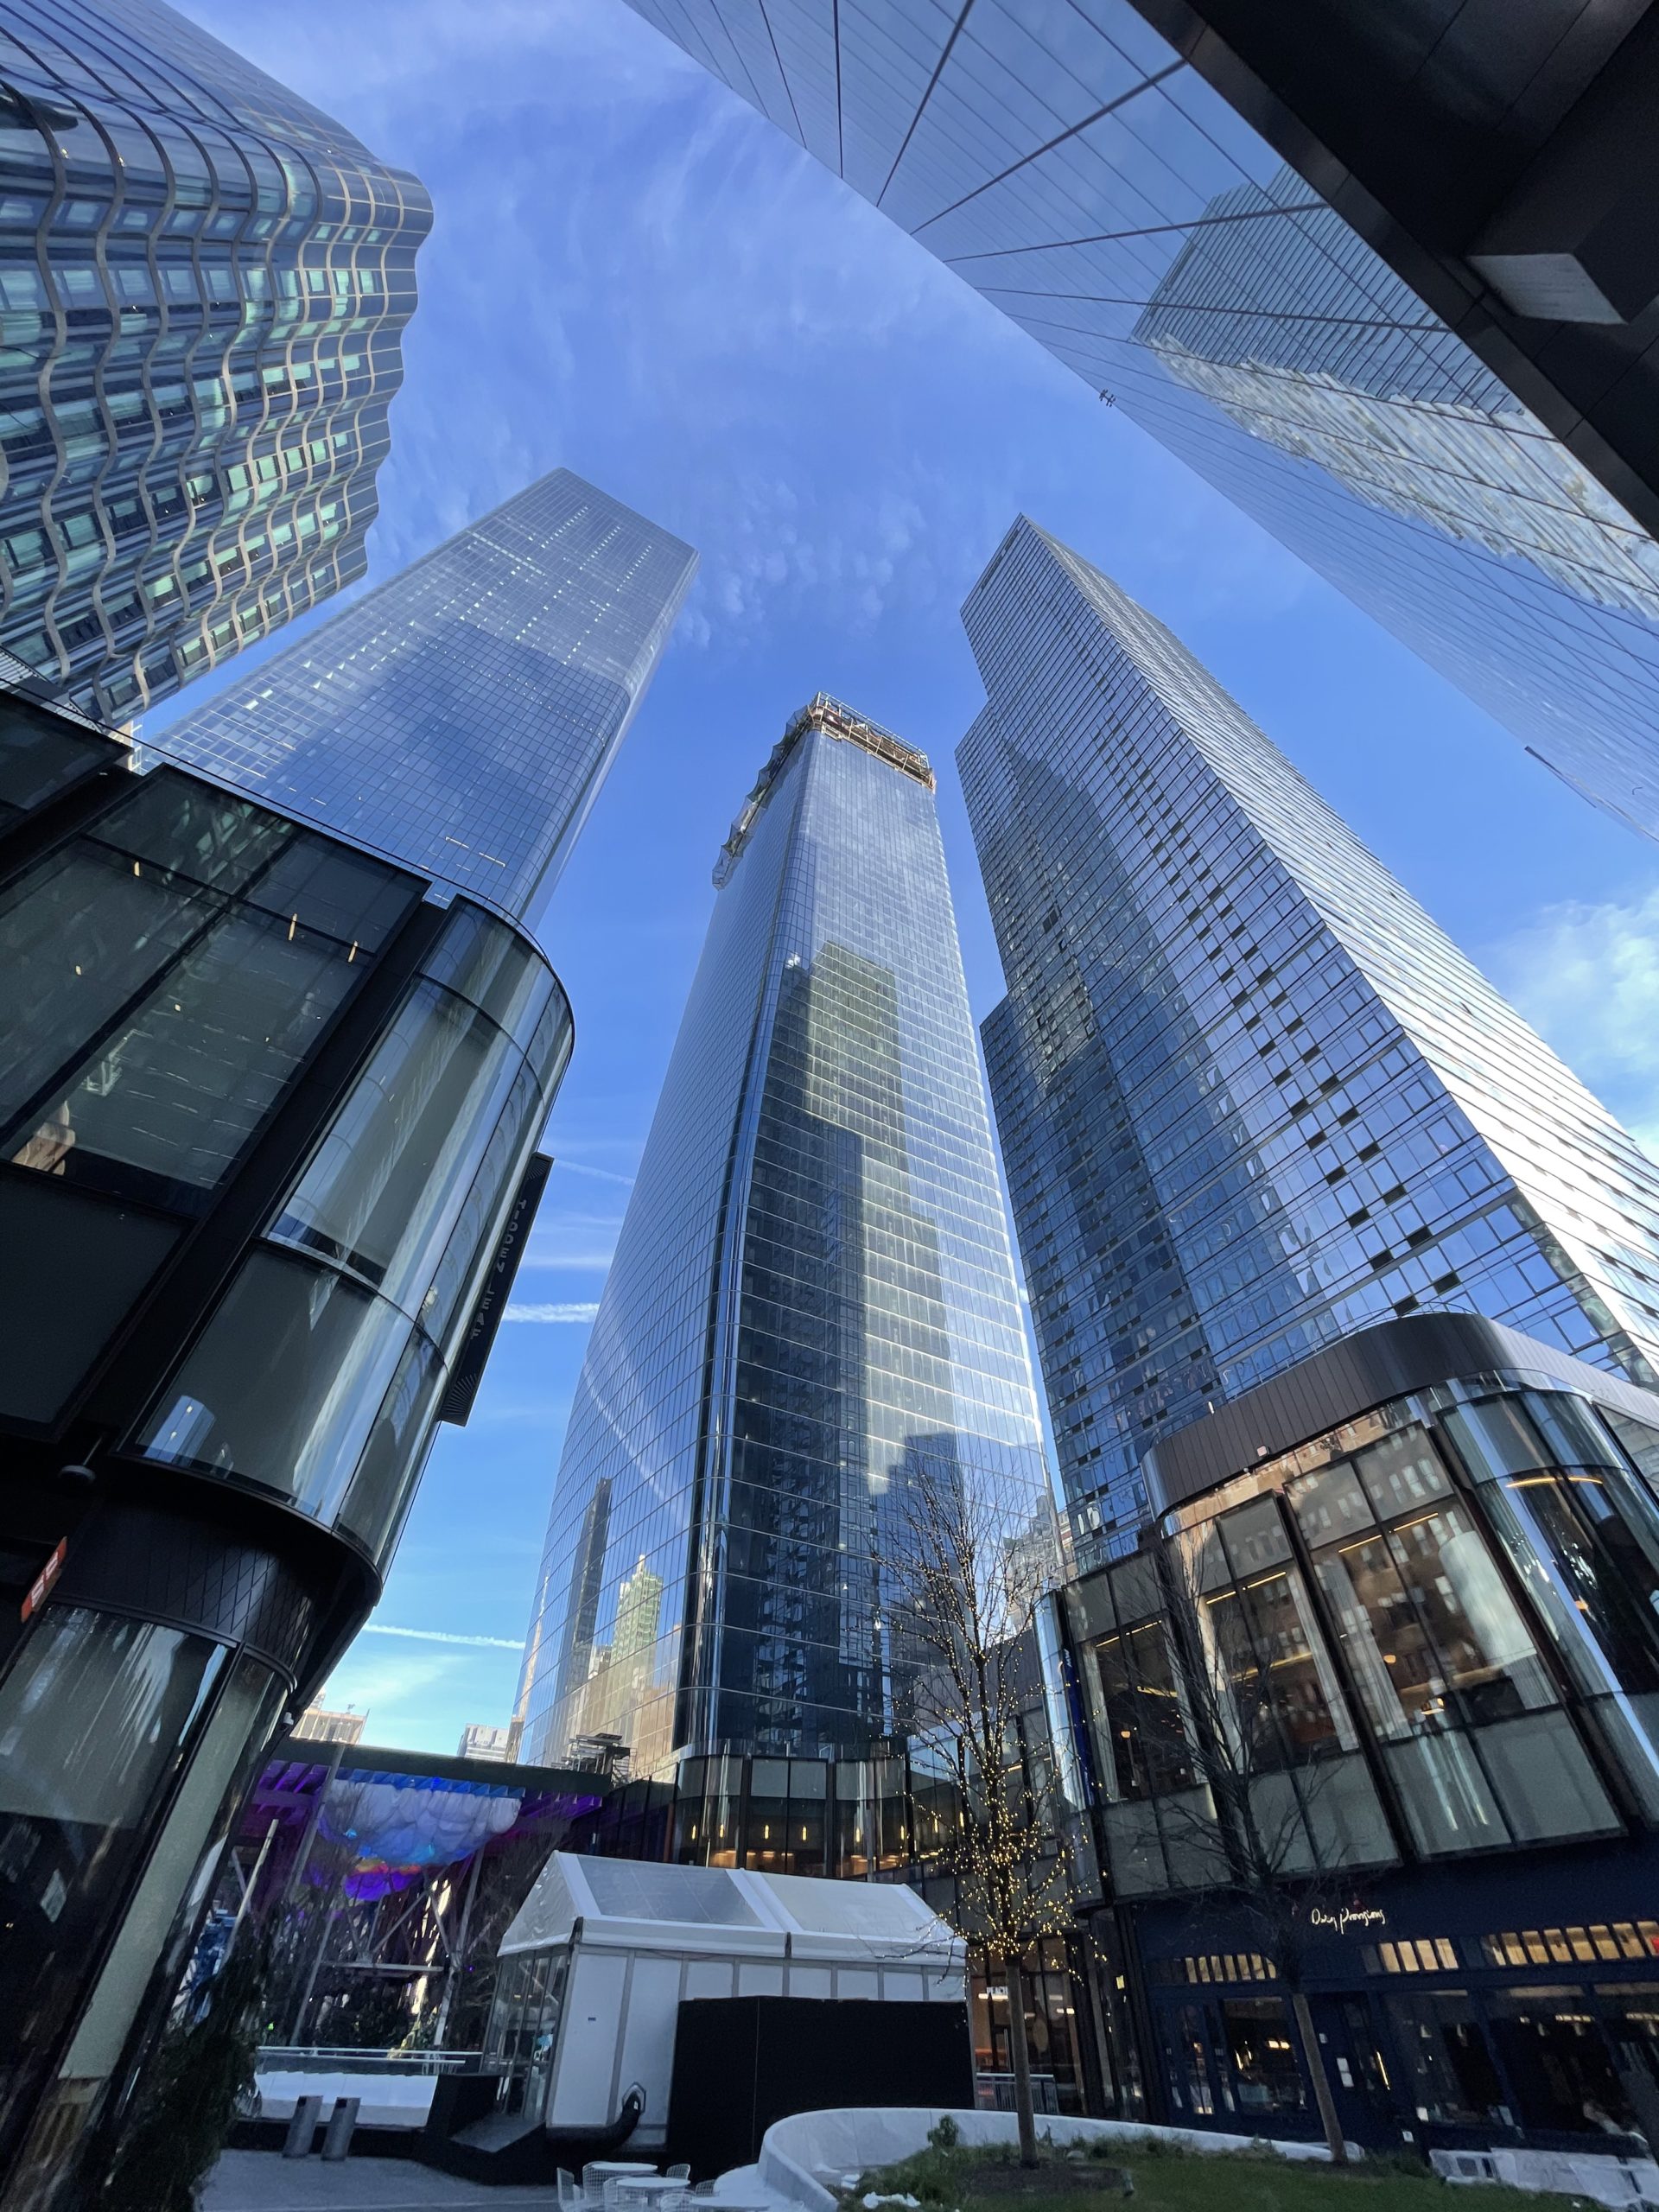
50 Hudson Yards. Photo by Michael Young
Number of filings per floor count category
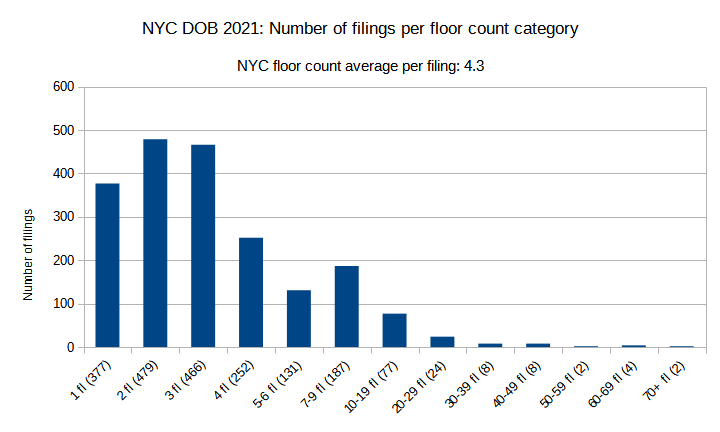
NYC DOB 2021: Number of filings per floor count category. Credit: Vitali Ogorodnikov
Compared to 2020, permit filings have shown marked increases in certain categories. While filings for single-story buildings and structures with four to 19 floors (which make up about half of the total filings) has remained very similar, buildings in the two-story category have received a 30-percent boost, increasing from 367 to 479, and a 19-percent boost in the three-story category, rising from 393 to 466.
Also notable, particularly for skyline watchers, are the gains among filings with 20 stories and above. Filings for high-rise buildings with 20 to 29, 30 to 39, and 40 to 49 stories increased by half again, growing from from 15 to 24, six to nine, and five to eight, respectively.
In a triumphant show of confidence in the city’s vertical future, permits list nine filings that surpass the highest category from last year, with two filings with buildings ranging from 50 to 59 floors, four filings for buildings with 60 to 69 floors, and filings for two behemoths rising 70 to 79 floors.
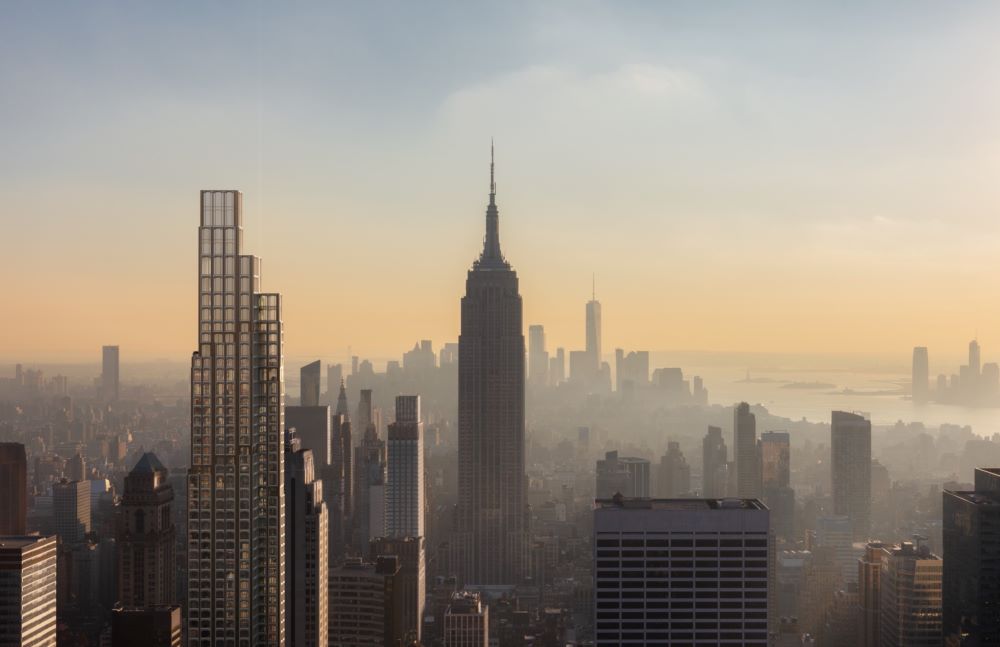
Rendering of 520 Fifth Avenue and the Midtown skyline
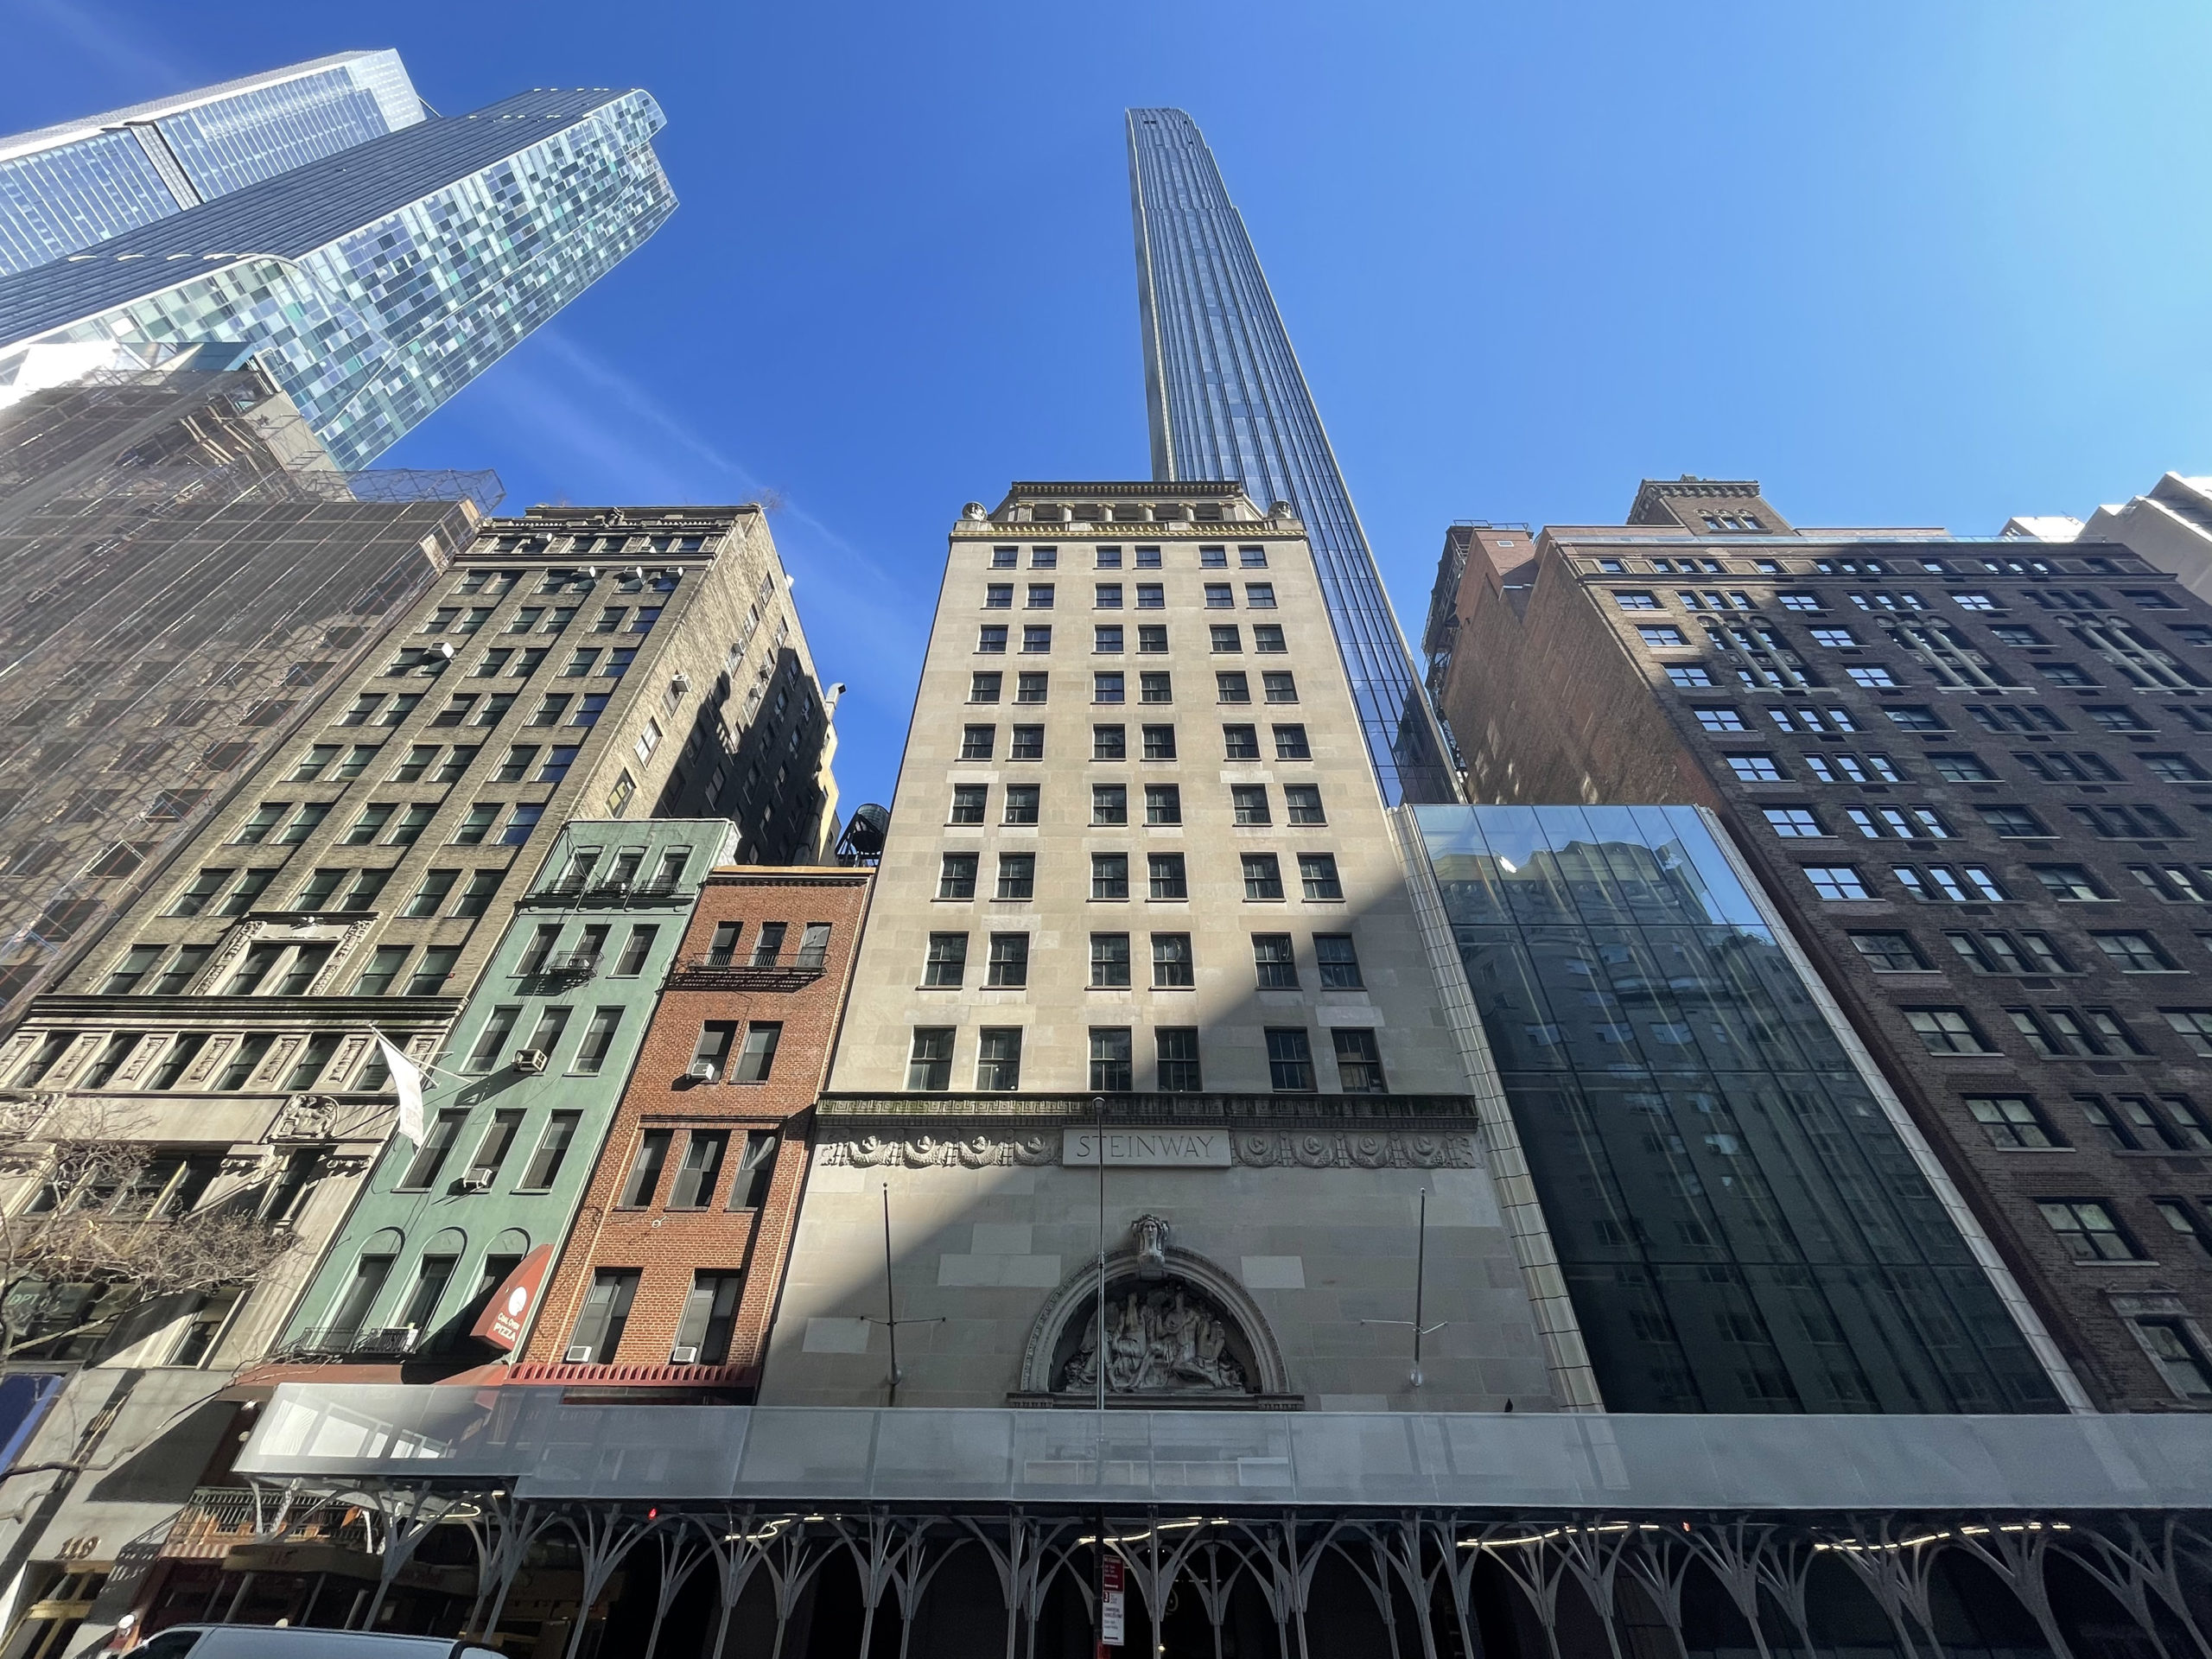
The proposal with the most floors is the 79-story tower slated for 265 South Street in Two Bridges on the Lower East Side. The project will boast nearly 1.3 million square feet and offer 1,803 residential units, significantly boosting the city’s still-scarce housing stock. Next on the list is the 70-story, 98-unit tower proposed at 520 Fifth Avenue, bringing a new supertall to Midtown’s Grand Central Terminal area.
Next on the list are the 69-story 42-02 Orchard Street in Long Island City, which will become the tallest building in Queens, and the 69-story 100 West 37th Street, which will further transform the rapidly growing skyline of Midtown South.
259 Clinton Street, design by Perkins Eastman
Rounding off the 50-story plus list are 259 Clinton Street in Two Bridges (62 stories), 495 Eleventh Avenue in Hudson Yards (61 stories), 1710 Broadway in the Theater District (54 stories), and 589 Fulton Street in Downtown Brooklyn. The project proposed at 26-32 Jackson Avenue in Long Island City, Queens, almost made the cut at 49 stories.
Manhattan West. Photo by Michael Young
Average number of floors per filing
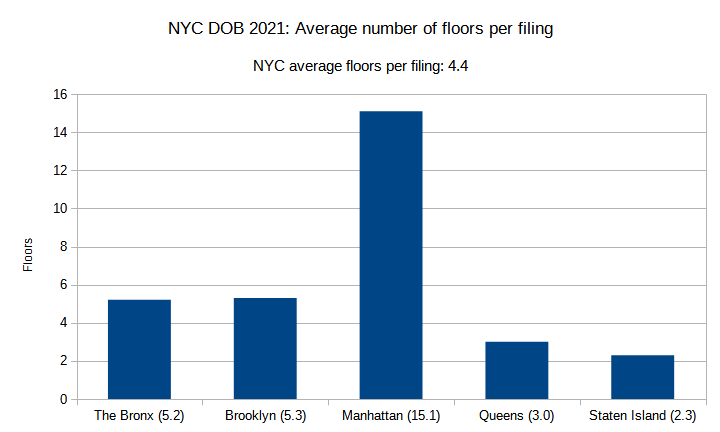
NYC DOB 2021: Average number of floors per filing. Credit: Vitali Ogorodnikov
In general, the floor count development pattern has persisted from last year, with Manhattan leading with high-rise numbers, The Bronx and Brooklyn sitting solidly in mid-rise territory, and Queens and Staten Island tending toward the low-rise.
The Bronx and Queens both dipped slightly, lowering from 5.8 to 5.2 and from 3.2 to 3.0 average floors per filing, respectively. Staten Island has maintained its 2.3-story average. Brooklyn’s average rose by half a floor, from 4.8 to 5.3. The biggest gain, in terms of both overall and relative numbers, has been observed in Manhattan, where a boost from 11.5 to 15.1 floors per average filing reflects an increase of 31 percent.
In Manhattan, the filing with the highest floor count is the 79-story tower proposed at 265 South Street in Two Bridges on the Lower East Side. One more building (520 Fifth Avenue) will rise 70 stories. Three will stand within the 60-story range (100 West 37th Street, 69 floors; 259 Clinton Street, 62 floors; and 495 Eleventh Avenue, 61 floors). The only other building in the 50-story-plus range will rise at 1710 Broadway, with 54 stories. In all, there were 45 filings for buildings with ten and more stories in Manhattan.
Concept rendering of 320 West Fordham Road, by Greenberg Farrow
The Bronx tallies 13 filings with ten and more stories, with the highest floor counts observed at 3250 Westchester Avenue and 320 West Fordham Road, with 17 floors each.
By comparison, Brooklyn packs a much stronger skyline punch with eight 30-story-plus filings (589 Fulton Street, 52 floors; 570 Fulton Street, 45 floors; 356 Fulton Street, 46 floors; 105 River Street, 42 floors; 16 DuPont Street, 40 floors; 55 Willoughby Street, 38 floors; 15 Hanover Place, 34 floors; and 71 Prince Street, 33 floors). In all, Brooklyn tallies 43 ten-story-plus filings, nearly matching Manhattan. However, it also has a greater number of low-rise filings than The Bronx does, leading to a nearly identical average for the two boroughs.
The total number of ten-story-plus filings in Queens adds up to 25, nearly double the figure for The Bronx and just over half those of Brooklyn and Manhattan. However, the borough is about to welcome its new tallest building at 42-02 Orchard Street in Long Island City, where a 69-story tower will become the first skyscraper in the borough to rise over 800 feet. Four more buildings will stand above 30 stories, with three also sited in Long Island City (26-32 Jackson Avenue, 49 stories; 30-05 Queens Boulevard, 46 stories; and 23-08 42nd Road, 35 stories) and one in Rego Park (61-10 Junction Boulevard, 32 stories).
The tallest permit filing in Staten Island, which registers at eight stories, is located at 560 Bay Street. Two buildings are slated to rise seven stories and two more five stories, with the rest of the permits following the borough’s prevailing mid- and low-rise typology.

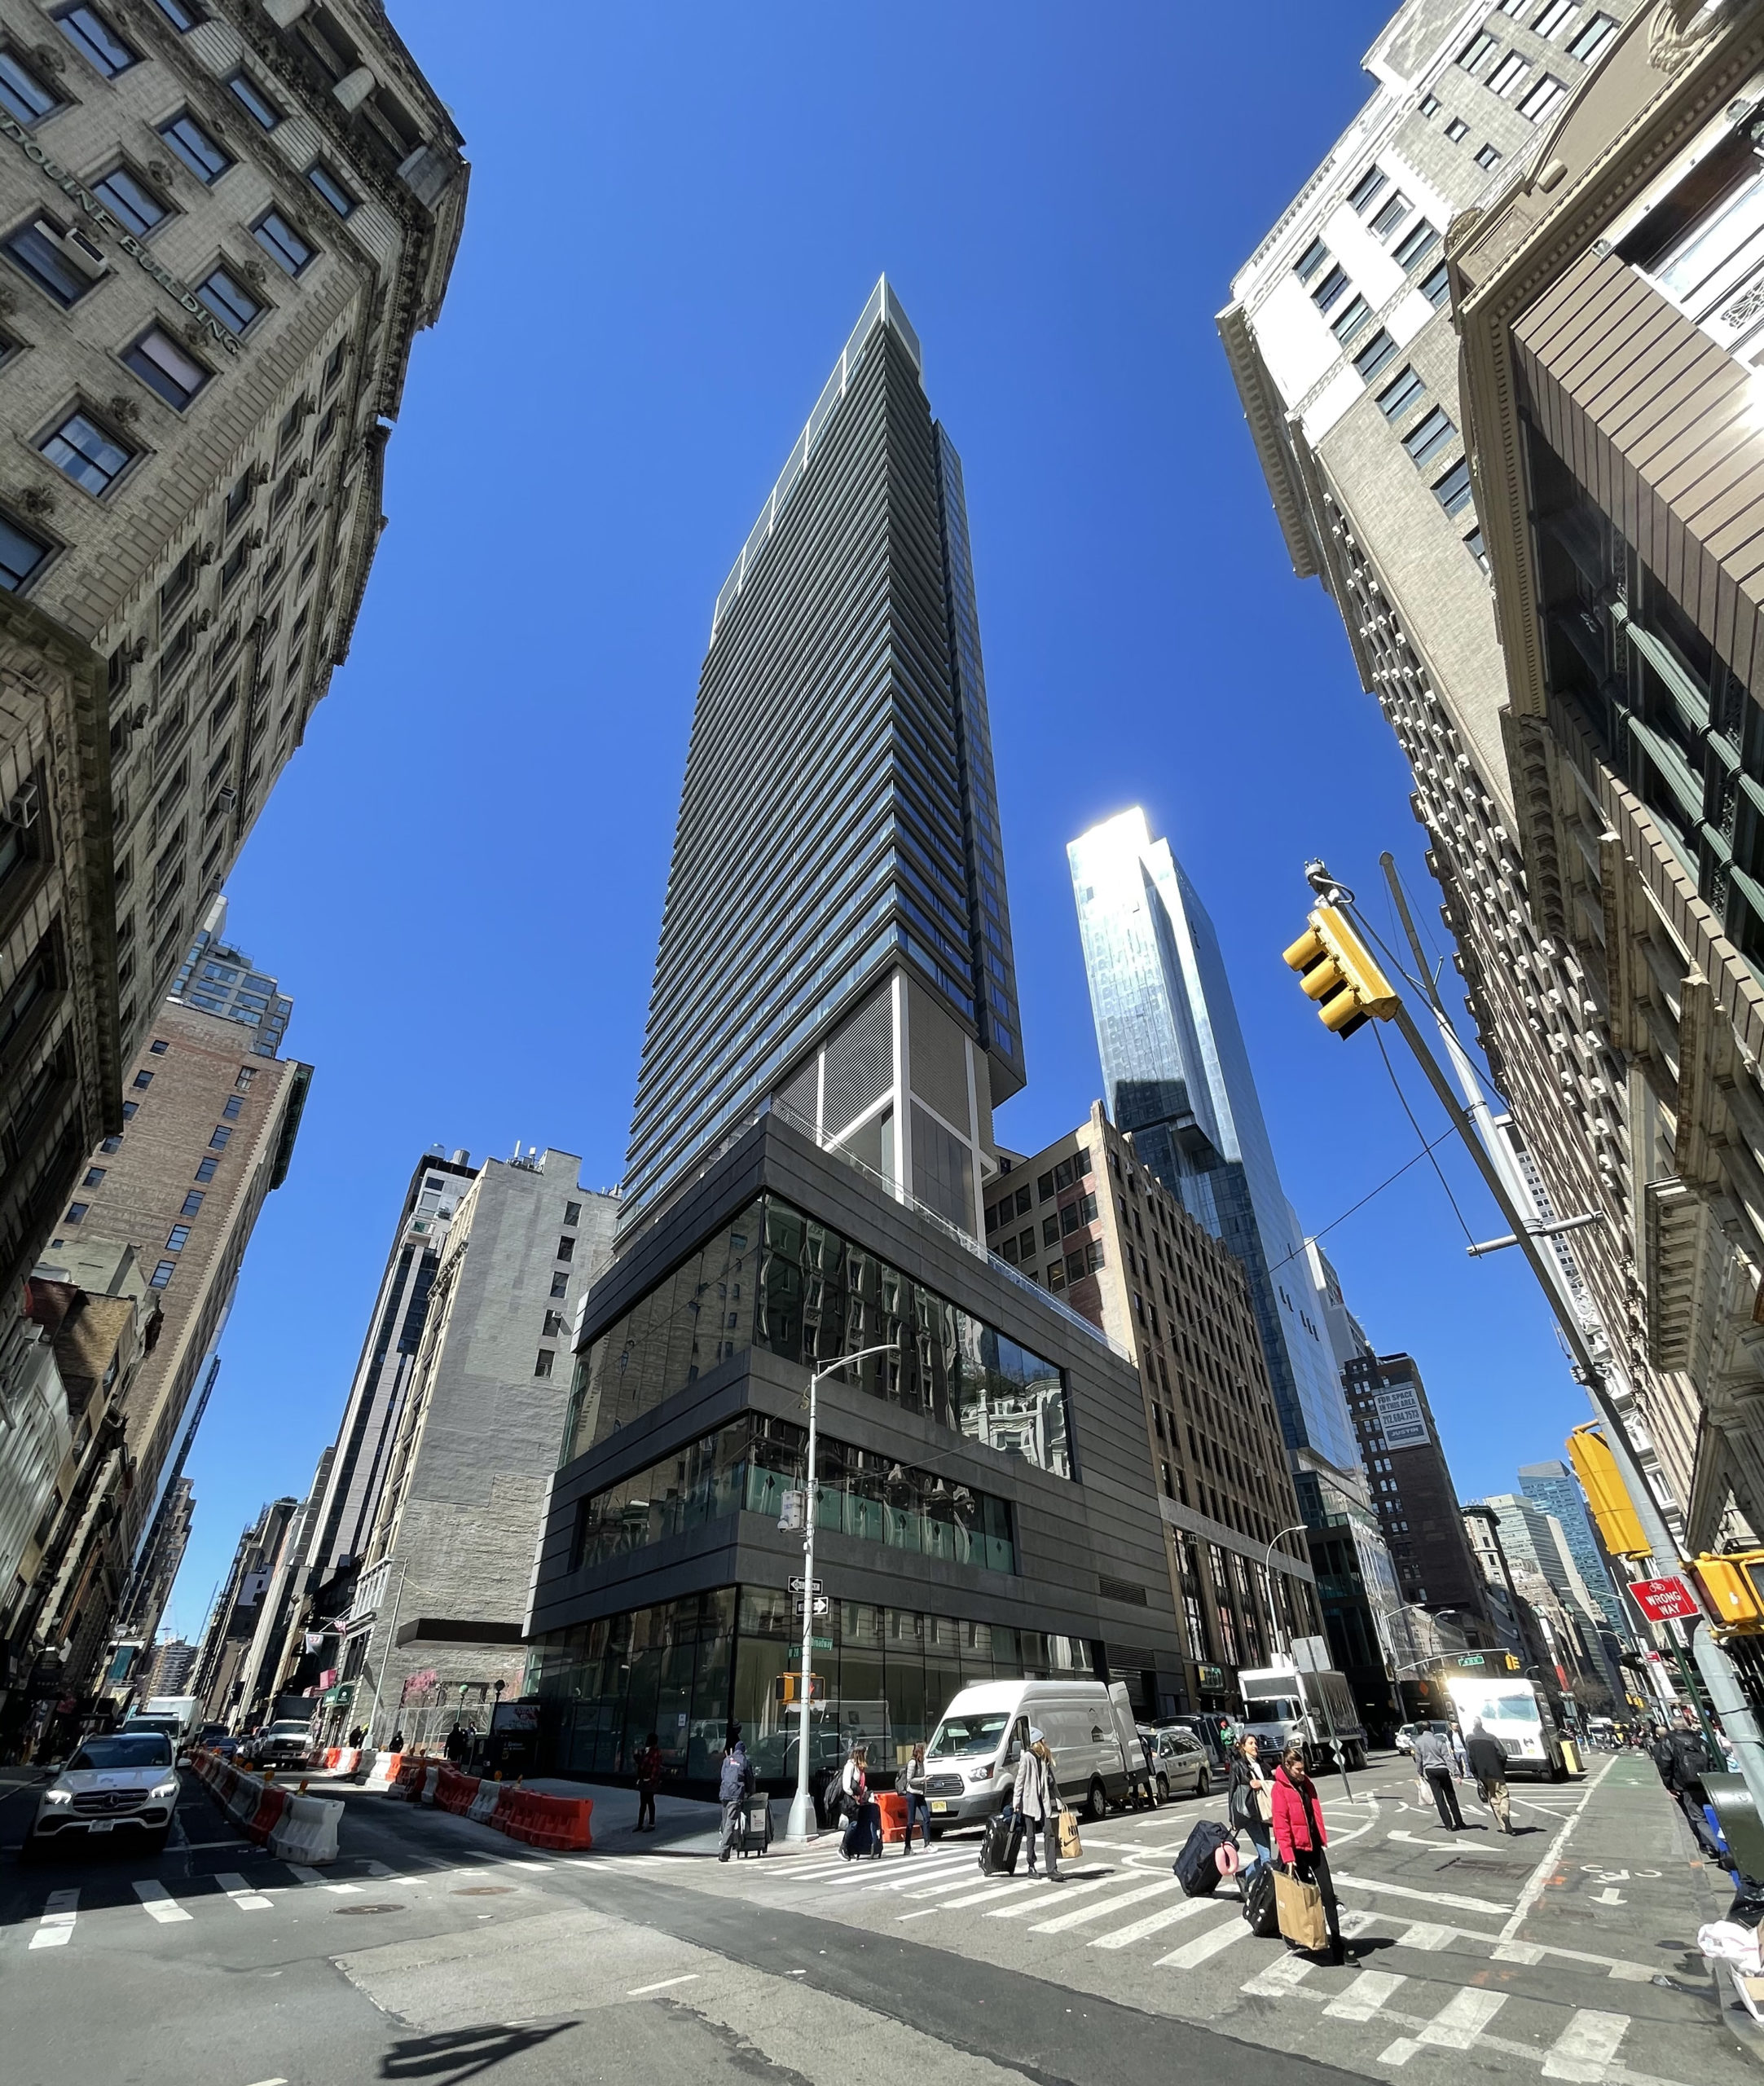
TSX Broadway. Photo by Michael Young
Floor area per filing
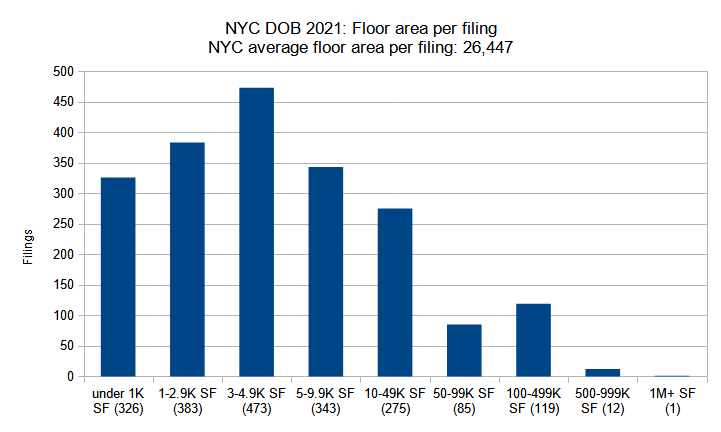
NYC DOB 2021: Floor area per filing. Credit: Vitali Ogorodnikov
The year 2021 saw a total volume of project filings equaling 53.3 million square feet, an eight-percent drop from the previous year’s total of 57.6 million square feet. The size of the average filing has also shrunk from 32,514 square feet to 26,447 square feet, a 23-percent decrease. As before, the majority of the filings fall in the smaller area range, with 1,800 filings, or 89 percent of the total, spanning under 50,000 square feet, which also happens to match the percentage of filings within the same range from the previous year.
While the general distribution remains relatively similar between the two years, the numbers have decreased in the 1,000 to 3,000-square-foot and 1,000 to 100,000-square-foot categories, and increased in the categories spanning under 1,000 square feet, 3,000 to 5,000 square feet (which has become the largest category), and 100,000 to 500,000 square feet.
At the top end of the range, the filing count has remained relatively stable within the half-million to one-million-square-foot category, rising from 11 to 12. Curiously, the number of filings spanning over one million square feet has plummeted from eight to just one.
The top filings are relatively evenly spread between three of the city’s northern boroughs. The five largest filings submitted in 2021 are 265 South Street (1,274,280 square feet) in Manhattan, 950 East 149th Street (986,360 square feet) in The Bronx, 61-10 Junction Boulevard (824,183 square feet) and 42-02 Orchard Street (796,245 square feet) in Queens, and 495 Eleventh Avenue (794,671 square feet) in Manhattan.
1185 Broadway. Photo by Michael Young
Total filing floor area by borough
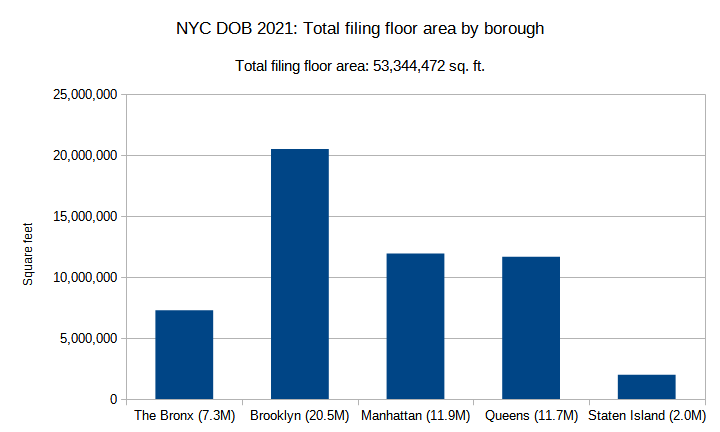
NYC DOB 2021: Total filing floor area by borough. Credit: Vitali Ogorodnikov
In 2021, Brooklyn’s 20.5 million square feet accounted for 38 percent of the city’s 53.3-million-square-foot total, which is by far the largest share of any borough. The figure nearly doubles the square footage of either Manhattan or Queens, which are nearly tied for second place at 11.9 million and 11.7 million square feet, respectively. The Bronx trails behind at 7.3 million square feet, yet the count still more than triples Staten Island’s 2-million-square-foot total.
Compared to last year, the volume of square footage per borough has been shaken up completely. The total for The Bronx has dropped by more than half from 15.3 million square feet. Inversely, Brooklyn’s total nearly doubled its previous-year 11.8-million-square-foot total, as did Manhattan, which registered 6.7 million square feet of filings in 2020. Queens’ share has shrunk somewhat from its last year’s leading count of 15.7 million square feet. Relatively speaking, Staten Island has experienced the steepest drop, with a figure that now accounts to only one-quarter of its 2020 total.
The largest 2021 filings per borough are as follows: 265 South Street (1,274,280 square feet) in Manhattan, 950 East 149th Street (986,360 square feet) in The Bronx, 61-10 Junction Boulevard (824,183 square feet), 105 River Street (515,739 square feet) in Brooklyn, and 1 Nassau Place (332,009 square feet) in Staten Island. The latter development, proposed in Tottenville near the island’s southern tip, is one of the borough’s two 100,000-square-foot-plus filings, with the other being 560 Bay Street (263,379 square feet) in Stapleton.
570 Fulton Street. Photo by Michael Young
Average floor area per filing per borough
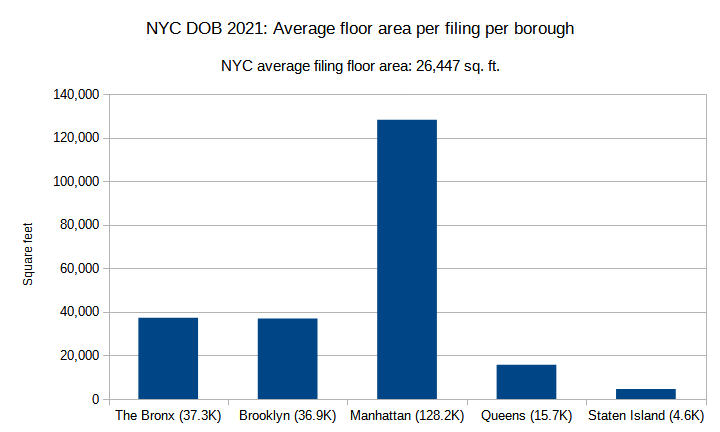
NYC DOB 2021: Average floor area per filing per borough. Credit: Vitali Ogorodnikov
In 2021, the square footage per typical permit filing in New York City has averaged 26,447 square feet, roughly equivalent to a mid-sized apartment building. Since 2020, Manhattan has drastically increased its lead over the other boroughs in terms of the size of the average floor area per filing, surging from an already impressive 82,344 square feet to a massive 128,176 square feet. By contrast, the average filing size in The Bronx, which last year nearly tied Manhattan with an average of 72,401 square feet, has now shrunk by roughly half, down to 37,311 square feet.
Brooklyn’s average has increased considerably, by 56 percent, rising from the previous year’s 23,630 square feet to 36,883 square feet, nearly matching the total for The Bronx. The size of the average filing in Queens, which in the previous year outpaced Brooklyn with an average of 28,532 square feet, has dropped to fourth place after a 55-percent decrease down to an average of 15,681 percent. Staten Island, which in 2020 held the smallest average filing size in the city at 18,832 square feet, has since seen its average filing size shrink nearly four times down to 4,628 square feet.
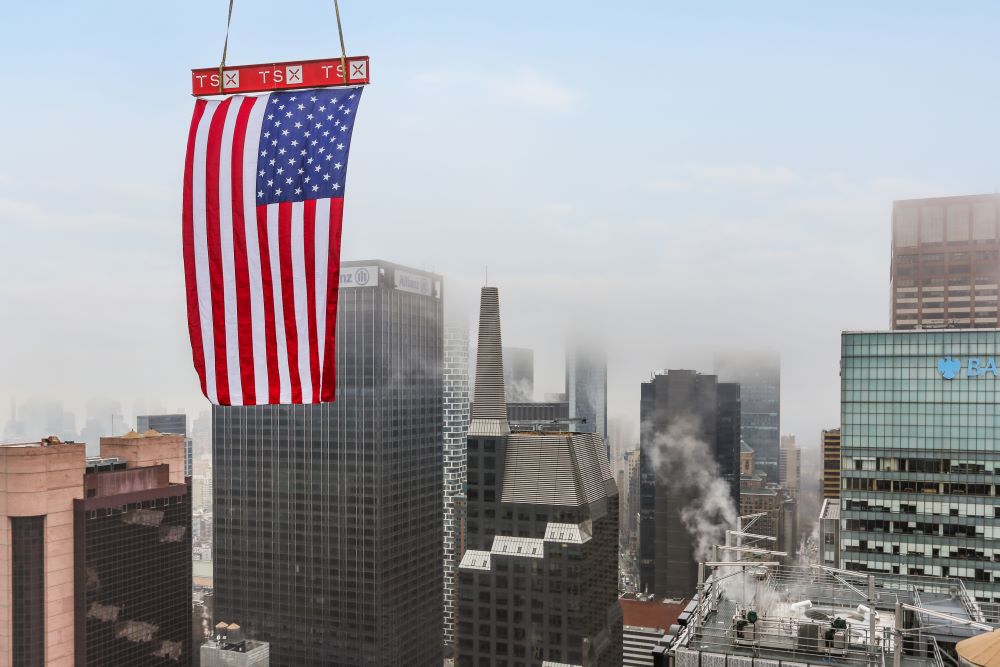
Final flag and beam rises above Manhattan at TSX Broadway (1568 Broadway) – L&L Holding Company
Number of permit filings per month
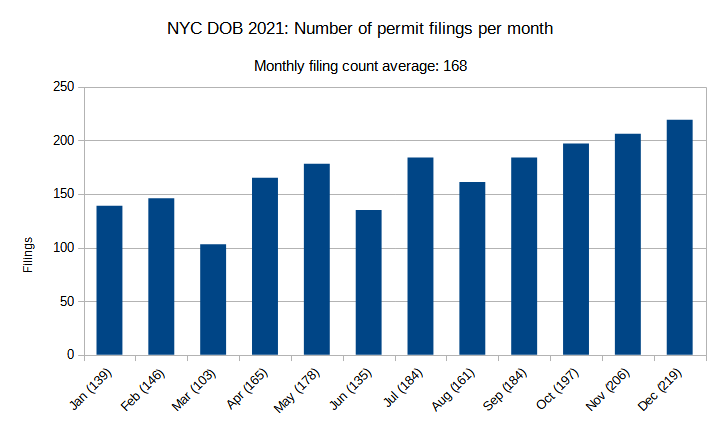
NYC DOB 2021: Number of permit filings per month. Credit: Vitali Ogorodnikov
In 2020, the number of permit filings per month remained generally constant, with an average of 148 and a slight dip around the summer. By contrast, the tally for 2021 showed sustained upward momentum in monthly filing count averages throughout the year, a curious yet highly encouraging trend further boosted by an increase in monthly averages by 20 points, rising up to 168.
In the first half of 2021, monthly figures hovered around around the 2020 averages. 2021’s lowest count, observed in March at 103 filings, was lower than any seen in the previous year; the highest count in the first half of 2021, registered in May with 178 filings, nearly matched 2020’s record 189 monthly filings, which also, coincidentally, also took place in May.
The steady growth over the course of 2021 meant that the second half of the year well exceeded anything observed in 2020, with each month in 2021 outpacing all but the highest-ranking figures from 2020, and the last three months of the year beating 2020’s records altogether. The highest volume of permit filings was observed in December, where a count of 219 filings represents 16-percent growth compared to the highest tally from 2020.
Manhattan West. Photo by Michael Young
In our 2020 report, which tracked one of New York City’s most difficult periods in recent memory, we expressed optimism in the city’s stalwart endurance and forward progress. The 2021 report shows that such notions were not grounded in hollow boosterism, but rather in what turned out to be an accurate prognosis of the city’s improving fortunes.
As the numbers show, hundreds more construction permits have been filed in 2021 than in the previous year, with thousands more residential and hotel units as compared to the previous year. Notably, there has also been an increase in the height and number of proposed skyscrapers, which are a physical manifestation of New York City’s unrelenting economic dynamo and persevering spirit of progress.
Photo by Michael Young
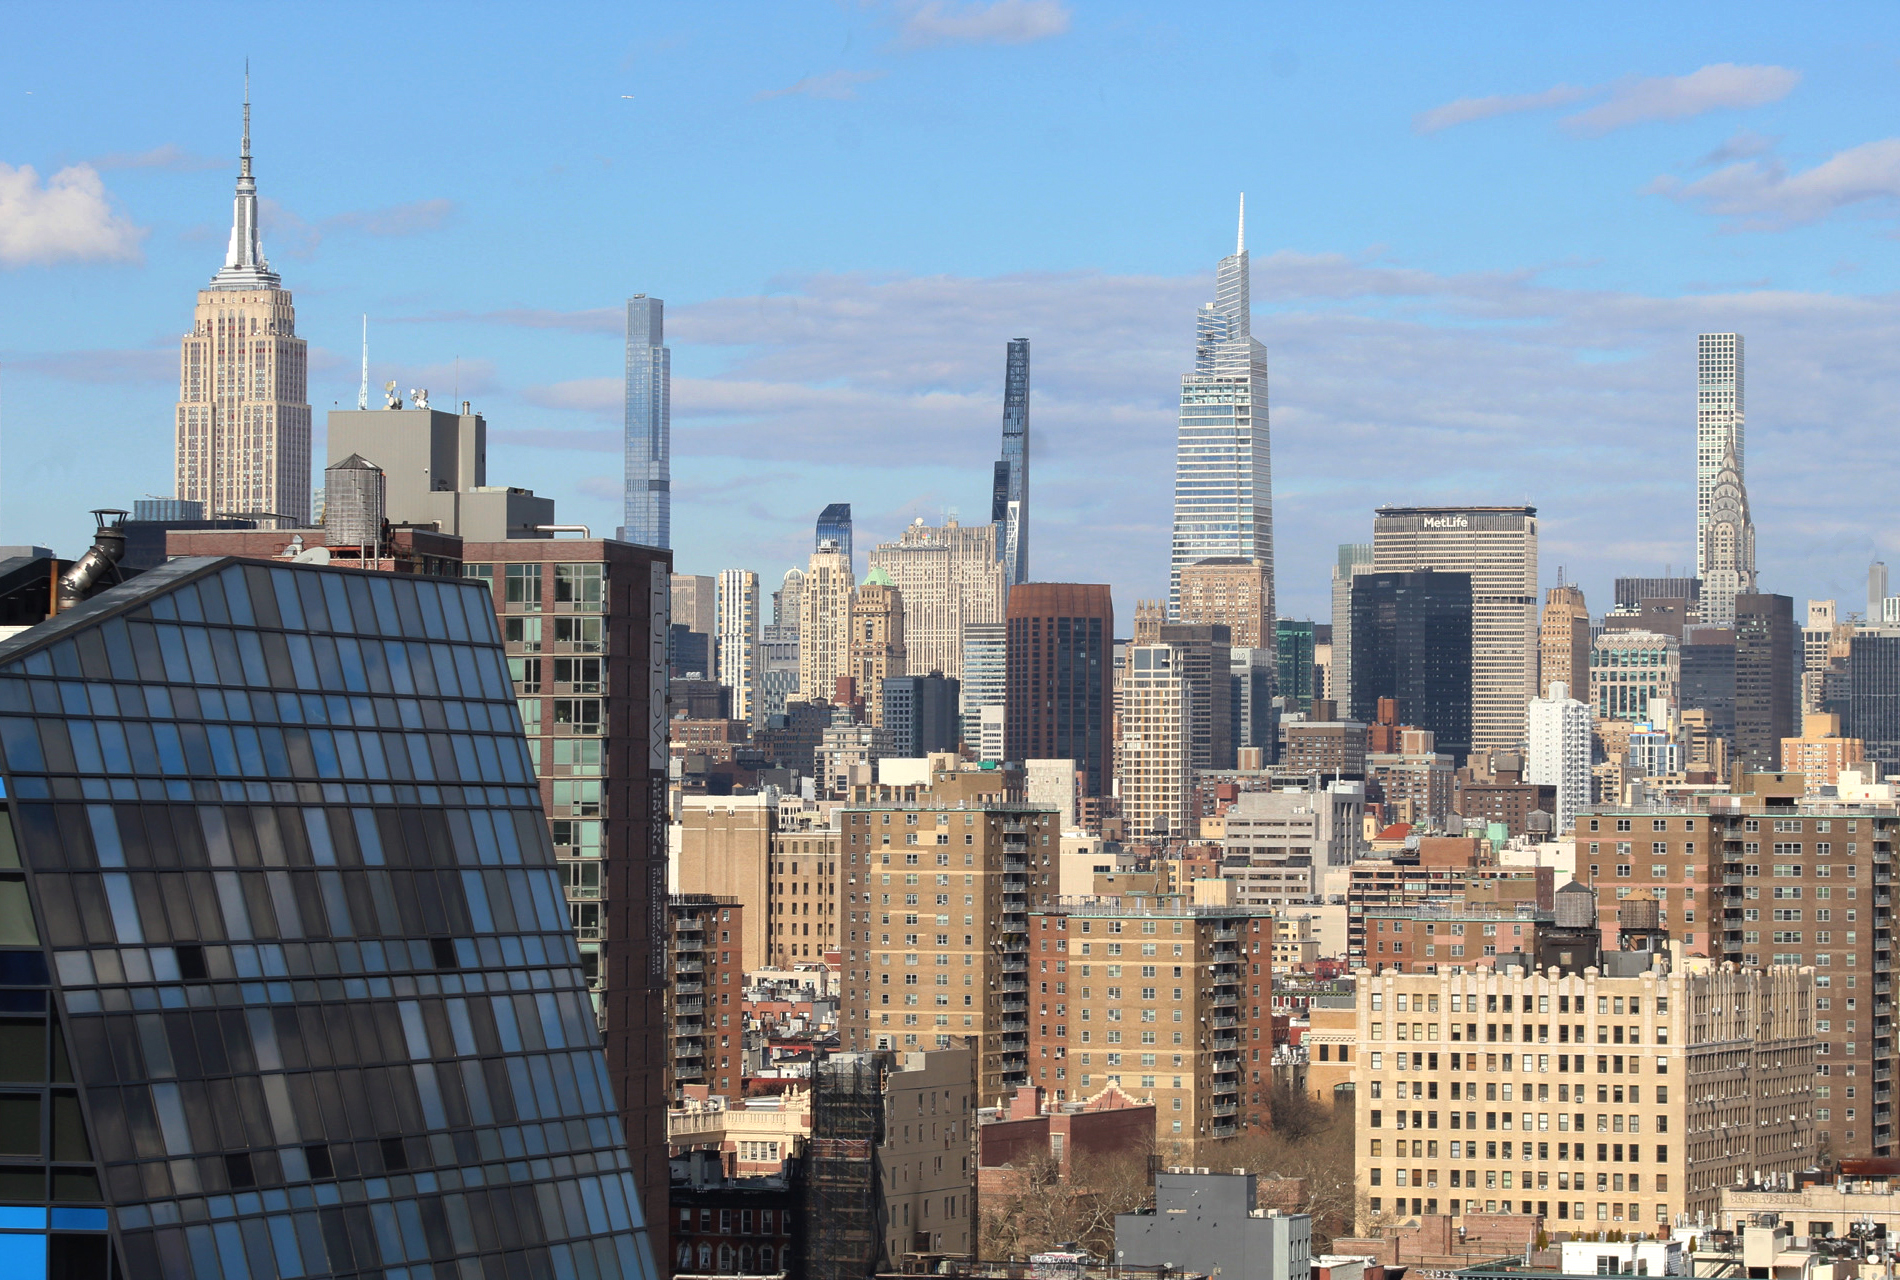
Photo by Michael Young

Calyer Place. Photo by Michael Young

Gotham Point (left). Photo by Michael Young

Photo by Michael Young
Subscribe to YIMBY’s daily e-mail
![]()
Follow YIMBYgram for real-time photo updates
Like YIMBY on Facebook
Follow YIMBY’s Twitter for the latest in YIMBYnews
Good news
We need more housing stock, especially in the outer boroughs
This is very good news, for all concerned. Also good news is the steady climb in numbers of permits pulled throughout the year.
However, can we see a breakdown as between units of housing and hotel units?
It seems quite obvious that THAT is the crucial unanswered question left open here.
Agree that seeing housing and hotel units separately would be helpful. It’s not like the two are interchangeable… hotel rooms are not legal housing units and even when former hotels are converted to apartments it requires really extensive work that typically totally changes the floorplans and room/unit counts.
Building all this for people that don’t exist.
One clarifying question – the opening paragraph lists 1,774 permits filed in 2020, but a paragraph or so down, it lists 1,772 permits filed in 2020, and it alternately lists this as a 13 and 14% increase. I believe it would round to 14% in either case, but could you confirm the accurate 2020 figure?